Axcelis Technologies, Inc.

Axcelis Technologies, Inc. (ACLS) Market Cap

Axcelis Technologies, Inc. has a market capitalization of $4.52B.

Price: $147.16

-14.71 (-9.09%)

Market Cap: 4.52B

NASDAQ · time unavailable

CEO: Russell J. Low

Sector: Technology

Industry: Semiconductors

IPO Date: 2000-07-11

Website: https://www.axcelis.com

Axcelis Technologies, Inc. (ACLS) - Company Information

Market Cap: 4.52B|Sector: Technology

Company Profile

Axcelis Technologies, Inc. designs, manufactures, and services ion implantation and other processing equipment used in the fabrication of semiconductor chips in the United States, Europe, and Asia. The company offers high energy, high current, and medium current implanters for various application requirements. It also provides aftermarket lifecycle products and services, including used tools, spare parts, equipment upgrades, maintenance services, and customer training. It sells its equipment and services to semiconductor chip manufacturers through its direct sales force. The company was founded in 1978 and is headquartered in Beverly, Massachusetts.

Analyst Sentiment

38%
Underperform

From 5 Active Polls

1Y Forecast: $128.00

▼ -13.0% Potential Upside

Consensus Target Metrics

Low Bound

$100

Median

$110

High Bound

$174

Average

$128

Price & Moving Averages

Loading chart...

🎯 Wall Street Analyst Intelligence Report

1-Year structural target targets, chart projections, and sentiment maps.

Average 1Y Target
$128.00
▼ -13.02% Upside
Low Target
$100.00
-32% Risk
Median Target
$110.00
-25% Mid
High Target
$174.00
18% Max
Consensus
Buy
8 / 12 Buys

Consensus Trend Projection

Trailing closures vs. 12-month metrics map.

Analyst Vote Distribution

Aggregate institutional coverage sentiment weights.

📊 Historical Valuation Multiples

Real-time Trailing Twelve Month (TTM) momentum side-by-side with discrete quarterly metrics.

Fiscal QuarterTTMQ1 2026Q4 2025Q3 2025Q2 2025Q1 2025Q4 2024Q3 2024Q2 2024
Period EndingTrailing 12MMar 31, 2026Dec 31, 2025Sep 30, 2025Jun 30, 2025Mar 31, 2025Dec 31, 2024Sep 30, 2024Jun 30, 2024
Market Cap ($M)4,5232,8602,4853,0572,2341,6022,2653,4134,586
Enterprise Value ($M)4,4142,7512,3812,9122,1031,4622,1863,3374,486
Price to Earnings Ratio (P/E)44.8277.5918.1129.4117.8014.0211.3417.5622.54
Price/Earnings-to-Growth Ratio (PEG)1.573.0017.30866.4513.74
Price to Sales Ratio (P/S)5.3514.3710.4214.3111.488.328.9813.3017.88
Price to Book Ratio (P/B)4.332.742.403.002.181.562.243.504.91
Price to Free Cash Flow Ratio (P/FCF)51.12175.44-279.1070.5459.1846.00278.9381.55120.49
Enterprise Value to Sales (EV/Sales)13.839.9913.6310.817.598.6613.0117.49
Enterprise Value to EBITDA (EV/EBITDA)33.05222.0951.9884.4651.4637.7133.9655.0679.15
Debt to Equity Ratio-0.820.040.040.040.040.040.040.050.05

ACLS Growth Runway Model

Standard long term linear growth fade

Multi-Stage Discounted Cash Flow Sandbox

Market Price$147.16
Intrinsic Value$175.35
Market Alignment
Undervalued by 19.2%relative to calculated intrinsic value
9.00%
Exp: 9%9%
i

Growth runway slowdown

This value provides a time window for the growth rate to decline beyond Stage 1 toward the terminal rate. Longer windows are most useful for companies with high growth starting conditions or strong competitive advantages. This option stretches out the growth rate slowdown across 5, 10, or 15-year steps. A high-growth starting condition (exceeding a 25% initial growth rate) automatically applies a curve decay to simulate realistic, rapid market saturation.
i

Terminal growth rate

With long-term inflation between 3-5%, revenue must grow by that baseline to maintain flat real-world market share. This value sets the permanent terminal growth rate to factor into the valuation beyond the growth slowdown runway toward maturity.

3-Stage Financial Runway Horizon

🧠 Perpetuity Horizon Engine (Stage 3: Post-2035)

Terminal FCF Base$0.28B
Perpetuity TV Value$5.32B
Discounted TV (PV)$2.25B
TV Weighting %62.1%
⚠️
Financial Model Disclaimer & Risk Disclosure: This interactive scenario simulator is an educational sandbox provided strictly for informational and analytical research purposes. Core historical financial statements and consensus estimates are sourced directly via Financial Modeling Prep (FMP). All downstream outputs are entirely deterministic, hypothetical projections generated by combining automated mathematical formulas (including linear interpolation and Gaussian bell-curve decay models) with user-selected variables and third-party financial data inputs. Users assume all liability for trading decisions executed based on these sandbox calculations.

📘 Full Research Report

ℹ️

AI-Generated Research: This report is for informational purposes only.

📘 AXCELIS TECHNOLOGIES INC (ACLS) — Investment Overview

🧩 Business Model Overview

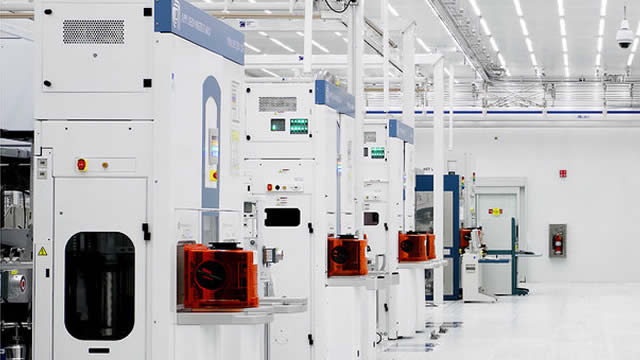
Axcelis designs and manufactures ion implantation systems used to introduce precisely controlled dopants into semiconductor wafers. The process is core to device manufacturing: implantation creates the electrical properties that drive transistor behavior, enabling logic and memory performance targets across technology nodes.

The value chain centers on (1) capital equipment sales for new tools, (2) aftermarket revenue from installed-base support (service, spare parts, and upgrades), and (3) application engineering and process integration support that helps customers qualify performance for specific device designs. This integration work, combined with the long qualification cycles typical in semiconductor fabs, drives customer stickiness.

💰 Revenue Streams & Monetisation Model

Revenue primarily comes from two buckets:

  • New tool and system sales (transactional): Typically tied to semiconductor capex cycles and technology ramp schedules. Profitability depends on system complexity, component sourcing, and production efficiency.
  • Aftermarket and services (repeatable): Includes field service, spare parts, and upgrades for systems already installed in customer fabs. This stream tends to be less cyclical than new tool demand and supports healthier margins through labor and parts mix, service coverage, and modernization programs.

Margin drivers are commonly a function of (1) gross margin on complex systems, (2) the mix of aftermarket/services versus new equipment, and (3) manufacturing scale and utilization in building systems and subcomponents. As the installed base expands, the after-market contribution to total revenue can increase, supporting more durable earnings power even through capex fluctuations.

🧠 Competitive Advantages & Market Positioning

Axcelis’ competitive position is anchored in high switching costs and process-and-qualification know-how rather than broad brand-based differentiation. Ion implantation tools must meet stringent performance specifications—dose accuracy, beam uniformity, throughput, and defect control—and customers validate tool behavior through lengthy integration into wafer process flows.

  • Switching costs (hard to replace): Changing implanter suppliers often requires requalification of recipes, lot-to-lot performance validation, and operational learning curves. This creates friction for customers to migrate installed processes away from an incumbent once production is stabilized.
  • Installed-base moat (recurring service pull-through): The installed fleet generates service and parts demand for years, creating a built-in revenue base and reducing customer “tool-by-tool” purchasing discretion.
  • Specialized application engineering (intangible asset): Achieving stable results across device generations requires deep expertise in implantation physics and practical factory operations—knowledge that is difficult to replicate quickly by new entrants.

Competitive benchmarking:

  • Nissin Ion Equipment and Sumitomo Heavy Industries are primary competitors in ion implantation equipment, generally competing on tool performance, reliability, and qualification timelines.
  • Applied Materials and Lam Research compete more broadly for semiconductor process capex share (adjacent front-end equipment categories), but Axcelis’ core advantage remains specialized implantation technology with long-cycle installed-base relationships.

Axcelis’ focus is narrower and deeper—ion implantation systems and their lifecycle support—whereas broader process equipment peers typically differentiate through wider process portfolios and cross-tool procurement dynamics.

🚀 Multi-Year Growth Drivers

The multi-year outlook is supported by semiconductor technology requirements that remain implantation-relevant across both leading-edge and power/specialty device manufacturing:

  • Scaling and precision doping requirements: As transistor structures evolve and device performance targets tighten, implantation continues to play a critical role in controlling dopant profiles and electrical characteristics.
  • Memory and logic technology ramps: Industry demand for NAND/DRAM and logic upgrades drives periodic replacement and expansion of process equipment, supporting tool demand and modernization cycles.
  • Power semiconductor expansion: Growth in applications using SiC and GaN (and associated device architectures) sustains demand for advanced doping and implantation steps, expanding the TAM beyond classic planar logic.
  • Installed-base expansion and service durability: Every new tool shipment expands the long-lived service footprint, creating an ongoing support revenue stream that can extend visibility over a cycle.

Over a 5–10 year horizon, the TAM is shaped less by “replacement frequency” alone and more by the persistence of high-precision ion implantation across evolving node architectures and specialty device growth.

⚠ Risk Factors to Monitor

  • Semiconductor capex cyclicality: New tool orders are sensitive to memory/logic spending cycles; after-market revenue is typically more resilient but not immune to broader utilization slowdowns.
  • Technology process substitution risk: Device engineering progress can alter process flows; if implantation steps are reduced or re-architected, tool demand can compress.
  • Competitive performance and qualification outcomes: Competitors with comparable tool specs can win share if they achieve faster customer qualification or deliver better throughput/reliability economics.
  • Execution and supply chain constraints: Complex components, high-spec manufacturing, and field support capacity can affect delivery schedules and service responsiveness.
  • Warranty, performance, and customer concentration: Tool performance issues can create financial exposure through remediation costs; concentration in major wafer-fab customers can amplify demand swings.

📊 Valuation & Market View

Equity markets typically value semiconductor equipment specialists through a combination of EV/EBITDA and P/S frameworks, with the following factors moving valuation:

  • Revenue durability and mix shift: Greater service/aftermarket contribution can support higher quality-of-earnings perceptions.
  • Gross margin trajectory: Product and manufacturing scale, plus recurring parts/service mix, influences multiple expansion.
  • Operating leverage: How quickly operating expenses convert to incremental gross profit through cycle recovery.
  • Order and backlog quality: Not just size, but the share tied to advanced platforms and expected qualification success.

Because this is a capital equipment business with an aftermarket “shadow,” market expectations often converge on the sustainability of installed-base growth and the persistence of implantation intensity per wafer.

🔍 Investment Takeaway

Axcelis is positioned as a specialized ion implantation supplier with structural switching costs driven by tool qualification, process integration, and long-lived installed-base support. The investment thesis rests on (1) implantation’s continued importance as semiconductor architectures evolve, and (2) the compounding effect of a growing installed fleet that supports recurring services and upgrades. Upside is tied to technology ramps and installed-base monetization; downside risk is primarily capex cyclicality and potential process-flow substitution.


⚠ AI-generated — informational only. Validate using filings before investing.

📰 Market News & Coverage

15 Stories Available

Real-time institutional reporting and market updates for ACLS.

zacks.com2026-06-03

Do Options Traders Know Something About Axcelis Stock We Don't?

Investors need to pay close attention to ACLS stock based on the movements in the options market lately.

zacks.com2026-06-03

Axcelis Technologies (ACLS) Just Flashed Golden Cross Signal: Do You Buy?

From a technical perspective, Axcelis Technologies (ACLS) is looking like an interesting pick, as it just reached a key level of support. ACLS recently overtook the 20-day moving average, and this suggests a short-term bullish trend.

fool.com2026-06-02

An Axcelis Technologies Vice President Sold 2,000 Company Shares. What Does That Mean for Investors?

This semiconductor equipment maker, up over 160% in a year, reported a notable insider sale amid ongoing portfolio adjustments.

fool.com2026-05-26

If You Like Micron Technology, You Might Love This Other Super Semiconductor Stock

This under-the-radar stock is up 170% over the past year, and more upside could be ahead.

prnewswire.com2026-05-12

Axcelis Announces Participation in Upcoming Investor Conferences

BEVERLY, Mass., May 12, 2026 /PRNewswire/ -- Axcelis Technologies, Inc. (NASDAQ: ACLS), a leading supplier of enabling ion implantation solutions for the semiconductor industry, announced the company's plans to participate in the following upcoming investor conferences: The J.P.

seekingalpha.com2026-05-08

Axcelis Technologies, Inc. (ACLS) Q1 2026 Earnings Call Transcript

Axcelis Technologies, Inc. (ACLS) Q1 2026 Earnings Call Transcript

zacks.com2026-05-07

Axcelis Technologies (ACLS) Surpasses Q1 Earnings and Revenue Estimates

Axcelis Technologies (ACLS) came out with quarterly earnings of $0.72 per share, beating the Zacks Consensus Estimate of $0.71 per share. This compares to earnings of $1.04 per share a year ago.

prnewswire.com2026-05-07

Axcelis Announces Financial Results for First Quarter 2026

Q1 2026 Highlights: Revenue of $199.0 million GAAP Gross Margin of 40.5%, and Non-GAAP Gross Margin of 40.7% GAAP Operating Margin of 4.0% and Non-GAAP Operating Margin of 11.7% GAAP Diluted Earnings Per Share of $0.30, and Non-GAAP Diluted Earnings Per Share of $0.72   BEVERLY, Mass., May 7, 2026 /PRNewswire/ -- Axcelis Technologies, Inc. (Nasdaq: ACLS) today announced financial results for the first quarter ended March 31, 2026.

prnewswire.com2026-05-06

Axcelis to Participate in ASMC 2026

BEVERLY, Mass., May 6, 2026 /PRNewswire/ -- Axcelis Technologies, Inc. (NASDAQ: ACLS), a leading supplier of enabling ion implantation solutions for the semiconductor industry, announced today it will participate in the Advanced Semiconductor Manufacturing Conference (ASMC) taking place May 11 - 14, 2026, at the Hilton Albany in Albany, New York.

zacks.com2026-04-24

Axcelis Technologies (ACLS) Exceeds Market Returns: Some Facts to Consider

The latest trading day saw Axcelis Technologies (ACLS) settling at $143.13, representing a +2.34% change from its previous close.

prnewswire.com2026-04-23

Axcelis Announces Timing and Availability of First Quarter 2026 Results and Conference Call

BEVERLY, Mass., April 23, 2026 /PRNewswire/ -- Axcelis Technologies, Inc. (Nasdaq: ACLS), a leading supplier of enabling ion implantation solutions for the semiconductor industry will release financial results for the first quarter of 2026 after market close on Thursday, May 7, 2026.

zacks.com2026-04-21

How Axcelis-Veeco Merger Might Pan Out Amid Near-Term Uncertainty

ACLS' $4.4B all-stock deal for VECO could broaden its tool lineup - if integration and China approval do not slow a near-term close.

gurufocus.com2026-04-20

Axcelis Technologies Inc (ACLS) Shares Surge 10.3% -- What GF Score of 89 Tells Investors

On April 20, 2026, Axcelis Technologies Inc (ACLS) shares rose 10.3% to a current price of $131.02. This increase comes amid a significant upward trend in the s

gurufocus.com2026-04-15

Axcelis Technologies Inc (ACLS) Shares Surge 4.3% -- What GF Score of 92 Tells Investors

On April 15, 2026, Axcelis Technologies Inc (ACLS) shares rose 4.3% today, closing at $117.88. The stock has experienced significant price movements, trading be

defenseworld.net2026-04-14

Eagle Bay Advisors LLC Has $257,000 Holdings in Axcelis Technologies, Inc. $ACLS

Eagle Bay Advisors LLC cut its position in Axcelis Technologies, Inc. (NASDAQ: ACLS) by 72.2% during the fourth quarter, according to its most recent 13F filing with the Securities and Exchange Commission. The fund owned 3,200 shares of the semiconductor company's stock after selling 8,295 shares during the quarter. Eagle Bay Advisors LLC's

📊 AI Financial Analysis

Powered by StockMarketInfo
Earnings Data: Q Ending 2026-03-31

"ACLS reported Q1’26 revenue of $198.96M and net income of $9.21M (EPS $0.30). On a YoY basis, revenue rose from $192.56M in Q1’25 to $198.96M (+3.3%), while net income increased from $28.58M to $9.21M (down -67.8%). Sequentially (QoQ), revenue declined from $238.33M in Q4’25 to $198.96M (-16.6%), and net income fell from $34.30M to $9.21M (-73.1%). Profitability compressed meaningfully: gross margin was 40.5% in Q1’26 vs. 46.5% in Q1’25, and net margin was 4.6% vs. 14.8% YoY. Margins also weakened QoQ versus Q4’25 (net margin 4.6% vs. 14.4%). Operating income and EBITDA contracted sharply, indicating cost or mix pressure and/or a less favorable quarter. Cash flow quality was solid but volatile: operating cash flow was $18.1M and free cash flow was $18.1M in Q1’26. The balance sheet remains highly liquid with cash & short-term investments of $366.6M and net debt of about -$108.9M (net cash), while total equity increased to ~$1.04B. Shareholder returns look very strong on price momentum (1Y change +166.1%). With no dividends reported and no buybacks in Q1’26, total shareholder value appears dominated by capital appreciation."

Revenue Growth

Neutral

Revenue growth was modest YoY (+3.3% to $198.96M) but down materially QoQ (-16.6% from Q4’25’s $238.33M), suggesting a weaker sequential quarter.

Profitability

Neutral

Margins and earnings deteriorated sharply: net income -67.8% YoY and net margin fell to 4.6% (from 14.8% in Q1’25). QoQ net income -73.1% indicates contraction in profitability versus Q4’25.

Cash Flow Quality

Positive

Q1’26 generated positive operating cash flow ($18.1M) and free cash flow ($18.1M). However, cash flow was much lower than Q3’25 ($45.4M) and sharply below Q4’25 (-$6.6M), indicating volatility.

Leverage & Balance Sheet

Good

Strong liquidity with cash & short-term investments of $366.6M and net cash position (netDebt ~ -$108.9M). Total equity is stable and slightly higher (~$1.04B).

Shareholder Returns

Strong

Very strong capital appreciation: 1Y stock performance +166.1%. No dividend and no buybacks reported in Q1’26, but price momentum materially boosts total return.

Analyst Sentiment & Valuation

Caution

Valuation appears demanding (price-to-earnings ~77.6x using current quarter EPS; high price/earnings reflects the recent earnings drop). Without current analyst revision details, upside/downside is less clear given deteriorating profitability.

Disclaimer:This analysis is AI-generated for informational purposes only. Accuracy is not guaranteed and this does not constitute financial advice.

Fundamentals Overview

Loading fundamentals overview...

Axcelis delivered Q1 2026 results slightly above expectations: revenue of $199M and EPS of $0.72. However, performance was partially distorted by a $5M customer settlement, which reduced system revenue and pressured gross margin by ~70 bps and EPS by about $0.09. The core signal is mix and momentum. CS&I grew >30% YoY, driven by service/consumables and upgrade demand, supporting resilience even as general mature remained weak in bookings. Memory showed tangible strength with system shipments to memory at the highest since Q4 2023 and continued firming in bookings. Management sees improving silicon carbide demand signals (super junction, channeling, 200mm engagement) but still expects power and general mature digestion for the year. Accordingly, guidance stays conservative: 2026 revenue approximately flat YoY, low- to mid-40% gross margins, and ~15% tax rate, with improvement largely weighted into 2H driven by silicon carbide and continued memory strength.

AI IconGrowth Catalysts

  • CS&I momentum: CS&I revenue grew >30% YoY and exceeded expectations on service/consumables and system upgrade demand
  • Memory shipment acceleration: system shipments to the memory market reached the highest level since Q4 2023
  • Bookings durability: sequentially consistent bookings; second consecutive quarter of YoY growth on a trailing 12-month basis
  • Silicon carbide engagement improving: constructive customer conversations around super junction, channeling capabilities, and transition to 200mm
  • Advanced logic timing: shipped an early 2nm material modification system in early Q2 after no system revenue in Q1

Business Development

  • High-current Purion H6: introduced next-duration high current product and is engaging with multiple customers
  • High current win in China: secured a high current customer win (new customer) in the quarter
  • Memory manufacturer (North American): completed systems evaluation for the previously announced Purion high-current system order and continued adoption work across nodes/regions
  • 2-nanometer material modification application customer: received an early Q2 shipment for next-generation technology road map work

AI IconFinancial Highlights

  • Q1 revenue: $199M, slightly above expectations; EPS $0.72, slightly above expectations
  • One-time customer settlement: $5M headwind to system revenue; gross margin ~70 bps impact; EPS headwind of ~$0.09/share attributable to the settlement
  • Gross margin: 40.7% vs outlook 41%; primarily due to the settlement
  • Operating expenses: $57.7M vs $59M outlook; operating margin 11.7%
  • Adjusted EBITDA: $27.7M; adjusted EBITDA margin 13.9%
  • Tax rate: 14% in Q1; full-year guidance ~15%
  • Geography: China revenue up sequentially to 40% (from 32% prior quarter); Korea 28% of total revenues driven by higher memory sales
  • Backlog: $453M exit Q1
  • Q2 outlook: revenue ~$205M; gross margin ~43%; EPS ~$0.90; adjusted EBITDA ~$34M; operating expenses ~$59M

AI IconCapital Funding

  • No share repurchases in Q1
  • Cash and equivalents/marketable securities: $570M total at quarter end (including $203M long-term securities)
  • Free cash flow: $16M in Q1
  • Cash flow includes $12M in cash transaction expenses tied to the pending Veeco merger

AI IconStrategy & Ops

  • CS&I expansion playbook: expanded installed base, higher utilization rates, product innovation driving service/consumables and upgrade demand
  • Memory penetration execution: completed system evaluation for Purion high-current program and continued adoption across nodes/regions
  • Silicon carbide product direction: Purion H6 next-duration high current introduced; engagement with multiple customers
  • Segment mix management: Q2 expects higher mix from general mature and lower mix from memory and silicon carbide
  • Advance logic: no system revenue in Q1; shipped a system early in Q2 for 2nm material modification and is working with the customer on the next-generation road map

AI IconMarket Outlook

  • Full-year 2026 revenue: expected approximately flat YoY vs 2025
  • Full-year 2026 gross margin: low- to mid-40% range with mix-driven quarterly variation
  • Full-year 2026 tax rate: ~15%
  • Revenue phasing: 2H weighted due to improving silicon carbide revenue and continued memory strength
  • Merger timing: pending Veeco transaction expected to close in the second half of 2026; China regulatory approval remains the only approval outstanding

AI IconRisks & Headwinds

  • General mature expected to decline YoY in 2026 despite improving utilization; Q1 bookings softer in general mature
  • Power and silicon carbide still facing sequential moderation: silicon carbide shipments moderated sequentially; demand signals improving but timing uncertain
  • Advanced logic timing risk: Q1 had no system revenue in advanced logic (shipment deferred/advanced to early Q2)
  • Quarterly volatility in bookings and revenue (explicitly acknowledged by management); book-to-bill not guided quarterly
  • Execution/cycle risk: memory remains lumpy quarter-to-quarter depending on customer shipment timing and fab availability
  • Transactional overhang: Q1 cash outflow includes $12M Veeco-related transaction expenses (although balance sheet remains strong)

Q&A: Analyst Interest

  • Silicon photonics/data-center implant demand: Management clarified that implantation exposure in indium phosphide/gallium nitride is limited, with the notable need tied to silicon modulation/isolation implants for optical transmission data encoding. They indicated this is a smaller implant use case, not a major implantation driver.
  • General mature weakening vs utilization improvement: Management attributed softer general mature bookings to end-market digestion, but emphasized rising utilization rates and stabilization in auto with recovering industrial and early AI uptick. They maintained 2026 general mature down YoY expectations while suggesting a better setup into 2027 based on current trends.
  • Why keep full-year 2026 revenue flat despite improving memory: Management said they’re comfortable with flat due to offsetting digestion in power and general mature. They cited Q1 bookings strength but warned one quarter isn’t a trend; backlog and scheduled shipments still imply down markets in 2026, creating net-flat results.

Sentiment: MIXED

Note: This summary was synthesized by AI from the ACLS Q1 2026 earnings transcript. Financial data is complex; please verify all metrics against official SEC filings before making investment decisions.

📋 Official Regulatory 10-K / 10-Q SEC Filings

Direct authenticated documentation links to audited SEC database reports for ACLS.

SEC EDGAR Live Feed
No recent 10-K available.
No recent 10-Q available.
Loading financial data and tables...
📁

SEC Filings (ACLS)

© 2026 Stock Market Info — Axcelis Technologies, Inc. (ACLS) Financial Profile