
Ascent Industries Co. (ACNT) Market Cap
Ascent Industries Co. has a market capitalization of $139.8M.
Price: $15.47
▼ -0.05 (-0.32%)
Market Cap: 139.82M
NASDAQ · time unavailable
CEO: J. Bryan Kitchen
Sector: Basic Materials
Industry: Chemicals
IPO Date: 1980-03-17
Website: https://ascentco.com
Ascent Industries Co. (ACNT) - Company Information
Market Cap: 139.82M|Sector: Basic Materials
Company Profile
Ascent Industries Co. engages in the development, production, and distribution of specialty chemical solutions. It offers surfactants, defoamers, lubricating agents, flame retardants, and specialty intermediates in petroleum-based and bio-based formulations. The company also provides custom manufacturing services, including product development, process optimization, scale-up, and commercial production. It serves the oil and gas; household, industrial and institutional; personal care; coatings, adhesives, sealants and elastomers; pulp and paper; textile; automotive; agricultural; water treatment; construction; and other industries. The company was formerly known as Synalloy Corporation and changed its name to Ascent Industries Co. in August 2022. Ascent Industries Co. was founded in 1945 and is headquartered in Schaumburg, Illinois.
Analyst Sentiment
From 1 Active Polls
1Y Forecast: $18.00
▲ +16.4% Potential Upside
Consensus Target Metrics
Low Bound
$18
Median
$18
High Bound
$18
Average
$18
Price & Moving Averages
🎯 Wall Street Analyst Intelligence Report
1-Year structural target targets, chart projections, and sentiment maps.
Consensus Trend Projection
Trailing closures vs. 12-month metrics map.
Analyst Vote Distribution
Aggregate institutional coverage sentiment weights.
📊 Historical Valuation Multiples
Real-time Trailing Twelve Month (TTM) momentum side-by-side with discrete quarterly metrics.
| Fiscal Quarter | TTM | Q1 2026 | Q4 2025 | Q3 2025 | Q2 2025 | Q1 2025 | Q4 2024 | Q3 2024 | Q2 2024 |
|---|---|---|---|---|---|---|---|---|---|
| Period Ending | Trailing 12M | Mar 31, 2026 | Dec 31, 2025 | Sep 30, 2025 | Jun 30, 2025 | Mar 31, 2025 | Dec 31, 2024 | Sep 30, 2024 | Jun 30, 2024 |
| Market Cap ($M) | 140 | 125 | 152 | 121 | 123 | 128 | 113 | 98 | 94 |
| Enterprise Value ($M) | 105 | 91 | 108 | 84 | 85 | 146 | 130 | 123 | 123 |
| Price to Earnings Ratio (P/E) | 154.70 | -15.85 | -36.80 | -14.64 | 4.93 | -13.76 | -27.95 | -3.98 | -25.30 |
| Price/Earnings-to-Growth Ratio (PEG) | — | -4.53 | — | -2.61 | 1.08 | — | — | -0.04 | — |
| Price to Sales Ratio (P/S) | 1.83 | 6.46 | 8.09 | 6.13 | 6.59 | 7.15 | 2.77 | 2.29 | 4.36 |
| Price to Book Ratio (P/B) | 1.78 | 1.54 | 1.75 | 1.39 | 1.37 | 1.40 | 1.21 | 1.04 | 0.93 |
| Price to Free Cash Flow Ratio (P/FCF) | -20.29 | -21.43 | -774.56 | 173.82 | -79.84 | -124.82 | 13.37 | 37.66 | 48.11 |
| Enterprise Value to Sales (EV/Sales) | — | 4.67 | 5.76 | 4.28 | 4.53 | 8.18 | 3.20 | 2.88 | 5.72 |
| Enterprise Value to EBITDA (EV/EBITDA) | -75.79 | -102.17 | 2159.80 | 89.58 | -56.76 | -191.67 | 68.88 | 31.79 | -136.98 |
| Debt to Equity Ratio | 24.94 | 0.16 | 0.16 | 0.25 | 0.25 | 0.36 | 0.36 | 0.36 | 0.32 |
📰 Market News & Coverage
15 Stories AvailableReal-time institutional reporting and market updates for ACNT.
Ascent Industries Sets Second Quarter 2026 Earnings Conference Call for August 4, 2026, at 5:00 p.m. ET
Ascent Industries Co. (Nasdaq: ACNT) (âAscentâ or the âCompanyâ), a specialty chemicals platform focused on the development, production, and distributio

Ascent Industries Sets Second Quarter 2026 Earnings Conference Call for August 4, 2026, at 5:00 p.m. ET
SCHAUMBURG, Ill.--(BUSINESS WIRE)--Ascent Industries Co. (Nasdaq: ACNT) (“Ascent” or the “Company”), a specialty chemicals platform focused on the development, production, and distribution of tailored, performance-driven chemical solutions, will hold a conference call on Tuesday, August 4, 2026, at 5:00 p.m. Eastern time to discuss its financial results for the second quarter ended June 30, 2026. The results will be reported in a press release prior to the conference call. Ascent management wil.
Ascent Industries: Midwest Creates Long-Term Upside
Ascent Industries Co.'s pure-play reset centers on a customer-embedded CaaS model. I suspect their Midwest acquisition may be a sign of future deals in the long term. ACNT's existing unused capacity could support Midwest-related growth without major spending on new plants. Midwest also gave ACNT formulation depth while creating sourcing, insourcing, and cross-selling opportunities across its already existing platform.
Ascent Industries Pitches Pure-Play Chemicals Shift, Buybacks and Growth Runway
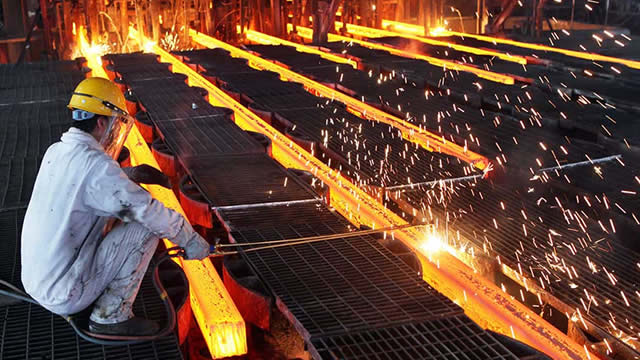
Ascent Industries NASDAQ: ACNT President and CEO Bryan Kitchen said the company has completed a major portfolio shift and is now focused entirely on specialty chemicals after divesting its stainless steel-related assets.
Ascent Industries Co. (ACNT) Q1 2026 Earnings Call Transcript
Ascent Industries Co. (ACNT) Q1 2026 Earnings Call Transcript
Ascent Industries Co. Completes Acquisition of Midwest Graphic Sales
SCHAUMBURG, Ill.--(BUSINESS WIRE)--Ascent Industries Co. Completes Acquisition of Midwest Graphic Sales.

Ascent Industries Co. Announces First Quarter 2026 Results
SCHAUMBURG, Ill.--(BUSINESS WIRE)--Ascent Industries Co. (Nasdaq: ACNT) (“Ascent” or the “Company”), a specialty chemicals platform delivering differentiated, performance-driven chemical solutions, is reporting its results for the first quarter ended March 31, 2026. First Quarter 2026 Summary1 (in millions, except per share and margin) Q1 2026 Q1 2025 Change Net Sales $19.4 $17.8 9.0% Gross Profit $2.8 $3.1 (8.3)% Gross Profit Margin 14.5% 17.2% -272bps Net Loss $(2.0) $(2.2) (9.0)% Diluted Los.

Ascent Industries Sets First Quarter 2026 Earnings Conference Call for May 6, 2026, at 5:00 p.m. ET
SCHAUMBURG, Ill.--(BUSINESS WIRE)--Ascent Industries Co. (Nasdaq: ACNT) (“Ascent” or the “Company”), a specialty chemicals platform focused on the development, production, and distribution of tailored, performance-driven chemical solutions, will hold a conference call on Wednesday, May 6, 2026, at 5:00 p.m. Eastern time to discuss its financial results for the first quarter ended March 31, 2026. The results will be reported in a press release prior to the conference call. Ascent management will.
Ascent Industries Co. (NASDAQ:ACNT) Sees Large Increase in Short Interest
Ascent Industries Co. (NASDAQ: ACNT - Get Free Report) saw a large growth in short interest during the month of March. As of March 31st, there was short interest totaling 338,424 shares, a growth of 19.5% from the March 15th total of 283,226 shares. Approximately 4.0% of the company's stock are short sold. Based on an

Ascent Industries Appoints Two Proven Specialty Chemicals Leaders to Board of Directors
SCHAUMBURG, Ill.--(BUSINESS WIRE)--Ascent Industries Co. (“Ascent” or the “Company”), a specialty chemicals platform delivering differentiated, performance-driven chemical solutions, today announced the appointment of Carmen J. Giannantonio and Jeremy F. Rohen to its Board of Directors, effective April 1, 2026. These appointments reflect Ascent's continued transformation into a pure-play specialty chemicals company and its commitment to aligning Board composition with the Company's strategy. Ca.

Ascent Industries: Back In Buy Territory After Its Strategic Reset
ACNT is now a pure-play specialty chemicals company. They've replaced their mixed tubing-and-chemicals operations with a leaner industrial specialty chemicals focus. 2025 was mixed as revenues declined, but gross profit, gross margin, and adjusted EBITDA improved materially. In my view, this suggests that ACNT's leaner business model is strengthening despite the expected initial transition friction.
Ascent Industries: Earnings Results Raised Margin Concerns
Ascent Industries experienced a massive sell-off after the release of its Q4 earnings result. The stock fell by roughly 14% in a single day. Even though the sell-off doesn't entirely invalidate my initial thesis, it brought to my attention certain headwinds I overlooked in my first write-up. Given that the gross margin contraction was a result of cyclical, not secular, events, I'm not too concerned. With this liquid balance sheet, I expect Ascent to weather these storms.
Ascent Industries Co. (ACNT) Q4 2025 Earnings Call Transcript
Ascent Industries Co. (ACNT) Q4 2025 Earnings Call Transcript
Ascent Industries Co. Announces Fourth Quarter and Full Year 2025 Results
SCHAUMBURG, Ill.--(BUSINESS WIRE)--Ascent Industries Co. Announces Fourth Quarter and Full Year 2025 Results.
Ascent Industries Sets Fourth Quarter 2025 Earnings Conference Call for March 3, 2026, at 5:00 p.m. ET
SCHAUMBURG, Ill.--(BUSINESS WIRE)--Ascent Industries Co. (Nasdaq: ACNT) (“Ascent” or the “Company”), a specialty chemicals platform focused on the development, production, and distribution of tailored, performance-driven chemical solutions, will hold a conference call on Tuesday, March 3, 2026, at 5:00 p.m. Eastern time to discuss its financial results for the fourth quarter and full year ended December 31, 2025. The results will be reported in a press release prior to the conference call. Asce.
Related Companies in Basic Materials

SMITH MIDLAND CORP (SMID)
Basic Materials
$0.14B
Mkt Cap

CONTANGO ORE INC (CTGO)
Basic Materials
$0.19B
Mkt Cap

CORE MOLDING TECHNOLOGIES INC (CMT)
Basic Materials
$0.21B
Mkt Cap

AMER VANGUARD CORP (AVD)
Basic Materials
$0.07B
Mkt Cap

US GOLD CORP (USAU)
Basic Materials
$0.21B
Mkt Cap
FUTUREFUEL CORP (FF)
Basic Materials
$0.22B
Mkt Cap
📊 AI Financial Analysis
Powered by StockMarketInfo"ACNT reported Q1 2026 revenue of $19.42M, up +3.53% QoQ (from $18.76M in Q4 2025) and down -21.52% YoY (from $24.73M in Q1 2025). Net income was -$2.0M (EPS -$0.21), improving sharply QoQ (from -$7.49M in Q4 2025) and improving YoY versus -$2.29M in Q1 2025. Profitability remains volatile. Gross margin contracted sequentially to 14.5% (from 17.9%), and operating margin stayed deeply negative at -12.2% versus -13.7% in Q4 2025; YoY it is roughly similar to Q1 2025 (operating margin -4.2%). Cash flow deteriorated: operating cash flow was -$5.43M and free cash flow -$5.85M, versus positive operating cash flow in Q4 2025 (+$0.27M). Balance sheet resilience is solid with $47.8M cash, net cash position improving to net debt of -$34.7M (i.e., excess cash), and equity down modestly QoQ to $81.6M. Shareholder returns were positive on the tape: price is $14.27 with +11.83% 1Y change (below the >20% momentum threshold) and no dividends reported; buybacks occurred (common stock repurchased -$3.93M)."
Revenue Growth
Revenue rose +3.53% QoQ to $19.42M but fell -21.52% YoY versus $24.73M, indicating a weakening annual trend despite short-term stabilization.
Profitability
Net income improved to -$2.0M (QoQ from -$7.49M) and slightly improved YoY (vs -$2.29M). However, margins remain negative and unstable: gross margin contracted QoQ (17.9% to 14.5%) and operating margin stayed -12.2%.
Cash Flow Quality
Cash generation weakened materially: operating cash flow -$5.43M and free cash flow -$5.85M in Q1 2026 versus operating cash flow +$0.27M in Q4 2025. Repurchases continued (-$3.93M), pressuring liquidity.
Leverage & Balance Sheet
Liquidity is strong with $47.8M cash and net debt improving to -$34.7M (net cash). Total assets declined QoQ ($111.9M to $102.6M) but equity remains substantial at $81.6M.
Shareholder Returns
Total return signals are mixed: price gain is +11.83% over 1Y (not exceeding the 20% momentum boost). No dividend yield; buybacks were active (-$3.93M in Q1 2026).
Analyst Sentiment & Valuation
Street target consensus of $18 vs current price $14.27 implies upside (~26%). Valuation remains loss-making (negative EPS), so targets likely rely on expectations of improvement.
Disclaimer:This analysis is AI-generated for informational purposes only. Accuracy is not guaranteed and this does not constitute financial advice.
Fundamentals Overview
Q1 2026 for ACNT showed execution-led revenue conversion while profitability lagged due to controllable timing and absorption effects. Net sales were $19.4M (+8.9% YoY; +3.5% sequential), driven by volume (+7.6% pounds shipped) and price (+5.2%). However, gross margin fell ~270 bps YoY to 14.5% (gross profit $2.8M), despite stable material economics—standard material costs were essentially flat versus prior periods and management said material margins improved. The company attributed compression to nonmaterial COGS and near-term operational factors: utility cost overruns (150–175 bps headwind), deferred manufacturing variance (~290 bps of Q1 sales), and absorption/routing/labor recovery issues from ramping committed programs. Management reiterated a clear improvement path: >$3M to $5M incremental run-rate gross profit with most benefit expected by Q4 2026, and a return to low-20s gross margins over 2026 (goal ~30%). Capital allocation remained disciplined: ~$3.9M buyback, no revolver debt, and substantial cash remaining. Post-quarter, the Midwest Graphics Sales/Sigma Coatings acquisitions expand formulation-driven product reach with a projected accretion framework grounded in existing earnings.
 Growth Catalysts
- Converted 31 committed projects across 27 customers into Q1 revenue (conversion rate 22%; ~3.5-month average sales cycle).
- Net sales $19.4M (+8.9% YoY; +3.5% sequential) driven by pounds shipped +7.6% and average selling prices +5.2%.
- Pipeline expansion: Q1 pipeline increased +34% vs end of 2025.
- Strongest monthly sales performance since March 2023 (momentum peaked in March).
Business Development
- Acquisitions announced post-quarter end: Midwest Graphics Sales and Sigma Coatings (specialty formulator; packaging, food service, and other consumer applications).
- Cross-selling opportunity: access to more than 60 active customers via acquired formulation-driven coatings platform.
Financial Highlights
- Revenue: Net sales $19.4M (+8.9% YoY); EPS/loss metrics: net loss from continuing operations $2.0M; adjusted EBITDA loss ~ $1.0M.
- Gross margin: down ~270 bps YoY to 14.5% (from 17.2%); gross profit $2.8M vs $3.1M prior year.
- Material margin performance: material costs stable—standard material cost ~$0.61/lb in Q1 vs ~$0.71/lb in Q4 and ~$0.66/lb FY2025; management indicated no raw material economics issue.
- Material margin vs benchmark: management cited material margins improved ~200 bps vs 2025 average and ~300 bps sequentially.
- Primary gross margin headwinds (timing/absorption): utilities cost headwind ~150–175 bps; deferred manufacturing variance ~290 bps of Q1 sales (~$600k) plus sequential swing ~$900k–$1.0M.
- SG&A: $5.0M (+$0.3M YoY) but % of sales improved to 26.4% vs 27.3% prior year; driver mix included salaries/wages/benefits, rent, stock comp; partially offset by lower incentive bonus.
- Cash & debt: ended quarter with $47.8M cash; no revolver debt outstanding.
Capital Funding
- Buyback: repurchased ~296,000 shares for ~$3.9M at avg $12.92/share (about 16% discount vs May 5 close $14.94).
- Cash decline: cash down ~$9.8M from $57.6M year-end to $47.8M; remaining revolver availability ~$14.2M.
- H1/through-period buyback history since Jan 1, 2025: repurchased ~1.18M shares for ~$14.9M at ~ $12.61 avg (~11%–12% of beginning 2025 share base gross).
- Working capital: net working capital consumed ~$3.2M cash in quarter; inventory was a source of cash (+~$1.3M).
- Capex: ~$0.4M capital expenditures during the quarter.
Strategy & Ops
- Margin compression attributed to operational sequencing/absorption and near-term routing/labor/overhead recovery variability, not structural model failure.
- Multi-asset platform playbook: initial speed/onboarding via subscale capacity where needed, followed by optimization across sourcing, routing, campaign planning, inventory positioning, production loading and absorption.
- Management expects margin improvement to begin flowing through during 2026 as realignment of sourcing and network production matching is executed.
- Digital-first market strategy (rolled out Dec): Q1 follow-through included ‘enormous’ website traffic and higher-quality inquiries; net-new customers requesting samples and requests for surfactant supplier alternatives.
Market Outlook
- Incremental run-rate gross profit improvement: management guided to more than $3M to $5M incremental run rate gross profit, majority expected realized by Q4 2026.
- Gross margin normalization outlook: Q2–Q3 expected back into low 20% gross margins; full-year 2026 expected in low 20s (goal of ~30% gross margin business reiterated).
- No near-term revenue/profitability targets: management stated no revenue targets/profitability targets inside of 2026 due to ‘lumpiness’ and phasing.
Risks & Headwinds
- Near-term gross margin noise from controllable conversion costs and absorption timing (utilities +150–175 bps; deferred manufacturing variance ~290 bps of Q1 sales; inventory cost flow dynamics).
- Management emphasized quarter earnings lag commercial progress; adjusted EBITDA loss persists in Q1 despite revenue growth.
- Potential external macro/market flatness: management characterized market as ‘flat uneven’ but asserted growth is execution-led and less market-dependent.
- No tariff refund expectations: management indicated ‘nothing material’ because vast majority of raw materials are sourced domestically.
Q&A: Analyst Interest
- Midwest acquisition details: Management provided 2025 unaudited revenue of ~$10.8M and adjusted EBITDA just north of $2M (19%–20% margins), confirming expected accretion and timing—revenue impact starting in Q2. They also discussed margin normalization post-close, expecting Q2–Q3 normalization and low-20s full-year gross margins.
- Escrow release timing and forward targets: Asked about escrow/divestiture releases after paying ~$13M for Midwest and cash remaining. Management said releases occur in July (about $5M) and a separate October tranche. On guidance, they declined revenue/profit targets for 2026 due to lumpiness from ongoing platform-building and phase timing.
- Tariffs, integration approach, and digital strategy follow-through: Analysts asked about tariff refunds and acquisition customer/capacity utilization. Management said no material tariff refunds (inputs domestic) and planned transition of Midwest manufacturing into Ascent facilities with headspace across underutilized centers. They also cited large website traffic and high-quality leads, including net-new customers requesting samples.
Sentiment: MIXED
Note: This summary was synthesized by AI from the ACNT Q1 2026 earnings transcript. Financial data is complex; please verify all metrics against official SEC filings before making investment decisions.
📋 Official Regulatory 10-K / 10-Q SEC Filings
Direct authenticated documentation links to audited SEC database reports for ACNT.