Agree Realty Corporation

Agree Realty Corporation (ADC) Market Cap

Agree Realty Corporation has a market capitalization of $9.34B.

Price: $77.80

-0.61 (-0.78%)

Market Cap: 9.34B

NYSE · time unavailable

CEO: Joel N. Agree

Sector: Real Estate

Industry: REIT - Retail

IPO Date: 1994-04-15

Website: https://www.agreerealty.com

Agree Realty Corporation (ADC) - Company Information

Market Cap: 9.34B|Sector: Real Estate

Company Profile

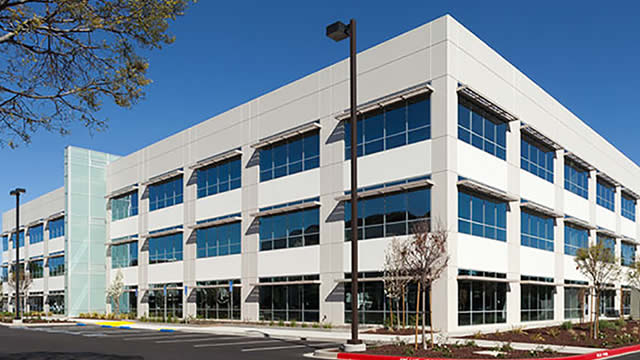
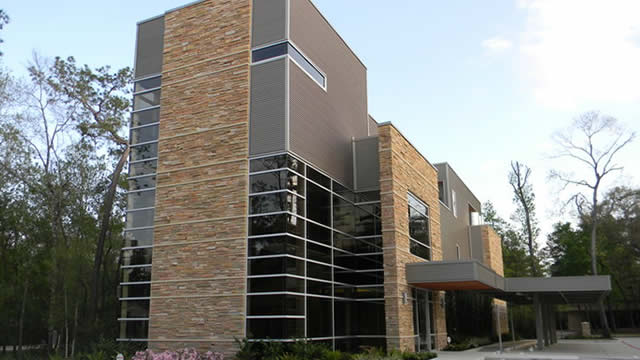
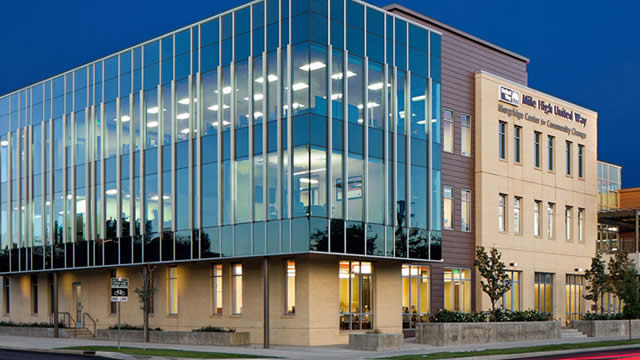
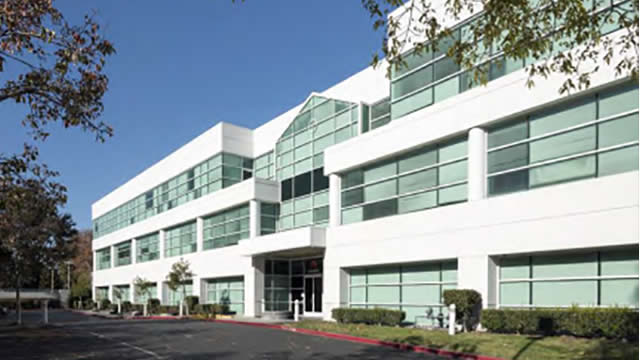
Agree Realty Corporation functions as a publicly traded Real Estate Investment Trust (REIT), concentrating its efforts on the acquisition and development of commercial properties. These assets are primarily net-leased to leading companies within the retail sector. As of September 30, 2020, the firm oversaw a substantial portfolio of 1,027 properties, which were distributed across 45 U.S. states and encompassed a total gross leasable area of approximately 21.0 million square feet. Shares of Agree Realty's common stock are available for trade on the New York Stock Exchange, identified by the ticker symbol ADC.

Analyst Sentiment

71%
Buy

From 20 Active Polls

1Y Forecast: $84.06

▲ +8.0% Potential Upside

Consensus Target Metrics

Low Bound

$80

Median

$84

High Bound

$91

Average

$84

Price & Moving Averages

Loading chart...

🎯 Wall Street Analyst Intelligence Report

1-Year structural target targets, chart projections, and sentiment maps.

Average 1Y Target
$84.06
▲ +8.05% Upside
Low Target
$80.00
3% Risk
Median Target
$84.00
8% Mid
High Target
$91.00
17% Max
Consensus
Buy
23 / 32 Buys

Consensus Trend Projection

Trailing closures vs. 12-month metrics map.

Analyst Vote Distribution

Aggregate institutional coverage sentiment weights.

📊 Historical Valuation Multiples

Real-time Trailing Twelve Month (TTM) momentum side-by-side with discrete quarterly metrics.

Fiscal QuarterTTMQ2 2026Q1 2026Q4 2025Q3 2025Q2 2025Q1 2025Q4 2024Q3 2024
Period EndingTrailing 12MJun 30, 2026Mar 31, 2026Dec 31, 2025Sep 30, 2025Jun 30, 2025Mar 31, 2025Dec 31, 2024Sep 30, 2024
Market Cap ($M)9,3449,0899,0358,2627,9057,8218,2637,2807,562
Enterprise Value ($M)12,45612,20112,30011,60011,31111,08411,25310,10510,269
Price to Earnings Ratio (P/E)41.8343.0337.6938.3139.4741.5145.9541.9344.84
Price/Earnings-to-Growth Ratio (PEG)20.136.969.669.0011.038.7610.1138.94
Price to Sales Ratio (P/S)11.9944.3144.9943.3743.1544.5648.8545.2949.00
Price to Book Ratio (P/B)1.431.391.451.321.351.381.461.321.43
Price to Free Cash Flow Ratio (P/FCF)17.5016.73-33.8274.2253.9565.3765.2479.6558.80
Enterprise Value to Sales (EV/Sales)59.4961.2560.9061.7363.1566.5262.8766.54
Enterprise Value to EBITDA (EV/EBITDA)19.8374.2188.3269.7771.4874.1378.6771.9476.44
Debt to Equity Ratio4.950.480.530.530.580.580.530.510.51

📘 Full Research Report

ℹ️

AI-Generated Research: This report is for informational purposes only.

📘 AGREE REALTY REIT CORP (ADC) — Investment Overview

🧩 Business Model Overview

AGREE REALTY REIT CORP operates as a net-lease real estate owner focused on single-tenant properties where tenants typically bear most operating expenses (e.g., property taxes, insurance, and maintenance). The value chain is straightforward: acquire income-producing real estate, underwrite tenant credit and lease terms, then monetize via contractual rent payments. ADC’s economics are driven less by active property operations and more by disciplined underwriting, lease structure, and capital allocation (buying assets at attractive spreads versus replacing them over time).

Tenant “stickiness” functions similarly to switching costs: once a tenant operational footprint is established in a specific location—supported by site access, logistics routing, and local real estate buildout—the cost and disruption associated with relocation tend to rise. With net leases, that stickiness also translates into steadier cash flows for the landlord, assuming tenants meet lease obligations.

💰 Revenue Streams & Monetisation Model

ADC’s revenue is predominantly contractual rent under long-duration lease agreements, structured to be recurring and property-linked rather than dependent on leasing activity. Monetisation is primarily driven by:

  • Base rent from leased properties with tenant-specific agreements.
  • Rent escalations embedded in lease terms that can support cash flow growth without relying solely on new acquisitions.
  • Lease-related contractual components (where applicable) that shift operating cost burdens to tenants under net-lease structures.
  • Acquisition-led growth where new property purchases expand the income base, subject to valuation discipline.

Margin drivers are not tied to operating leverage in the traditional sense; instead, they flow from (i) lease quality, (ii) tenant durability, (iii) property-level cost pass-through, and (iv) disciplined entry pricing relative to prevailing capitalization rates.

🧠 Competitive Advantages & Market Positioning

ADC’s core moat is best characterized as tenant credit + lease structure + acquisition underwriting discipline, which collectively create durable cash flow characteristics that are difficult to replicate without specialized sourcing, underwriting rigor, and consistent access to capital.

  • Hard-to-replicate stickiness (tenant-level switching costs): single-tenant, location-specific facilities reduce tenant relocation likelihood, especially when operational needs align with the site.
  • Contractual cash flow durability: net-lease structures shift many recurring property expenses to tenants, stabilizing NOI variability.
  • Underwriting and sourcing edge: consistent ability to identify properties that meet yield and credit criteria at the right risk-adjusted price supports long-term earnings quality.

Competitive benchmarking

  • Realty Income (O): broad net-lease platform with diversified sectors and tenant base. ADC’s positioning tends to skew toward acquiring specific types of single-tenant industrial and retail-oriented assets where lease structure and tenant match drive stability.
  • STAG Industrial (STAG): focused industrial net-lease REIT exposure. Compared with STAG’s industrial tilt, ADC generally emphasizes disciplined entry pricing and tenant-credit underwriting across its target sectors.
  • National Retail Properties (NNN): retail net-lease REIT with a strong retail tenant ecosystem. ADC’s industry mix places emphasis on assets that align with ongoing demand drivers and operational fit for tenants, rather than relying exclusively on a single retail niche.

Across these peers, ADC’s differentiation is the combination of lease durability and acquisition selectivity—creating a pattern of earnings that can be defended even as property values and financing conditions cycle.

🚀 Multi-Year Growth Drivers

Over a 5–10 year horizon, ADC’s growth thesis is driven by the continuing need for professionally financed, single-tenant leased real estate and the durability of contractual rent streams. Key drivers include:

  • Net-lease preference and institutional capital demand: tenants and capital providers favor structures that align responsibilities and reduce operating complexity for the landlord.
  • Rent escalations and lease term amortization: contractual growth mechanisms can compound cash flow without requiring constant capital recycling.
  • Supply-demand support for income-producing sites: many markets experience constrained supply of properly positioned, creditworthy-tenant facilities that fit operational requirements.
  • Acquisition expansion with underwriting discipline: growth through acquisitions can expand the income base, provided entry yields and tenant-credit metrics remain within targeted risk parameters.
  • Tenant durability and sector resilience: focusing on tenants with the operational ability to sustain lease obligations supports long-run occupancy and rent collection quality.

⚠ Risk Factors to Monitor

  • Interest rate and credit-spread sensitivity: net-lease REIT valuations and acquisition economics can be influenced by financing conditions and property cap-rate expansion.
  • Tenant concentration and credit deterioration: a meaningful exposure to specific tenants or business models can increase loss severity if retail/industrial demand weakens.
  • Acquisition and valuation risk: forced pricing discipline can erode returns if acquisitions are pursued without sufficient spread versus the cost of capital.
  • Lease rollover and re-leasing risk: even long leases eventually reach renewal/term-out points, requiring careful underwriting for renewal or replacement tenants.
  • Property-level and regulatory risks: changes in tax regimes, insurance markets, environmental liabilities, and local regulatory constraints can affect net-lease economics.

📊 Valuation & Market View

The market typically values net-lease REITs using a framework centered on cash flow durability rather than operating growth rates. Common valuation anchors include:

  • Cash-flow yield metrics (e.g., AFFO/FFO yield) and dividend sustainability.
  • Property capitalization rates (cap rates) implied by acquisition spreads and disposition activity.
  • Lease-level quality (tenant credit, remaining lease term, and rent escalations) which influences perceived risk and thus valuation multiples.
  • Cost of capital (equity and debt financing conditions) that affects growth feasibility and total shareholder return.

Key value drivers that move the needle are the market’s view of (i) tenant credit endurance, (ii) the sustainability of cash flows under lease obligations, and (iii) the ability to grow at spreads that protect future returns.

🔍 Investment Takeaway

ADC’s long-term investment case rests on a net-lease model that converts tenant-specific “relocation friction” and contractual lease protections into steadier landlord cash flows. The durability of those cash flows is reinforced by tenant-credit underwriting and disciplined acquisition economics. The primary question for investors is not whether rent is recurring, but whether ADC can consistently acquire and manage assets in a way that preserves risk-adjusted returns across changing financing and property-cap-rate environments.


⚠ AI-generated — informational only. Validate using filings before investing.

📰 Market News & Coverage

15 Stories Available

Real-time institutional reporting and market updates for ADC.

seekingalpha.com2026-08-01

Agree Realty Q2: Growing, Growing, Growing

ADC delivered a strong Q2 with record acquisition activity, robust AFFO growth, and raised guidance across key metrics. ADC leverages a sector-leading cost of capital, maintaining a 150 basis point investment spread and a conservative balance sheet with net debt/EBITDA at 3.7x. External growth is fueled by aggressive equity issuance, but current valuation offers less yield than peers and is comparable to risk-free assets.

seekingalpha.com2026-07-31

Agree Realty Corporation (ADC) Q2 2026 Earnings Call Transcript

Agree Realty Corporation (ADC) Q2 2026 Earnings Call Transcript

marketbeat.com2026-07-31

Agree Realty Q2 Earnings Call Highlights

Agree Realty NYSE: ADC reported record second-quarter investment activity and raised its full-year outlook, citing strong acquisition, development and portfolio performance.

zacks.com2026-07-30

Agree Realty (ADC) Surpasses Q2 FFO and Revenue Estimates

Agree Realty (ADC) came out with quarterly funds from operations (FFO) of $1.14 per share, beating the Zacks Consensus Estimate of $1.13 per share. This compares to FFO of $1.06 per share a year ago.

businesswire.com2026-07-30

Agree Realty Corporation Reports Second Quarter 2026 Results

ROYAL OAK, Mich.--(BUSINESS WIRE)--Agree Realty Corporation (NYSE: ADC) (the “Company”) today announced results for the quarter ended June 30, 2026. All per share amounts included herein are on a diluted per common share basis unless otherwise stated. Second Quarter 2026 Financial and Operating Highlights: Invested a Company record of approximately $502 million in 102 retail net lease properties Commenced five development or Developer Funding Platform (“DFP”) projects for total committed capita.

globenewswire.com2026-07-30

Crescent Biopharma Reports Second Quarter 2026 Financial Results and Recent Business Highlights

Enrollment progressing in ASCEND Phase 1/2 global clinical trial evaluating CR-001, a PD-1 x VEGF bispecific antibody, in multiple solid tumor types in first-line and previously treated patients CR-001 + sacituzumab tirumotecan (sac-TMT) Phase 2 trial in NSCLC, first ADC combination study in Kelun-Biotech collaboration, underway in China Phase 1/2 trial of CR-003, an ITGB6-targeted ADC, ongoing in China; Phase 1/2 global trial of CR-002, a PD-L1-targeted ADC, on track to initiate in second half of 2026 Multiple key clinical data readouts across the portfolio anticipated beginning in Q1 2027 Completed $143.7 million public offering extending expected cash runway into the second half of 2028 WALTHAM, Mass., July 30, 2026 (GLOBE NEWSWIRE) -- Crescent Biopharma, Inc. (“Crescent” or the “Company”) (Nasdaq: CBIO), a clinical-stage biotechnology company dedicated to rapidly advancing the next wave of therapies for cancer patients, today announced financial results for the second quarter ended June 30, 2026 and recent business highlights.

zacks.com2026-07-28

These 2 Finance Stocks Could Beat Earnings: Why They Should Be on Your Radar

Why investors should use the Zacks Earnings ESP tool to help find stocks that are poised to top quarterly earnings estimates.

247wallst.com2026-07-27

5 Boomer-Proof Monthly Dividend Stocks That Pay You While You Sleep

For retirees who prefer their paychecks to arrive every 30 days instead of every 90, a small corner of the market delivers just that.

gurufocus.com2026-07-27

Sonesitatug vedotin demonstrated a statistically significant and highly clinically meaningful improvement in overall survival in 2nd and later-line CLDN18.2-positive advanced gastric/GEJ cancers

Positive high-level results from the CLARITY-Gastric01 global Phase III trial showed that sonesitatug vedotin (Sone-Ve) demonstrated a statistically significan

247wallst.com2026-07-26

Forget Realty Income: 4 Other REITs Built for Dividend Investors

Realty Income (NYSE:O | O Price Prediction) gets most of the airtime in retiree circles, but it is not the only quality REIT engineered to write dividend checks year after year.

defenseworld.net2026-07-23

Agree Realty Corporation $ADC Stock Holdings Trimmed by California Public Employees Retirement System

California Public Employees Retirement System lessened its position in shares of Agree Realty Corporation (NYSE: ADC) by 7.9% during the first quarter, according to the company in its most recent 13F filing with the Securities and Exchange Commission. The fund owned 276,624 shares of the real estate investment trust's stock after selling 23,684

globenewswire.com2026-07-22

Akari Therapeutics CEO Explains Why Growing Industry Demand for Next-Generation ADC Payloads Positions the Company at the Center of a Major Oncology Opportunity

Virtual Investor "What This Means" segment highlights strategic Whitehawk collaboration, accelerating industry validation of novel ADC payloads, and Akari's differentiated PH1 platform

gurufocus.com2026-07-21

Innate Pharma Announces Completion of Enrollment in Phase 1 Dose Escalation Study of IPH4502, a Novel Nectin-4 Exatecan Antibody-drug Conjugate (ADC)

Regulatory News: Innate Pharma SA (Euronext Paris: IPH; Nasdaq: IPHA) ("Innate" or the "Company"), today announced the completion of enrollment in the dose e

gurufocus.com2026-07-21

ESMO 2026 | Mabwell to Present Latest Clinical Data on Nectin-4-targeting ADC 9MW2821 for Triple Negative Breast Cancer in Oral Presentation

ESMO 2026 | Mabwell to Present Latest Clinical Data on Nectin-4-targeting ADC 9MW2821 for Triple Negative Breast Cancer in Oral Presentation

seekingalpha.com2026-07-17

If I Retired Today, I'd Buy These 2 Income Machines Before Anything Else

Agree Realty's Preferred Equity Series A offers a 6.1% yield, trading at a steep discount to call price, backed by a top-tier net lease REIT. ADC.PR.A provides monthly, cumulative dividends and strong downside protection, though lacks dividend growth and is sensitive to long-term rate increases. DIVO ETF delivers a 4.8% distribution yield via blue-chip dividend stocks and a conservative covered call strategy, maintaining low volatility and moderate upside cap.

📊 AI Financial Analysis

Powered by StockMarketInfo
Earnings Data: Q Ending 2026-06-30

"ADC reported Q2’26 revenue of $205.1M and net income of $52.8M (EPS $0.44). Revenue rose 2.1% QoQ (from $200.8M in Q1’26) and 16.8% YoY (from $175.5M in Q2’25). Net income increased 14.4% QoQ (from $46.2M in Q1’26) and 7.3% YoY (from $49.2M in Q2’25). Profitability strengthened: gross margin improved from 87.6% in Q1’26 to 92.6% in Q2’26, and net margin expanded to 25.7% from 31.0% QoQ—however, it remains well above the 28.0% net margin seen a year ago (mix/interest and other line items appear to be driving the quarter-to-quarter swing). Cash flow quality was mixed but supported earnings: operating cash flow was $131.0M vs $145.2M QoQ, while free cash flow remained strongly positive at $543.3M despite heavy investing cash flow due to the quarter’s investing line items. Shareholder returns appear to be modest on price momentum: the stock is up 1.9% over the last year (below the 20% momentum threshold). Dividend yield is ~1.0%, and the company paid $93.1M of dividends; buybacks were negligible in Q2. Balance sheet resilience: total assets increased to $10.59B QoQ (~4.0%), equity was broadly stable at ~$6.52B, while total debt rose to $3.12B from $3.29B in Q1’26, improving leverage modestly."

Revenue Growth

Positive

Revenue grew 2.1% QoQ (200.8M to 205.1M) and 16.8% YoY (175.5M to 205.1M), showing a clear YoY acceleration.

Profitability

Neutral

Net income increased 14.4% QoQ and 7.3% YoY. Gross margin improved to 92.6% in Q2 from 88.0% in Q1, but net margin showed a QoQ decline (31.0% to 25.7%), indicating some quarter-specific pressure/offsets.

Cash Flow Quality

Fair

Operating cash flow declined QoQ ($145.2M to $131.0M) but remained positive. Free cash flow was positive ($543.3M), yet the investing cash flow line suggests large non-comparable items; dividend outflows were substantial.

Leverage & Balance Sheet

Positive

Total assets rose to ~$10.59B QoQ; equity remained stable (~$6.52B). Total debt fell QoQ ($3.29B to $3.12B), modestly improving leverage vs Q1.

Shareholder Returns

Fair

Total return looks driven more by earnings/dividends than price momentum: 1Y change is +1.9% (no momentum boost). Dividend yield is ~1.0% and dividends paid were meaningful; buybacks were minimal.

Analyst Sentiment & Valuation

Positive

Using the provided price ($79.46) vs consensus target (~$84.19) implies modest upside (~6%). Valuation multiples appear elevated (high P/E and P/S in the ratios), which tempers the score.

Disclaimer:This analysis is AI-generated for informational purposes only. Accuracy is not guaranteed and this does not constitute financial advice.

Fundamentals Overview

Loading fundamentals overview...

ADC opened 2026 with strong operating momentum and a capital structure built to keep deployment flexible. Q1 Core FFO/AP growth was solid (+8.1% and +7.9% YoY), while the company reiterated full-year AFFO guidance of $4.54–$4.58 (midpoint ~5.4% growth). Balance sheet actions were central: record $1.4B forward equity outstanding, ~$2.3B liquidity, pro forma net debt/recurring EBITDA around 3.2x, and no material maturities until 2028—supported by >$1.6B hedged capital and fixed-rate swaps (~4.1% for contemplated issuance). Leasing and underwriting execution also stood out: recapture >104% on 876k SF, occupancy 99.7%, and only 90 bps annualized base rent maturing (down sharply QoQ/YoY). In Q&A, analysts focused on forward equity settlement timing, DFP scaling toward a ~$250M “in the ground” target, and credit loss trajectory (Q1 14 bps vs 25–50 bps full-year). Management’s posture was confident: no portfolio closures expected and construction pricing risk mitigated via GMPs.

AI IconGrowth Catalysts

  • Invested nearly $425M across 100 properties across 3 external growth platforms; acquisitions at 7.1% weighted average cap rate with 11.3-year weighted average lease term
  • Sale-leaseback executed with Hobby Lobby on corporately owned stores, reinforcing craft-and-hobby tenant quality and long-duration leased real estate
  • Asset recycling: disposed of 7 properties for ~$11M at 6.8% weighted average cap rate, ~300 bps inside acquisition cap rates for similar grocery-anchored assets within <1 year
  • Lease-up and recapture strength: new leases/extensions/options on 876k+ SF with recapture rate >104%; reduced upcoming maturities to 90 bps annualized base rent (down 60 bps QoQ and 260 bps YoY)

Business Development

  • Hobby Lobby (sale-leaseback on corporately owned stores)
  • Home Depot (acquisitions included a Home Depot; lease activity included a Home Depot in Orange, Connecticut)
  • Sherwin-Williams (acquisition portfolio of 11 stores)
  • Walmart (3 Walmarts acquired in Georgia and South Carolina)
  • Aldi (several Aldi acquisitions)
  • Jiffy Lube and Dutch Brothers (disposed via grocery portfolio recycling; also linked to lease-up/portfolio context)
  • General contractors for GMP / build-to-suit and ground-lease projects under DFP (named contractor not provided)

AI IconFinancial Highlights

  • Core FFO per share: $1.13 (+8.1% YoY); AFFO per share: $1.14 (+7.9% YoY), highest quarterly AFFO growth since Q2 2022
  • Full-year 2026 AFFO per share guidance reiterated at $4.54 to $4.58 (≈5.4% YoY growth at midpoint)
  • Guidance dilution: treasury stock method dilution expected to impact full-year 2026 AFFO per share by $0.02 to $0.04; increased from ~$0.01 in prior guidance due to higher stock price and additional forward equity (forward equity availability also embedded in guidance parameters)
  • Credit/occupancy loss disclosure: 14 bps of both credit and occupancy loss in Q1; full-year guidance still assumes 25 to 50 bps, implying implied acceleration in Q2–Q4
  • Percentage rent: $2.4M in Q1 vs $1.6M in Q1 prior year; ~1/3 from strong same-store sales; remainder from timing shift (historically paid in Q2 moved into Q1)
  • Dividend: monthly common dividends of $0.262/share for Jan–Mar; annualized dividend >$3.14/share (+3.6% YoY); payout ratio 69% of AFFO for Q1
  • Free cash flow: expects >$140M after dividend this year (+10%+ from last year)
  • Portfolio metrics: occupancy 99.7% (up 50 bps YoY); pharmacy exposure reduced to 3.5% of annualized base rent, exiting top-10 sectors (pharmacy once exceeded 40%)

AI IconCapital Funding

  • ATM forward equity: sold 8.7M shares for ~$658M anticipated net proceeds in Q1; raised ~ $660M forward equity total
  • Record forward equity outstanding: $1.4B of outstanding forward equity; anticipated net proceeds ~$1.4B upon settlement; ~18.4M shares of outstanding forward equity at quarter end
  • Liquidity: ~$2.3B total liquidity at quarter end
  • Hedged capital: >$1.6B hedged capital; $250M of forward starting swaps in place
  • Delayed draw term loan: drew $250M on $350M delayed draw term loan; fixed interest rate ~4.02% per swaps; $100M of capacity remains
  • Interest rate posture: forward starting swaps fix base rate for contemplated 10-year unsecured debt issuance at ~4.1%
  • Net leverage: pro forma net debt to recurring EBITDA ~3.2x
  • Maturity risk: no material debt maturities until 2028
  • Fixed charge coverage ratio (including preferred dividend): 4.2x

AI IconStrategy & Ops

  • Development/DFP ramp plan: convinced 2 new development or DFP projects totaling anticipated cost ~$18M; construction ongoing on 9 projects totaling anticipated cost ~$71M; completed 4 projects totaling ~$23M investment
  • Guided ramp: expects DFP development activity to meaningfully ramp in 2Q and 3Q; several projects commenced subsequent to quarter end; more planned to close later in week/next week
  • Construction cost risk management: projects closing have guaranteed maximum price bids and GMP contracts in place; not speculating on land; mobilize/commence right after close
  • Capital recycling: quick TRS-based closing and redeployment of disposed assets to accretive/better credit real estate (no explicit cap rate bifurcation disclosed beyond the 300 bps inside sale context)

AI IconMarket Outlook

  • 2026 AFFO per share guidance reiterated: $4.54 to $4.58 (midpoint implies ~5.4% YoY growth)
  • Treasury stock method dilution parameter for 2026 reaffirmed/updated at $0.02 to $0.04 based on current stock levels; sensitivity if stock price moves materially
  • Credit and occupancy loss assumption remains 25 to 50 bps for full-year 2026, despite 14 bps realized in Q1
  • DFP intermediate target reiterated: ~$250M per year commencements in the ground; Q2 and Q3 expected to be significantly larger than Q1 due to weather constraints

AI IconRisks & Headwinds

  • Macro volatility acknowledged: investment pace into Q2 is constrained by macro environment and the company's unilateral transaction selection (no change to tenant demand observed)
  • Potential construction pricing risk mitigated via GMP and pre-close contracting; management stated no material cost creep yet
  • Credit/occupancy: Q1 already ran 14 bps; full-year guidance still 25 to 50 bps implying potential acceleration risk in Q2–Q4
  • Interest rate/financing volatility: mitigated by >$1.6B hedged capital, forward swaps, and strong liquidity; still subject to capital markets conditions for equity settlement and potential issuance timing
  • Sector-specific consumer trade-down: management indicated discretionary pullback broadly affects discretionary categories (no portfolio closures anticipated)

Q&A: Analyst Interest

  • Forward equity / settlement timing: Management explained settlement expectations for ~8M forward equity shares potentially maturing in 2026; noted ability to extend contracts, but expects settlement at or prior to maturity given anticipated uses. They also cited $100M remaining delayed draw capacity as first term-out option and emphasized $2.3B liquidity.
  • DFP scale, commencements target, and timing: Management reiterated an intermediate ~$250M per year “in the ground” commencements target and said Q1 is light due to weather constraints; expects Q2 larger and Q3 similar. They emphasized entitlements/municipal approvals as variables, but stated they are on track to hit the intermediate goal this year.
  • Credit/occupancy loss path and portfolio closure risk: Management stated there are no anticipated closures—credit loss guidance is prudently kept at 25–50 bps for 2026 even though Q1 already showed 14 bps. They confirmed monitoring 1–2 assets but characterized portfolio performance as strong.

Sentiment: POSITIVE

Note: This summary was synthesized by AI from the ADC Q1 2026 earnings transcript. Financial data is complex; please verify all metrics against official SEC filings before making investment decisions.

📋 Official Regulatory 10-K / 10-Q SEC Filings

Direct authenticated documentation links to audited SEC database reports for ADC.

SEC EDGAR Live Feed
Loading financial data and tables...
📁

SEC Filings (ADC)

© 2026 Stock Market Info — Agree Realty Corporation (ADC) Financial Profile