Aebi Schmidt Holding AG

Aebi Schmidt Holding AG (AEBI) Market Cap

Aebi Schmidt Holding AG has a market capitalization of .

No quote data available.

CEO: Barend Fruithof

Sector: Industrials

Industry: General Transportation

IPO Date: 2025-07-01

Website: https://www.aebi-schmidt.com

Aebi Schmidt Holding AG (AEBI) - Company Information

Market Cap: -|Sector: Industrials

Company Profile

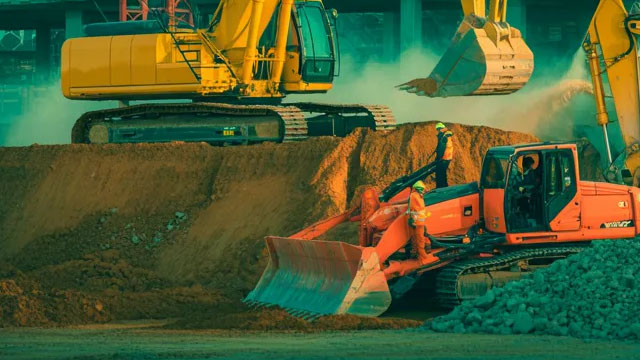
Aebi Schmidt Holding AG engineers and produces specialized machinery and complementary attachments. These products serve a range of applications, including winter maintenance (such as snow removal and de-icing), urban sanitation (like sweeping), airport ground operations, and agricultural tasks. The company recently joined forces with The Shyft Group, thereby establishing a leading global presence in the specialized vehicle industry.

Analyst Sentiment

72%
Strong Buy

From 3 Active Polls

1Y Forecast: $15.75

▲ +0.0% Potential Upside

Consensus Target Metrics

Low Bound

$15

Median

$16

High Bound

$17

Average

$16

Price & Moving Averages

Loading chart...

🎯 Wall Street Analyst Intelligence Report

1-Year structural target targets, chart projections, and sentiment maps.

Average 1Y Target
$15.75
▲ +22.19% Upside
Low Target
$15.00
16% Risk
Median Target
$15.75
22% Mid
High Target
$16.50
28% Max

Consensus Trend Projection

Trailing closures vs. 12-month metrics map.

Analyst Vote Distribution

Aggregate institutional coverage sentiment weights.

Sentiment volume allocation data unavailable.

Historical valuation matrix unavailable.

📘 Full Research Report

ℹ️

AI-Generated Research: This report is for informational purposes only.

📘 AEBI SCHMIDT HOLDING AG (AEBI) — Investment Overview

🧩 Business Model Overview

AEBI SCHMIDT designs, manufactures, and services specialized equipment for municipal and industrial cleaning and winter maintenance. The business model follows a lifecycle approach: it sells capital equipment (street sweepers, compactors, snow/ice control and related attachments) and then earns value through aftermarket parts, service, inspections, and recurring maintenance activities tied to the installed base.

Customer stickiness is reinforced by the operational realities of public works procurement: equipment is deployed under tight service schedules, specifications are standardized across fleets, and downtime carries direct political and operational costs. Once a fleet is in place, ongoing support and spare-parts availability become the practical purchase criteria in subsequent service cycles.

💰 Revenue Streams & Monetisation Model

Revenue typically stems from three monetisation pillars:

  • Equipment sales (transactional): Revenue from new municipal/industrial machines and system configurations.
  • Aftermarket parts (semi-recurring): Consumables and spare parts sales driven by fleet size, utilization, and aging profiles.
  • Service and maintenance (recurring element): Workshop services, inspections, planned maintenance, and service agreements that convert installed-base demand into more predictable cash flows.

Margin structure generally benefits from a higher mix of aftermarket and service relative to pure hardware sales. The aftermarket component tends to be structurally supported by the installed base and the technical specificity of components, which limits pure price competition compared with the initial purchase.

🧠 Competitive Advantages & Market Positioning

AEBI’s moat is primarily grounded in Switching Costs and Service/Aftermarket Capability built around an installed base.

  • Switching Costs (installed base): Municipal fleets standardize equipment types and maintenance procedures. Switching to a different supplier can require changes to parts inventories, mechanic training, and operating procedures, which increases total cost of ownership.
  • Aftermarket defensibility: Spare parts availability and service know-how create a practical barrier to losing share after equipment deployment. Competitors must not only win new orders but also prove sustained service performance over time.
  • Customer operational fit: Equipment used for sanitation and winter operations is evaluated on uptime, maintainability, and fit to local operating requirements (routing, vehicle compatibility, and performance in cold/dirty conditions).

Competitive benchmarking (primary peers)

  • Bucher Municipal: similarly focused on municipal street cleaning and maintenance solutions. AEBI competes by offering alternatives in product coverage and lifecycle support for specific municipality needs.
  • Kärcher: broad platform for cleaning technology. AEBI’s competitive emphasis is typically on municipal-grade fleet integration and service depth rather than consumer/commercial light cleaning breadth.
  • Johnston Sweepers: street-cleaning equipment manufacturer with strong municipal presence. Compared with AEBI, the competitive contest often centers on municipal fleet qualification, total lifecycle cost, and service responsiveness.

Across these rivals, AEBI’s positioning advantage is strongest where municipalities prioritize fleet continuity, proven service support, and operational uptime—conditions that favor established installed-base relationships over short-cycle bidding.

🚀 Multi-Year Growth Drivers

Over a 5–10 year horizon, the addressable market is shaped by durable funding and replacement cycles rather than discretionary demand. Key drivers include:

  • Urban infrastructure and sanitation modernization: Continued urban growth and stricter cleanliness standards increase demand for professional cleaning fleets and associated service.
  • Winter maintenance capacity and fleet replacement: Aging equipment replacement, safety requirements, and operational reliability needs support recurring aftermarket demand and periodic capital refresh cycles.
  • Regulatory and sustainability pressures: Pollution control and efficiency requirements for road maintenance and cleaning can shift specifications toward higher-performing equipment and service regimes.
  • Aftermarket scaling with installed base: Even when new machine orders fluctuate, the installed base generates a long-run demand stream for parts and maintenance.
  • Service network expansion and retention: Deeper service coverage improves retention and increases share of wallet within existing fleets.

⚠ Risk Factors to Monitor

  • Public spending cyclicality: Capital intensity and municipality budget cycles can impact equipment order timing.
  • Competitive bidding pressure: Municipal procurement often involves competitive tenders, which can compress equipment margins while shifting value toward aftermarket/service.
  • Supply-chain and input cost volatility: Metals and components exposure can affect gross margins and delivery schedules.
  • Technology and regulatory change: Environmental and performance regulations may require redesigns or new technologies that elevate development and qualification costs.
  • FX exposure: International sales and sourcing can create currency translation and operating risk.
  • Working capital swings: Equipment manufacturing and customer contract structures can drive inventory and receivables variability.

📊 Valuation & Market View

The market typically values industrial manufacturers with a blend of cyclicality-adjusted earnings expectations and aftermarket/service quality. In practice, valuation often tracks:

  • EV/EBITDA or earnings multiple frameworks for the industrial equipment segment, with discounts reflecting order-cycle volatility.
  • Premium potential when investors believe the business sustains a higher service/aftermarket mix and improving resilience of cash flows.
  • Multiple sensitivity to margin durability, service growth, and fleet retention indicators.

Key valuation drivers are therefore the durability of installed-base monetisation, the mix shift from equipment toward service/parts, and the company’s ability to manage input costs while sustaining service responsiveness.

🔍 Investment Takeaway

AEBI SCHMIDT offers an installed-base driven industrial service model in municipal cleaning and winter maintenance. The core investment thesis rests on switching costs created by fleet standardization, aftermarket/service defensibility, and an operationally anchored customer relationship that tends to support more stable value extraction through parts and maintenance alongside equipment cycles. The primary debate for investors is not market need, but the sustainability of margins and service mix under procurement competition and public spending variability.


⚠ AI-generated — informational only. Validate using filings before investing.

📊 AI Financial Analysis

Powered by StockMarketInfo
Earnings Data: Q Ending 2026-03-31

"AEBI reported Q1’26 revenue of $581.3M and net income of $0.9M (EPS $0.0115). On a year-over-year basis (vs Q1’25), revenue rose sharply (581.3M vs 249.2M; +133.7%), but net income declined (0.9M vs 2.1M; -57.3%). QoQ, revenue increased (581.3M vs 528.4M; +10.0%), while net income was essentially flat/slightly higher (0.9M vs 8.8M; down materially sequentially vs Q4’25). Profitability weakened versus the prior quarter: gross margin was broadly stable (~17.4% in Q1’26 vs ~17.3% in Q4’25), but operating margin contracted (4.39% vs 6.49%) and net margin fell sharply (0.15% vs 1.66%), indicating a major deterioration in below-the-line items (interest and other income/expense). Operating cash flow was negative in Q1’26 (-$22.6M), contrasting with positive cash flow in Q4’25 (+$33.5M), while free cash flow also remained negative (-$25.1M). Balance sheet resilience is moderate: total assets grew (to $2.50B) and equity increased to ~$1.01B, but leverage remains high (net debt ~$841M; equity ratio still pressured). Total shareholder returns look weak: the stock trades at $11.85 with a 1-year change of -85.77%, indicating strong negative capital appreciation; dividends are minimal (yield ~0.34%)."

Revenue Growth

Positive

Revenue improved QoQ (+10.0%) and surged YoY (+133.7%) to $581.3M, showing strong top-line acceleration despite profitability volatility.

Profitability

Neutral

Net income declined YoY (-57.3%) and net margin contracted versus Q4’25 (0.15% vs 1.66%). Operating margin fell (4.39% vs 6.49%), signaling weakening earnings power.

Cash Flow Quality

Neutral

Operating cash flow turned negative in Q1’26 (-$22.6M) vs positive in Q4’25 (+$33.5M). Free cash flow also negative (-$25.1M), reducing cash generation quality.

Leverage & Balance Sheet

Caution

Balance sheet expanded with assets up to ~$2.50B and equity stable-to-higher (~$1.01B), but leverage remains high (total debt ~$986M; net debt ~$841M). Interest coverage remains limited (~1.76x).

Shareholder Returns

Neutral

1-year price momentum is severely negative (-85.77%), dominating returns. Dividend yield is low (~0.34%), with no meaningful offset to capital losses.

Analyst Sentiment & Valuation

Neutral

Consensus price target is $16.50 versus current ~$11.85 (implied upside ~39%). However, elevated earnings/FCF volatility and weak near-term cash generation temper confidence.

Disclaimer:This analysis is AI-generated for informational purposes only. Accuracy is not guaranteed and this does not constitute financial advice.

Fundamentals Overview

Loading fundamentals overview...

Aebi Schmidt exited Q4 2025 with strong momentum translating order intake into profitability: Q4 adjusted EBITDA rose 31% to $48.1M and margin expanded by 170 bps to 9.1%. The narrative is dominated by airport and municipal strength plus a walk-in-van recovery, supported by new product traction (Monroe/Royal service body; compact airport products) and operational scaling (Chicago upfit center, new upfit centers Minneapolis/Toronto). Management’s 2026 outlook is balanced: net sales are guided to $1.95B–$2.15B and adjusted EBITDA $175M–$195M, with leverage targeted to ≤2.0x. However, they explicitly underwrite continued softness in truck body/commercial markets, expect more pronounced seasonality (Q1 slow due to walk-in-van revenue landing in Q2 after ramp costs), and flag geopolitical and weather-related variability. Synergy delivery is credible but highly back-end loaded: procurement in Q3 2026 and revenue in 2H 2026, with full realization by summer 2027.

AI IconGrowth Catalysts

  • Order intake +46% in Q4 2025 vs prior year; record high order backlog into 2026
  • Adjusted EBITDA margin expansion in Q4 to 9.1% vs 7.4% prior year ( +170 bps ) driven by airport and municipal strength
  • Walk-in-van market recovery with believed structural/sustained demand; output ramp starting and accelerating in Q2
  • New product traction: first service body jointly developed by Monroe and Royal (presented at NTA); compact airport products gaining traction with first deliveries already made
  • Europe momentum: 234% YoY improvement in profitability in Europe/ROW on airport/municipal/agriculture/spares strength

Business Development

  • Monroe and Royal: jointly developed first service body; presented at NTA; first deliveries stated as already made
  • Isuzu: cooperation where Aebi Schmidt is the exclusive partner to bring the 'Advantic' product into the market
  • Major first-time customer for municipal snow/ice trucks: Chicago upfit center delivering first units to a major DOT starting April (month explicitly stated)
  • Dealer network expansion in Europe to accelerate Ladog rollout and improve win rates (no named dealers provided)

AI IconFinancial Highlights

  • Order intake +46% YoY in Q4 2025; backlog over $1.2B at year-end ( +21% YoY) providing visibility for 2026
  • Net sales Q4 $528M (+6% YoY); full-year sales $1.9B (+2% YoY vs 2024)
  • Adjusted EBITDA Q4 $48.1M (+31% YoY); margin 9.1% vs 7.4% ( +170 bps)
  • Europe/ROW EBITDA margin: over +600 bps improvement in Q4 YoY (exact bps not provided but direction and magnitude stated as >600)
  • Full-year pro forma: adjusted EBITDA $156M (+13% YoY) with 8.2% adjusted EBITDA margin; net sales +2% translated into higher EBITDA growth
  • Net working capital decreased by $29M (-6%) since September to $423M at December 2025, driven by $38M lower inventory
  • Net debt decreased to $437M as of Dec 31, 2025 (down $32M vs September); leverage reduced to 2.8x with target below 2.0x by end of 2026
  • 2026 adjusted EBITDA guide: $175M–$195M; midpoint implies ~$185M; synergy realization and ramp/one-offs discussed as impacting phasing

AI IconCapital Funding

  • Leverage reduction: 2.8x at year-end 2025; communicated target <2.0x by year-end 2026
  • No explicit buyback or dividend amounts mentioned; no new debt issuance/cash runway figures provided

AI IconStrategy & Ops

  • Synergy acceleration: expecting >$40M vs initial $25M–$30M target; procurement synergies kick in Q3 2026; revenue synergies predominantly in second half 2026; full realization by summer 2027
  • Vertical integration in Commercial: new service body on commercial side with very good feedback; positioned to support cost structure and profitability
  • Automation/operational footprint actions: consolidated warehouses in Midwest to improve logistics and net working capital (explicit consolidation described)
  • Supply/output ramp: walk-in-van output increase starting; accelerate in Q2; Q1 carries ramp-up expenses without revenue
  • Factory efficiency programs and production relocations in Europe; EU pricing engine optimization for spare parts; capture price increases in new business and aftermarket

AI IconMarket Outlook

  • 2026 net sales guidance: $1.95B–$2.15B
  • 2026 adjusted EBITDA guidance: $175M–$195M (midpoint ~$185M)
  • 2026 year-end leverage: at or below 2.0x
  • Quarterly seasonality expectations explicitly: Q1 starts slow; Q2 order conversion accelerates; Q3 improves as commercial/fleet markets and procurement synergies materialize; Q4 benefits from usual seasonal strength (esp. Europe/ROW)
  • Chicago upfit center improvement in March and accelerating into Q2 for municipal snow/ice revenue conversion

AI IconRisks & Headwinds

  • Continued softness in truck body and commercial markets with only slow recovery in 2026; impacts Q4 net sales and profitability conversion
  • Walk-in-van ramp-up expenses in Q1 2026 (costs flow before revenue begins in Q2); one-off/compliance/ramp expenses referenced as affecting comparability
  • Seasonality to be more pronounced than typical: European ordering cycles and snow-related business; geopolitical environment cited as not helping in recent weeks
  • Truck body market not expected to outperform broader market in 2026; foundation built for acceleration in 2027
  • Winter products mixed performance in Europe due to limited snowfalls across many European countries (stated for 2025 performance but implies variability risk)

Q&A: Analyst Interest

  • Walk-in-van demand composition: Management said customer conversations indicate both renewal and incremental demand, with renewal currently visible but not dominant. They emphasized structural, sustainable demand rather than a temporary 1–2 quarter blip, referencing differing buying behavior among two major market participants.
  • Backlog duration and mix: Management indicated a mixed backlog picture vs prior year. They highlighted stronger backlog in municipal and airport (including Europe) and a major increase in walk-in-van backlog, while acknowledging commercial/truck body challenges and expecting market improvement with early signs.
  • Synergy realization timing and 2026 EBITDA bridge: Management reiterated at least $40M total synergy; mid-teens realized in 2025 mainly cost synergies, with a similar cost-synergy amount expected in 2026. Procurement synergies start Q3 2026 and revenue synergies mostly in 2H 2026; one-off and ramp-up expenses complicate phasing.

Sentiment: MIXED

Note: This summary was synthesized by AI from the AEBI Q4 2025 earnings transcript. Financial data is complex; please verify all metrics against official SEC filings before making investment decisions.

Loading financial data and tables...
© 2026 Stock Market Info — Aebi Schmidt Holding AG (AEBI) Financial Profile