Commercial Metals Company

Commercial Metals Company (CMC) Market Cap

Commercial Metals Company has a market capitalization of $7.60B.

Price: $68.72

0.31 (0.45%)

Market Cap: 7.60B

NYSE · time unavailable

CEO: Peter R. Matt

Sector: Basic Materials

Industry: Steel

IPO Date: 1980-03-17

Website: https://www.cmc.com

Commercial Metals Company (CMC) - Company Information

Market Cap: 7.60B|Sector: Basic Materials

Company Profile

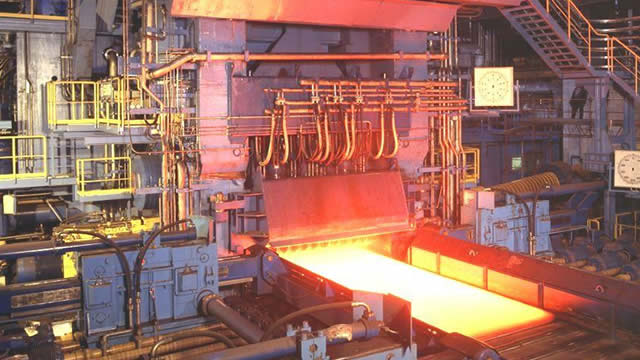
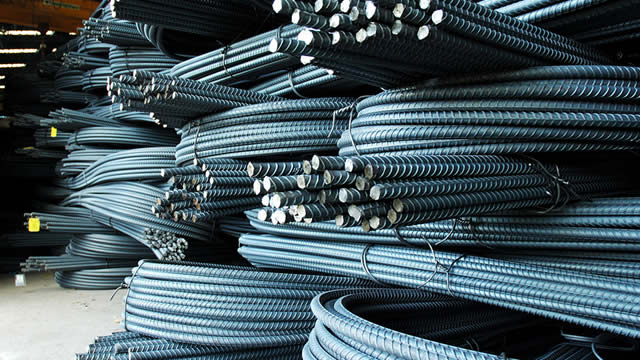
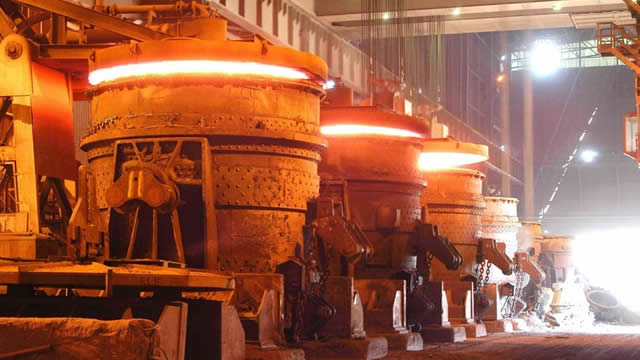
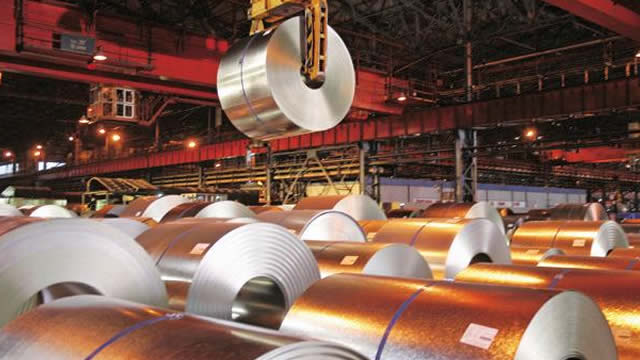
Commercial Metals Company (CMC) is an international enterprise specializing in the production, recycling, and fabrication of steel and metal products, along with providing related services. The company serves markets across the United States, Poland, China, and other international regions. A significant facet of its business involves processing and marketing a wide array of ferrous and non-ferrous scrap metals. These raw materials are supplied to a diverse clientele, including steel mills, foundries, aluminum sheet and ingot producers, brass and bronze ingot makers, copper refineries, secondary lead smelters, specialty steel manufacturers, and high-temperature alloy fabricators. Commercial Metals Company manufactures and distributes a comprehensive range of finished long steel products. These encompass reinforcing bars (rebar), merchant bars, light structural sections, and various other specialized profiles. It also provides semi-finished billets intended for re-rolling and forging applications. Specializing in custom-fabricated steel products, the company's offerings are primarily utilized for concrete reinforcement. Such products are integral to the construction of a wide array of structures, from commercial and residential buildings, healthcare facilities, and convention centers to industrial and power plants, highways, bridges, and expansive public venues like arenas, stadiums, and dams. Beyond its fabrication activities, CMC supplies construction-related equipment and products, both for sale and rent, catering to concrete installers and other commercial enterprises. Additionally, the firm produces niche items such as robust strength bars for the truck trailer industry, specialized bar steels engineered for the energy market, and armor plates designated for military vehicles. These diverse metal solutions, including various rebar forms, merchant bars, wire rods, fabricated meshes, and pre-assembled rebar cages, reach a broad customer base encompassing fabricators, manufacturers, distributors, and construction firms. Founded in 1915, Commercial Metals Company maintains its corporate headquarters in Irving, Texas.

Analyst Sentiment

74%
Strong Buy

From 13 Active Polls

1Y Forecast: $80.67

▲ +17.4% Potential Upside

Consensus Target Metrics

Low Bound

$75

Median

$79

High Bound

$89

Average

$81

Price & Moving Averages

Loading chart...

🎯 Wall Street Analyst Intelligence Report

1-Year structural target targets, chart projections, and sentiment maps.

Average 1Y Target
$80.67
▲ +17.39% Upside
Low Target
$75.00
9% Risk
Median Target
$78.50
14% Mid
High Target
$89.00
30% Max
Consensus
Buy
12 / 26 Buys

Consensus Trend Projection

Trailing closures vs. 12-month metrics map.

Analyst Vote Distribution

Aggregate institutional coverage sentiment weights.

📊 Historical Valuation Multiples

Real-time Trailing Twelve Month (TTM) momentum side-by-side with discrete quarterly metrics.

Fiscal QuarterTTMQ2 2026Q1 2026Q4 2025Q3 2025Q2 2025Q1 2025Q4 2024Q3 2024
Period EndingTrailing 12MMay 31, 2026Feb 28, 2026Nov 30, 2025Aug 31, 2025May 31, 2025Feb 28, 2025Nov 30, 2024Aug 31, 2024
Market Cap ($M)7,6028,4058,1337,1176,4405,2515,5017,0366,147
Enterprise Value ($M)10,44311,24611,0019,4466,7515,7025,9377,3676,479
Price to Earnings Ratio (P/E)12.8412.1422.0810.0110.6015.7455.05-10.0114.72
Price/Earnings-to-Growth Ratio (PEG)0.7439.9736.572.271.04
Price to Sales Ratio (P/S)0.863.383.813.363.052.603.143.683.08
Price to Book Ratio (P/B)1.681.851.851.651.541.281.371.751.43
Price to Free Cash Flow Ratio (P/FCF)18.77109.97186.6690.3831.2280.84-102.2074.1922.74
Enterprise Value to Sales (EV/Sales)4.535.164.453.192.823.383.863.25
Enterprise Value to EBITDA (EV/EBITDA)9.1033.4243.4433.6724.3029.5850.38-49.2629.71
Debt to Equity Ratio2.470.750.760.780.320.330.300.300.28

📘 Full Research Report

ℹ️

AI-Generated Research: This report is for informational purposes only.

📘 COMMERCIAL METALS (CMC) — Investment Overview

🧩 Business Model Overview

Commercial Metals operates in the metals value chain that connects scrap collection and processing to steel production and distribution. The company purchases and processes scrap metal (a low-cost, widely sourced feedstock), converts it into steel through electric arc furnace (EAF) routes, and sells finished steel products into construction, infrastructure, and industrial end-markets. Downstream capabilities—such as product processing, distribution, and customer-specific supply—help convert commodity inputs into more stable customer relationships and better product matching by grade and specification. The business model is therefore “feedstock-to-steel,” with returns largely driven by the spread between input costs (scrap) and the realized selling prices for steel products, plus the ability to run EAF assets at high utilization.

💰 Revenue Streams & Monetisation Model

Revenue is primarily transactional and tied to steel shipments, pricing, and product mix rather than subscription-style recurring contracts. Monetisation is driven by:

  • Scrap-derived steel production economics: Gross margin reflects the conversion spread between scrap purchase costs and steel selling prices, influenced by scrap quality, pricing dynamics, and yield.
  • Product mix and specification value: Higher-value grades, semi-finished forms, and processed offerings can improve realized margins versus basic commodity shapes.
  • Operational leverage: EAF steelmaking is sensitive to utilization, energy intensity, maintenance discipline, and labor/overhead absorption.
  • Distribution and service components: When present, processing and distribution can add margin through logistics execution, faster delivery, and customer-specific packaging/processing.

While steel and scrap markets remain cyclical, CMC’s monetisation model tends to emphasize cost discipline and asset utilization, because the main “pricing power” in steel is limited; the more durable driver is the ability to produce competitively from a consistent feedstock base.

🧠 Competitive Advantages & Market Positioning

CMC’s core moat is rooted in geographic and feedstock cost advantage, supported by logistical infrastructure and operational know-how that strengthens execution across the steelmaking cycle.

  • Low-cost feedstock & scrap conversion capability (Cost Advantage): Scrap is globally traded, but local availability and purchasing relationships materially affect delivered cost and grade mix. CMC’s exposure to scrap procurement and processing supports EAF economics when input spreads remain favorable.
  • Logistical infrastructure (Cost Advantage / Switching costs): Proximity to scrap sources, transportation links, and production footprint reduce unit costs and delivery friction. Customers also face practical switching costs tied to qualification of grades/specifications, supply reliability, and delivery scheduling—benefiting established producers and their downstream partners.
  • Scale in EAF production & asset utilization (Operational differentiation): Competitors without comparable utilization discipline tend to experience greater margin volatility. High-quality operations become a competitive advantage across cycles.

Competitive benchmarking: CMC competes primarily with:

  • Steel Dynamics (SDI) and other EAF-focused mini-mill producers: similar reliance on EAF routes and domestic scrap economics, with differentiation often coming from regional production footprint and utilization strategy.
  • Nucor (NUE): a scale-driven mini-mill platform with strong downstream presence; competition centers on cost position, product availability, and consistent grade delivery.
  • ArcelorMittal / integrated steel producers: larger blast furnace/equipped competitors with different cost structures and exposure to iron ore and coking coal; their economics depend on integrated raw-material inputs and energy/carbon-related constraints.

CMC’s positioning emphasizes the EAF and scrap-linked route relative to integrated producers, where economic performance is more directly influenced by iron ore and coking coal cycles. Against other mini-mill peers, CMC’s differentiation is tied to procurement execution, logistics, and the breadth of its product offering that supports customer-specific supply.

🚀 Multi-Year Growth Drivers

Long-term demand in steel remains tied to construction and infrastructure cycles, but there are structural elements that can support industry equilibrium over a 5–10 year horizon. The key growth drivers for CMC are:

  • Infrastructure renewal and repair: Steady replacement and modernization of bridges, buildings, and industrial facilities supports demand for rebar and construction-related steel products.
  • Recycling and sustainability-driven procurement preferences: EAF steelmaking is often aligned with recycled input use and can benefit when customers and regulators favor lower lifecycle emissions profiles. This does not create guaranteed pricing power, but it can shape procurement decisions and expand access to specific accounts.
  • Regional construction activity and normalized steel intensity: As steel intensity fluctuates by end-market and geography, producers with robust distribution and ability to match product specifications can capture share during favorable regional demand pockets.
  • Capacity additions and debottlenecking opportunities: Incremental expansions, process improvements, and quality enhancements can improve throughput and yield, translating into better cost per ton over time.
  • Operational resilience through cycle navigation: In a commodity business, long-run outperformance typically comes from disciplined capex, prudent working capital management, and utilization-focused execution rather than sustained premium pricing.

⚠ Risk Factors to Monitor

  • Commodity cycle and spread compression: Steel and scrap prices can move against each other, compressing conversion spreads. Weak utilization amplifies earnings volatility.
  • Working capital and inventory risk: Trade flows, pricing lag effects, and changes in customer demand can stress cash conversion.
  • Regulatory and carbon-policy exposure: Carbon pricing, emissions regulation, and permitting constraints can change the comparative advantage of EAF versus integrated routes.
  • Energy and power market impacts: EAF production remains sensitive to electricity pricing and reliability in operating regions.
  • Scrap availability, quality, and competition: Changes in scrap supply geography, contamination rates, and competition for scrap volumes can increase delivered costs and process variability.
  • Capital intensity and execution risk: Capacity projects and upgrades require disciplined execution to avoid margin dilution during ramp-up periods.

📊 Valuation & Market View

Market valuation for steel producers typically reflects cyclicality and balance sheet resilience more than long-term “growth multiple” narratives. Investors often focus on:

  • EV/EBITDA frameworks that capture cycle-adjusted profitability and utilization assumptions.
  • Cash flow durability (especially in down cycles), including working-capital management and capex discipline.
  • Cost position, reflected through cost per ton metrics, EAF operating efficiency, and relative performance versus peers.
  • Balance sheet leverage and liquidity, because commodity downturns can quickly pressure earnings and operating cash flow.

Key valuation drivers moving expectations typically include: normalized conversion spreads, utilization, improvements in unit costs, and credible capital allocation plans that preserve balance sheet flexibility.

🔍 Investment Takeaway

CMC’s long-term investment case rests on a structural cost and execution advantage anchored in EAF steelmaking, scrap-based feedstock economics, and the operational/logistical infrastructure that supports supply reliability and competitive unit costs. While end-markets remain cyclical and pricing power is limited, CMC’s moat is primarily economic—earned through low-cost feedstock access, efficient production, and practical customer switching costs tied to specification qualification and delivery reliability. The most important underwriting focus is the ability to sustain cost leadership and utilization discipline through commodity cycles, while managing working capital and regulatory/energy exposure.


⚠ AI-generated — informational only. Validate using filings before investing.

📰 Market News & Coverage

15 Stories Available

Real-time institutional reporting and market updates for CMC.

zacks.com2026-07-29

Why Commercial Metals (CMC) is a Top Momentum Stock for the Long-Term

Wondering how to pick strong, market-beating stocks for your investment portfolio? Look no further than the Zacks Style Scores.

seekingalpha.com2026-07-29

Cincinnati Financial: The Equity Portfolio Saved Q2, But Commercial Lines Need Attention

Cincinnati Financial Corporation reported strong Q2 net income driven by $1.3B in pre-tax investment gains, primarily from its sizable equity portfolio. Operating EPS declined to $1.43 as catastrophe losses and weaker Commercial Lines underwriting offset rising recurring investment income. Commercial Lines produced a 104.1% Q2 combined ratio and remained unprofitable for H1, with deterioration extending beyond catastrophe losses.

defenseworld.net2026-07-24

California Public Employees Retirement System Grows Stake in Commercial Metals Company $CMC

California Public Employees Retirement System grew its stake in shares of Commercial Metals Company (NYSE: CMC) by 11.5% in the undefined quarter, according to its most recent disclosure with the Securities and Exchange Commission (SEC). The institutional investor owned 277,877 shares of the basic materials company's stock after acquiring an additional 28,693 shares

zacks.com2026-07-21

Here's Why Commercial Metals (CMC) is a Strong Value Stock

Wondering how to pick strong, market-beating stocks for your investment portfolio? Look no further than the Zacks Style Scores.

fool.com2026-07-13

Commercial Metals CEO Peter Matt Buys $500,000 in Shares. What Does This Mean for Investors Now?

8,230 shares were purchased at $61.30 per share for a total value of $504,499 on July 10, 2026. The transaction increased the CEO's direct equity holdings by 5%.

zacks.com2026-07-02

Why Commercial Metals (CMC) is a Top Value Stock for the Long-Term

Whether you're a value, growth, or momentum investor, finding strong stocks becomes easier with the Zacks Style Scores, a top feature of the Zacks Premium research service.

proactiveinvestors.co.uk2026-07-02

Panmure Liberum turns buyer on CMC Markets after guidance surprise

Panmure Liberum has upgraded CMC Markets PLC (LSE:CMCX, FRA:T8Q) to 'buy' from 'hold', arguing that a jump in the trading group's guidance marks a structural shift in its earnings. The broker nearly doubled its price target on the stock, raising it to 700p from 380p.

proactiveinvestors.co.uk2026-07-01

CMC Markets shares jump as the trading platform operator upgraded its guidance

CMC Markets PLC (LSE:CMCX, FRA:T8Q) shares jumped more than 20% on Wednesday, changing hands at 562.5p, after the firm upgraded full-year 2027 income guidance after continued growth in its B2B business lifted expectations for margins and profit. The online trading group said it now expects net operating income for FY2027 to be at least £550 million, materially ahead of its previous guidance range of £460 million to £480 million.

zacks.com2026-06-26

CMC Q3 Earnings Beat on Strong Core EBITDA & Segment Gains

Commercial Metals topped Q3 estimates as core EBITDA jumped nearly 79%, margins expanded and all three business segments posted year-over-year gains.

zacks.com2026-06-26

CMC Q3 Earnings Call Flags Stronger Q4 Setup

Commercial Metals says temporary Q3 headwinds are reversing, with backlog, pricing and precast integration setting up a stronger fiscal fourth quarter.

gurufocus.com2026-06-25

Commercial Metals Co (CMC) Stock Up 3.9% but GF Value Says Overvalued -- GF Score: 82/100

On June 25, 2026, Commercial Metals Co (CMC) shares rose 3.9% today, reaching a current price of $74.09. The stock has traded within a 52-week range of $48.14 t

seekingalpha.com2026-06-25

Commercial Metals Company (CMC) Q3 2026 Earnings Call Transcript

Commercial Metals Company (CMC) Q3 2026 Earnings Call Transcript

zacks.com2026-06-25

Commercial Metals (CMC) Q3 Earnings: Taking a Look at Key Metrics Versus Estimates

While the top- and bottom-line numbers for Commercial Metals (CMC) give a sense of how the business performed in the quarter ended May 2026, it could be worth looking at how some of its key metrics compare to Wall Street estimates and year-ago values.

zacks.com2026-06-25

Commercial Metals (CMC) Q3 Earnings and Revenues Beat Estimates

Commercial Metals (CMC) came out with quarterly earnings of $1.73 per share, beating the Zacks Consensus Estimate of $1.6 per share. This compares to earnings of $0.74 per share a year ago.

prnewswire.com2026-06-25

CMC Reports Third Quarter of Fiscal 2026 Results

Third quarter net earnings of $173.0 million, or $1.55 per diluted share and adjusted earnings of $193.0 million, or $1.73 per diluted share Consolidated core EBITDA increased 78.6% year-over-year to $353.6 million due to strong market conditions, increasing benefits from Transform, Advance, Grow ("TAG") initiatives, and the contribution of the recently acquired precast businesses Consolidated core EBITDA margin of 14.2% increased by 440 basis points compared to the prior year period  Reduced net leverage; clear visibility to

📊 AI Financial Analysis

Powered by StockMarketInfo
Earnings Data: Q Ending 2026-05-31

"Headline (2026-05-31 / Q3): Revenue $2.48B; Net Income $173.0M; EPS $1.57. YoY (vs 2025-05-31): Revenue +23.0% and Net Income +108.1%. QoQ (vs 2026-02-28): Revenue +16.5% and Net Income +86.0%. Profitability improved versus both comparisons: net margin rose to 6.97% (from 4.12% YoY and 4.36% QoQ) and operating margin also expanded meaningfully (to -14.7% in Q3 from +7.3% in Q2). Gross margin deteriorated sharply to -32.0% in Q3 (from +18.2% in Q2 and +14.8% YoY), indicating a major temporary cost/gross profitability disruption offset by strong “other income/expense” and pre-tax results. Cash flow in Q3 remained positive: operating cash flow was $232.6M and free cash flow $76.4M, supporting dividends of $22.2M and modest buybacks of $57.2M. Balance sheet resilience is mixed: equity is higher at $4.53B, but leverage remains elevated with total debt $3.40B and net debt $2.84B (above prior quarters). Shareholder returns are strong: the stock is up 58.7% over 1 year (marketPerformance), and dividend yield is very low (~0.26%), so total return is dominated by price appreciation. Analyst consensus price target (~$83, median $84.5) is above the current $66.17, implying upside despite the profitability volatility."

Revenue Growth

Good

Revenue grew +16.5% QoQ (Q2 $2.13B to Q3 $2.48B) and +23.0% YoY (Q3 2025 $2.02B to $2.48B), showing clear acceleration.

Profitability

Caution

Net income improved (+86.0% QoQ, +108.1% YoY) and net margin rose to 6.97%, but gross margin swung to -32.0% from +18.2% in Q2, and operating margin turned negative (-14.7%); margins appear highly volatile.

Cash Flow Quality

Neutral

Operating cash flow was strong at $232.6M with positive free cash flow of $76.4M. Dividends ($22.2M) were covered, and buybacks continued ($57.2M), but FCF conversion remains modest (FCF $76.4M vs NI $173.0M).

Leverage & Balance Sheet

Fair

Equity is stable-to-higher ($4.53B), but leverage is high: total debt $3.40B and net debt $2.84B, both materially higher than prior quarters (especially vs 2025 year-ago), reducing resilience.

Shareholder Returns

Strong

Total return momentum is strong: 1y price change +58.68% (well above 20% threshold). Dividend yield is low (~0.26%), so gains are primarily from capital appreciation; buybacks also contributed (Q3 repurchases $57.2M).

Analyst Sentiment & Valuation

Fair

Consensus target ~$83 vs current $66.17 suggests upside, but near-term fundamentals show unusual margin volatility (gross/operating margin swings), warranting a cautious valuation view.

Disclaimer:This analysis is AI-generated for informational purposes only. Accuracy is not guaranteed and this does not constitute financial advice.

Fundamentals Overview

Loading fundamentals overview...

CMC delivered a strong Q3 with core EBITDA of $354M (+78.6% YoY) and margin expansion of +440 bps to 14.2%, led by metal margin improvement, TAG execution, and initial Precast contribution. Management emphasized that reported results were held back by temporary factors: 7-of-10 mill maintenance outages (~$20M), weather disruptions (including Texas rebar consumption delay and Southeast precast shipment delays), and scrap-driven squeeze from war-linked higher fuel costs. They quantified that these should largely reverse, forecasting a ~$40M–$50M sequential improvement in Q4. Construction Solutions momentum continued: net sales nearly doubled to $395M, adjusted EBITDA rose to $97.4M with a 400 bps margin gain, and Precast accretion contributed 4.4 percentage points. Europe results were supported by a $20.4M CO2 credit, creating timing noise (next credit expected in 1Q). Balance sheet progress remained central with net leverage at 2.1x (adjusted) and liquidity near $1.8B, supporting confidence in deleveraging and FY26 Precast EBITDA guidance.

AI IconGrowth Catalysts

  • TAG (Transform Advanced & Grow) driving metal margin expansion and improved manufacturing/S&GA efficiency
  • Precast acquisitions contributing to Construction Solutions Group margins and EBITDA growth
  • TENSAR INTERAX profitability acceleration tied to strong mega-project demand in energy and data centers
  • Steel shipments strength after Q3 temporary disruptions; Q4 expects normalization of outages/weather
  • Commissioning progress: micro mill hot commissioning at Steel West Virginia later in summer; GeoGrid line coming online in Blackwell; second GalvaBar line startup late calendar 2026

Business Development

  • Precast platform integration using shared precast forms across facilities to improve production efficiency
  • Trade-policy actions: final or preliminary anti-dumping/countervailing duties announced against producers in 4 countries (rebar ~500k tons in calendar 2024)
  • Ongoing strategy discussions with US government regarding supply from South Korea and other countries

AI IconFinancial Highlights

  • Core EBITDA: $354M, up 78.6% YoY; core EBITDA margin 14.2%, up 440 bps YoY
  • Net earnings: $173M ($1.55/diluted); adjusted earnings: $193M ($1.73/diluted), up 142.4% YoY
  • Q3 expense exclusions from adjusted earnings: ~$25.5M pretax total; includes $19.8M non-cash amortization of acquired backlogs and $2.5M integration-related costs
  • Purchase accounting and higher interest expense: gap between core EBITDA and earnings before taxes widening by ~$60M to ~$65M per quarter for next 2 quarters
  • North American Steel Group: adjusted EBITDA up 41% YoY to $254M ($134/ton); metal margins increased $111 vs Q3’25
  • North American Steel Group adjusted EBITDA margin 14.2% up 270 bps YoY
  • Construction Solutions Group: net sales nearly doubled to $395M; adjusted EBITDA up $56.5M (+138%) to $97.4M; margin expanded 400 bps to 24.7%; Precast accretion 4.4 percentage points in-quarter
  • Precast outlook (excluding purchase accounting): FY26 adjusted EBITDA $165M–$175M maintained
  • Europe Steel Group: adjusted EBITDA $34.7M; benefited from $20.4M CO2 credit on a semiannual basis; metal margin +$37/ton YoY from +$34/ton selling price and -$3/ton scrap cost
  • Q4 outlook: sequential core EBITDA increase expected; overall Q4 improvement expected to be ~$40M–$50M QoQ (from analyst clarification of Q3 puts/takes reversal)
  • Effective tax rate: 8.4% Q3; 7.9% YTD; guided FY26 effective tax 7%–9%; expects minimal U.S. federal cash taxes in FY26 and not much in FY27 due to 48C/bonus/accelerated depreciation

AI IconCapital Funding

  • Net leverage (adjusted for acquisitions): 2.1x; confidence to reach <2.0x by mid-2027 or sooner
  • Total liquidity: nearly $1.8B; no near-term refinancing requirements
  • Capital spending outlook: ~$550M in FY26, including $300M–$350M to complete West Virginia micro mill; $25M for new precast business; remainder maintenance/other growth projects
  • No buyback amount or explicit share repurchase figure stated in transcript

AI IconStrategy & Ops

  • Micro mill network modernization: Steel West Virginia micro mill hot commissioning expected later this summer; positions modern, efficient, low-cost capacity
  • Execution under TAG with quantified annualized run-rate target: tracking ahead of targeted $150M annualized benefits for fiscal 26
  • Precast integration progress: safety tool rollout across operations; sharing precast forms between facilities to improve efficiency and meet customer demand
  • Operational/cost pressure drivers in Q3: planned maintenance outages at 7 of 10 mills (~$20M direct cost impact) and elevated planned outage intensity in 2026 (annual planned maintenance activities ~2x normal levels)
  • Metal margin squeeze in Q3 from scrap costs driven by war-related higher fuel costs; expected reestablishment with price increases taking hold
  • Weather impacts in Q3: wet weather delays in multiple markets (including Texas rebar consumption delay; Southeast precast shipment delays); Q4 expects normalization

AI IconMarket Outlook

  • Downstream bookings: grew >9% YoY in Q3
  • Precast backlog value: up low single digits YoY
  • TENSAR forward pipeline indicators: healthy demand
  • Infrastructure spending backdrop: more than 50% of IIJA funding remains to be spent across highway/general infrastructure in core markets
  • Q4 expectations: NA Steel absence of 3Q mill outages provides ~$20M uplift; Construction Solutions sequential adjusted EBITDA growth in mid-teens; Europe modestly higher adjusted EBITDA excluding CO2 credits
  • Investor Day: August 5 (half-day), providing deeper view of evolution and long-term growth outlook

AI IconRisks & Headwinds

  • Planned maintenance outages: 7 of 10 mills in Q3 with ~$20M direct cost impact and reduced customer inventory availability
  • Scrap cost volatility: metal margins squeezed in Q3 by unexpected scrap cost strength driven by war-related higher fuel costs
  • Weather-driven demand disruption: wet weather curtailed construction activity and delayed customer consumption/shipment timing (Texas rebar consumption; Southeast precast shipment delays)
  • Precast regional softness: pockets of softness plus weather produced performance below expectations in Q3
  • CO2 credit timing distortion in Europe: $20.4M received on semiannual basis; management expects next credit in 1Q rather than Q4
  • Import supply dynamics risk: imports elevated year-to-date (notably South Korea); management expects second-half reduction but remains vigilant

Q&A: Analyst Interest

  • North America Q3 bridge: Management quantified outage/wet-weather/commercial discipline effects (~50k tons lost in N. American Steel Group; ~$10M volume cost) and attributed margin compression to scrap costs; confirmed these items are temporary and should reverse in Q4, supporting roughly ~$40M QoQ improvement.
  • Precast guidance confidence into Q4: Management said Q3 project releases were delayed ~2 weeks, compounded by wet weather in Georgia/Southeast; stated Q4 is normalizing and backlog is at record levels. Integration work is progressing with strong team alignment, supporting the maintained FY26 Precast EBITDA range.
  • US rebar supply-demand and trade actions (South Korea): Management reported US apparent consumption up 3.2% YTD and asserted domestic capacity is manageable while imports are expected to decline in H2. They highlighted initiation of discussions with government, filed four cases, and quantified a ~500k ton removal for 5–10 years if duties finalize.

Sentiment: POSITIVE

Note: This summary was synthesized by AI from the CMC Q3 2026 earnings transcript. Financial data is complex; please verify all metrics against official SEC filings before making investment decisions.

📋 Official Regulatory 10-K / 10-Q SEC Filings

Direct authenticated documentation links to audited SEC database reports for CMC.

SEC EDGAR Live Feed
Loading financial data and tables...
📁

SEC Filings (CMC)

© 2026 Stock Market Info — Commercial Metals Company (CMC) Financial Profile