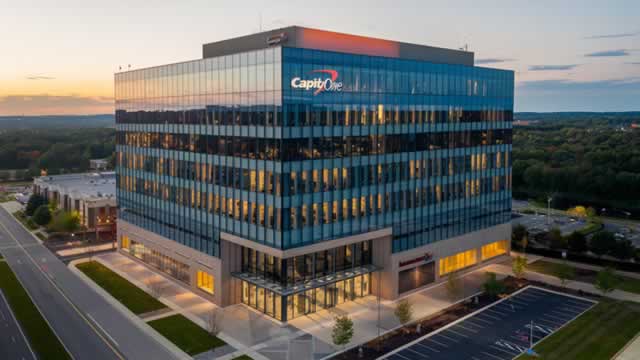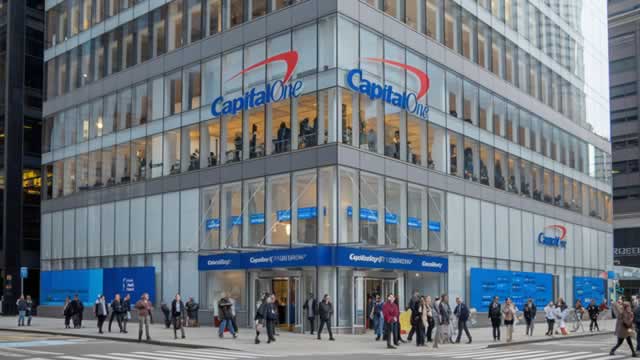
Capital One Financial Corporation

Capital One Financial Corporation (COF) Market Cap

Capital One Financial Corporation has a market capitalization of $128.22B.

Price: $209.01

-1.13 (-0.54%)

Market Cap: 128.22B

NYSE · time unavailable

CEO: Richard D. Fairbank

Sector: Financial Services

Industry: Financial - Credit Services

IPO Date: 1994-11-16

Website: https://www.capitalone.com

Capital One Financial Corporation (COF) - Company Information

Market Cap: 128.22B|Sector: Financial Services

Company Profile

Capital One Financial Corporation, identified by its ticker COF, operates as a prominent financial services holding company. It oversees essential subsidiaries such as Capital One Bank (USA), National Association, and Capital One, National Association, which collectively offer a broad spectrum of financial products and services throughout the United States, Canada, and the United Kingdom. The company structures its extensive operations into three core divisions: Credit Card, Consumer Banking, and Commercial Banking. Clients can utilize various deposit instruments, including checking accounts, money market accounts, negotiable order of withdrawal (NOW) accounts, savings accounts, and time deposits. Capital One's lending solutions are equally comprehensive, encompassing credit card financing, personal auto and retail banking loans, as well as significant commercial and multifamily real estate loans, and broader commercial and industrial credit facilities. Furthermore, the corporation provides credit and debit card issuance, robust online direct banking capabilities, and specialized treasury management and custodial services. Capital One serves a diverse clientele that includes individual consumers, small enterprises, and large commercial entities. It reaches these customers through a multi-channel approach, leveraging digital platforms, traditional physical branches, innovative café locations, and other distribution points, particularly within key states like New York, Louisiana, Texas, Maryland, Virginia, New Jersey, and California. Established in 1988, Capital One Financial Corporation maintains its primary executive offices in McLean, Virginia.

Analyst Sentiment

80%
Strong Buy

From 25 Active Polls

1Y Forecast: $253.60

▲ +21.3% Potential Upside

Consensus Target Metrics

Low Bound

$229

Median

$255

High Bound

$300

Average

$254

Price & Moving Averages

Loading chart...

🎯 Wall Street Analyst Intelligence Report

1-Year structural target targets, chart projections, and sentiment maps.

Average 1Y Target
$253.60
▲ +21.33% Upside
Low Target
$229.00
10% Risk
Median Target
$254.50
22% Mid
High Target
$300.00
44% Max
Consensus
Buy
36 / 57 Buys

Consensus Trend Projection

Trailing closures vs. 12-month metrics map.

Analyst Vote Distribution

Aggregate institutional coverage sentiment weights.

📊 Historical Valuation Multiples

Real-time Trailing Twelve Month (TTM) momentum side-by-side with discrete quarterly metrics.

Fiscal QuarterTTMQ2 2026Q1 2026Q4 2025Q3 2025Q2 2025Q1 2025Q4 2024Q3 2024
Period EndingTrailing 12MJun 30, 2026Mar 31, 2026Dec 31, 2025Sep 30, 2025Jun 30, 2025Mar 31, 2025Dec 31, 2024Sep 30, 2024
Market Cap ($M)128,224124,485113,563152,953135,839107,57168,69068,19057,347
Enterprise Value ($M)168,761165,02287,613146,519132,042101,12861,89070,51157,385
Price to Earnings Ratio (P/E)12.9310.6013.6518.5911.00-6.2012.9616.708.47
Price/Earnings-to-Growth Ratio (PEG)3.770.53-0.28209.442.12
Price to Sales Ratio (P/S)1.636.275.887.806.856.565.124.944.16
Price to Book Ratio (P/B)1.141.091.011.351.190.971.081.120.91
Price to Free Cash Flow Ratio (P/FCF)3.9813.8420.7617.0615.4918.9815.9032.609.33
Enterprise Value to Sales (EV/Sales)8.314.547.476.666.164.625.114.16
Enterprise Value to EBITDA (EV/EBITDA)7.6821.0220.8239.5621.25-20.5624.3631.0218.98
Debt to Equity Ratio1.840.400.450.450.450.470.660.750.78

📘 Full Research Report

ℹ️

AI-Generated Research: This report is for informational purposes only.

📘 CAPITAL ONE FINANCIAL CORP (COF) — Investment Overview

🧩 Business Model Overview

Capital One operates primarily as a consumer credit franchise, sourcing funding through deposits and capital markets while deploying capital into revolving and installment lending (most notably credit cards and auto loans). The company generates earnings by (1) underwriting consumer risk, (2) managing portfolio performance through servicing and collections, and (3) balancing funding costs with earning-asset yields. A meaningful part of the value chain is “behind-the-scenes”: data-led credit decisions, ongoing account management, and cost discipline that convert market demand for consumer credit into attractive risk-adjusted returns.

💰 Revenue Streams & Monetisation Model

Monetisation is a blend of interest income and fee income. The key drivers typically include:

  • Net interest income: interest earned on credit card and loan assets, net of funding costs on deposits and borrowings. Net interest margin and the spread over funding are central margin levers.
  • Interchange and card-related fees: revenue tied to card usage patterns and merchant processing economics. Interchange tends to be sensitive to network and regulatory dynamics.
  • Other revenue: servicing and ancillary products that broaden profitability per customer relationship.

The company’s operating model aims to sustain profitability by keeping credit losses within an expected range and by using expense efficiency to support returns through cycles. As portfolios season and underwriting tightens/loosens across risk segments, the mix between yield, fees, and credit costs becomes the dominant earnings driver.

🧠 Competitive Advantages & Market Positioning

Capital One’s structural moat is most evident in three areas relevant to financials: (1) Cost of Deposits, (2) Credit Culture and underwriting/portfolio management, and (3) Regulatory/Compliance Scale.

  • Cost of Deposits: a large and diversified deposit base can lower blended funding costs relative to peers that rely more heavily on wholesale funding. Lower funding cost supports net interest income even when asset yields normalize.
  • Credit Culture: disciplined underwriting, robust risk models, and active account management can reduce severity in downturns and improve risk-adjusted returns over the cycle. For card portfolios, loss performance and recoveries are crucial.
  • Regulatory Moats: operating at scale with mature compliance, capital planning, and risk governance creates execution barriers. The cost and sophistication required for stress testing, underwriting governance, and consumer protections can be material for challengers.

COMPETITIVE BENCHMARKING

  • JPMorgan Chase and large diversified banks: compete with strong funding access and broad consumer banking relationships. Capital One’s focus is more concentrated in credit products and deposit-funded lending, which can produce sharper execution on underwriting and expense efficiency when risk is managed.
  • American Express: strong in premium card economics and proprietary underwriting, with a historically different merchant and network structure. Capital One competes more directly on mass-market credit availability and cross-sell using a deposit-funded balance sheet.
  • Discover Financial Services and Synchrony: each emphasizes distinct funding and partnerships (including network and co-brand/private label structures). Capital One generally competes through its own card and lending origination engine and a broad suite of consumer credit products, rather than relying primarily on partner-program economics.

Net effect: while peers can compete on marketing, pricing, and product design, Capital One’s advantage is tied less to short-term promotional strength and more to recurring profitability from disciplined risk selection, deposit-based funding economics, and operational execution at scale.

🚀 Multi-Year Growth Drivers

Over a 5–10 year horizon, growth is anchored in credit demand, balance sheet expansion capacity, and improving per-customer economics, supported by risk discipline:

  • Secular shift toward electronic and card-based spending: consumer spending increasingly flows through card rails, supporting long-run account base growth and utilization-related revenue.
  • Share gains in targeted segments: disciplined underwriting and data-driven decisioning can enable measured portfolio growth where competitors may be constrained by risk appetite or operational bandwidth.
  • Cross-sell and product expansion: converting deposit relationships into broader lending and card products supports higher lifetime value while maintaining controllable risk.
  • Operating leverage from scale and technology: automation in servicing, underwriting workflow, fraud controls, and collections can moderate expense growth relative to revenue growth.
  • Capital allocation and balance sheet optimization: returns can improve through portfolio mix optimization, securitization strategy where applicable, and capital management aligned to regulatory requirements.

These drivers matter because the credit cycle can move spreads and losses; the durable element is the ability to expand earnings capacity while keeping credit performance within modeled expectations.

⚠ Risk Factors to Monitor

  • Credit cycle deterioration: worsening unemployment or consumer stress can raise delinquency and charge-off rates, compressing profitability despite stable underwriting.
  • Funding and interest rate risk: deposit pricing dynamics, wholesale funding availability, and changes in the yield curve can affect net interest income and the spread between earning assets and liabilities.
  • Regulatory and policy risk: changes to interchange rules, consumer protection enforcement, capital requirements, or debt collection practices can alter revenue and cost structures.
  • Model and execution risk: underwriting models, fraud detection, and collections strategies depend on stable customer behavior; regime shifts can reduce effectiveness.
  • Operational and cyber risk: digital servicing and data infrastructure create ongoing risks related to system availability, privacy, and fraud.

📊 Valuation & Market View

Equity markets typically value consumer lenders and banks using a framework centered on earnings power and balance-sheet quality rather than pure growth multiple. Key valuation indicators include:

  • Return on equity and economic profitability: sustainable ROE driven by net interest margin, fee generation, and credit cost control.
  • Credit performance vs. pricing: how losses track relative to expectations and how recoveries behave across cycles.
  • Efficiency and operating leverage: the ability to keep expense growth below revenue and to scale technology responsibly.
  • Capital adequacy: market attention to CET1 strength and the ability to fund growth without sacrificing risk-adjusted returns.
  • Funding cost trajectory: deposit beta and the resilience of funding under stress influence earnings durability.

Drivers that typically move the market view include changes in interest rate environment, credit quality trends, regulatory outcomes affecting card economics, and evidence that management can sustain risk-adjusted profitability through downturns.

🔍 Investment Takeaway

Capital One’s long-term investment case rests on repeatable profitability from a deposit-funded consumer credit platform, reinforced by underwriting and portfolio management discipline. The core moat is not promotional intensity but the combination of cost-efficient funding, credit culture, and scale-driven compliance and risk execution barriers that make it difficult for competitors to replicate outcomes consistently through credit and rate cycles.


⚠ AI-generated — informational only. Validate using filings before investing.

📰 Market News & Coverage

15 Stories Available

Real-time institutional reporting and market updates for COF.

seekingalpha.com2026-08-01

Capital One Financial: Boosting The Income With Preferred Stock

Capital One Financial delivered strong Q2 earnings, with $2.94B net profit and EPS of $4.73, despite $3B in credit loss provisions. COF's integration of Discover Financial is on track, targeting $2.5B in annual synergies by late 2027, supporting double-digit EPS growth projections. Credit loss provisions decreased by 25% quarter-over-quarter, while delinquent credit card exposure fell by $1.7B in H1, indicating improving credit quality.

fool.com2026-07-31

Capital One's Purchase Volume Grew 26%, but Legacy Discover Volume Rose Less Than 2%. Only One Number Describes the Franchise It Bought.

Capital One bought Discover to expand its card processing business. Discover brought with it a credit card business that Capital One is currently integrating into its own card operations.

businesswire.com2026-07-29

Capital One Announces Quarterly Dividend

MCLEAN, Va.--(BUSINESS WIRE)--Capital One Financial Corporation (NYSE: COF) today announced a quarterly dividend of $0.80 per common share payable September 1, 2026, to stockholders of record at the close of business on August 17, 2026. The company has announced dividends on its common stock every quarter since it became an independent company on February 28, 1995. Dividends declared by the company are eligible for direct reinvestment in the company's common stock under its Dividend Reinvestmen.

defenseworld.net2026-07-26

Capital One Financial Corporation $COF Position Lessened by Alua Capital Management LP

Alua Capital Management LP cut its stake in shares of Capital One Financial Corporation (NYSE: COF) by 20.6% in the undefined quarter, according to the company in its most recent disclosure with the Securities and Exchange Commission (SEC). The fund owned 537,686 shares of the financial services provider's stock after selling 139,400 shares

fool.com2026-07-25

What the Capital One-Discover Tie-Up Means for the Card Business Now

Capital One acquired Discover, materially increasing its position in transaction processing and expanding its card business. The bank is still integrating the Discover business.

seekingalpha.com2026-07-24

Capital One Financial: Q2 Earnings Confirms The Trajectory

Capital One (COF) is rated Strong Buy with a $260 price target, 26% above current levels, driven by technology-led competitive advantages. COF's cloud-native infrastructure, AI leadership, and ownership of the Discover network position it for payments-grade returns on tangible equity. Despite low-20s% normalized ROTCE post-integration, COF trades at ~9.4x forward earnings and ~1.9x tangible book, a deep discount to peers like Amex.

seekingalpha.com2026-07-24

Coastal Financial Vs. Dave Inc.: Own Banking As A Service (BaaS) Vs.

Coastal Financial Corporation is rated a buy, leveraging a scalable Banking-as-a-Service (BaaS) model with 20+ fintech partners and accelerating fee-based growth. CCB's BaaS segment is driving over 30% net revenue growth, with management signaling continued expansion and disciplined partner onboarding. I assign CCB a $110 price target (19x PE, 0.7x PEG), reflecting its lower-risk, diversified fintech service profile and potential for 30%+ EPS growth.

zacks.com2026-07-24

Here's Why Capital One (COF) is a Strong Value Stock

Whether you're a value, growth, or momentum investor, finding strong stocks becomes easier with the Zacks Style Scores, a top feature of the Zacks Premium research service.

pymnts.com2026-07-23

Capital One Debuts Open-Source Agentic Security Tool VulnHunter

Capital One has announced the open-source release of its in-house agentic AI security tool. The banking giant's VulnHunter is designed “to apply proactive, attacker-perspective analysis directly to the source code,” Capital One said in a news release.

defenseworld.net2026-07-23

Baader Bank Aktiengesellschaft Trims Stake in Capital One Financial Corporation $COF

Baader Bank Aktiengesellschaft cut its stake in Capital One Financial Corporation (NYSE: COF) by 70.6% in the undefined quarter, according to its most recent disclosure with the Securities and Exchange Commission (SEC). The firm owned 1,247 shares of the financial services provider's stock after selling 2,989 shares during the period. Baader Bank Aktiengesellschaft's holdings in Capital

defenseworld.net2026-07-23

ABN Amro Investment Solutions Trims Stock Position in Capital One Financial Corporation $COF

ABN Amro Investment Solutions cut its holdings in Capital One Financial Corporation (NYSE: COF) by 36.1% during the undefined quarter, according to its most recent Form 13F filing with the Securities and Exchange Commission (SEC). The fund owned 49,834 shares of the financial services provider's stock after selling 28,168 shares during the quarter.

pymnts.com2026-07-22

3 Ways Card Issuers Are Looking Beyond Credit Scores

Capital One and Synchrony earnings results this week highlight a consumer credit market that is becoming more segmented: lenders are drawing finer distinctions within credit tiers, millions of new accounts are still being opened and card products are increasingly being matched to both a borrower's credit profile and expected spending behavior.

zacks.com2026-07-22

COF Q2 Earnings Call Tracks Discover Integration Progress

Capital One says Discover integration is on schedule, with synergies captured and card growth expected to revive after platform migrations.

zacks.com2026-07-22

Capital One's Q2 Earnings Beat on Higher Revenues, Lower Provisions

COF's Q2 earnings beat estimates as higher revenues, NII growth and lower provisions offset rising expenses and weaker deposits.

gurufocus.com2026-07-22

Capital One Financial Corp (COF) Q2 2026 Earnings Call Highlights: Strong Earnings and Robust Card Growth Amid Liquidity Challenges

Earnings: $3 billion or $4.73 per diluted common share.Adjusted Earnings Per Share: $5.81.Revenue Growth: Increased 4% quarter-over-quarter.Non-Interest Expens

📊 AI Financial Analysis

Powered by StockMarketInfo
Earnings Data: Q Ending 2026-03-31

"COF (Capital One) delivered Revenue of $19.3B and Net Income of $2.17B in the latest quarter (EPS $3.34). YoY, Revenue rose about +44% (vs. $13.4B) and Net Income increased about +55% (vs. $1.40B). QoQ, Revenue dipped roughly -2.0% (vs. $19.7B) while Net Income edged up about +1.9% (vs. $2.13B). Profitability looks modestly healthier: net margin improved to ~11.3% from ~10.8% QoQ and ~10.5% YoY, indicating margin expansion despite the slight topline softness. On the balance sheet, Total Assets were up to ~$682.9B versus ~$669.0B last quarter, with Equity relatively stable around ~$112.3B (vs. ~$113.6B). However, leverage/liquidity quality worsened: net debt moved from net cash in prior quarters (negative net debt of about -$6.4B in 2025-12-31) to +$44.6B at 2026-03-31. Shareholder returns were strong: the stock is up ~29% over the last year (capital appreciation tailwind >20% threshold). Dividend yield is modest (~0.44% latest), and the dataset does not show meaningful share count reduction (shares increased materially YoY), suggesting buybacks may not have offset dilution in this sample. Valuation appears supportive: consensus target ~$269 implies ~30% upside from the $206.47 price, alongside a reasonable ~13x P/E."

Revenue Growth

Positive

Latest quarter Revenue of $19.3B fell ~-2.0% QoQ but surged ~+44% YoY, showing strong year-over-year momentum.

Profitability

Good

Net Income increased ~+1.9% QoQ and ~+55% YoY; net margin improved to ~11.3% from ~10.8% QoQ, indicating margin expansion. EPS declined QoQ (3.34 vs 4.32) likely influenced by higher share count.

Cash Flow Quality

Neutral

Net Income is positive and grew YoY, supporting earnings quality; dividend payout ratio decreased to ~0.23 (from ~0.56 prior quarter), but dividend yield remains low (~0.44%). No explicit buyback/cash flow detail provided.

Leverage & Balance Sheet

Neutral

Total Assets rose QoQ and Equity is stable (~$112B). Liquidity/leverage deteriorated materially: net debt shifted from net cash (about -$6B to -$4B) to +$44.6B.

Shareholder Returns

Good

Total return tailwind is strong: price up ~29% over 1 year (>20% momentum). Dividend yield is modest; share count increased in this history, implying buybacks are not clearly net accretive in the provided quarters.

Analyst Sentiment & Valuation

Good

Consensus target ~$269 vs. ~$206.47 current implies ~30% upside. Valuation is reasonable with P/E ~13.1 on the latest quarter.

Disclaimer:This analysis is AI-generated for informational purposes only. Accuracy is not guaranteed and this does not constitute financial advice.

Fundamentals Overview

Loading fundamentals overview...

Capital One delivered broadly solid fundamentals in Q2 2026: EPS of $5.81 on an adjusted basis, with a lower provision (-$1.1B, -27% QoQ) driven by a $662M allowance release. Credit metrics improved—domestic card charge-offs and delinquencies fell meaningfully—while coverage ratios declined 26 bps to 5.02%, reflecting domestic card releases offset by builds in consumer banking from auto growth. NIM rose to 8.01% (+14 bps QoQ) but liquidity ended lower (reserves ~$144B, cash ~$55B), creating some earnings volatility and prompting management to flag Q3 catch-up dynamics. The integration narrative is progressing, yet the key overhang remains the Discover 'brownout,' with management placing the bottom around Q4 2026 and delaying full benefit visibility until phased back-book conversions complete in Q1 next year. Brex early tailwinds (lead-sharing, cost-of-funds benefits) are emerging, while marketing/data-pipeline monetization is pushed further out. Overall: positive on execution, cautious on timing.

AI IconGrowth Catalysts

  • Domestic card purchase volume +26% YoY (primarily partial-quarter Discover purchase volume), with legacy Capital One organic growth modestly accelerated and supported by addition of Brex and corporate card
  • Discover integration progress: 14 months into planned 24-month integration; debit customers converted to Discover network (full quarterly run-rate debit revenue synergies included in Q2)
  • Consumer banking momentum: global payments network transaction volume ~$190B (+156% YoY vs prior partial quarter; +9% QoQ) and auto originations +19% YoY
  • Brex early tailwinds from Capital One brand and lead-sharing program (high-potential leads shared from across businesses)

Business Development

  • Brex acquisition (closed early April 2026) integrated into domestic card and domestic card small legacy corporate credit card moved from commercial banking
  • Discover acquisition (closed May 2025): debit customers converted to the Discover network; technology conversion waves planned (July/October/January) with new-originations fully on Capital One tech stack by end of Q3
  • Lead-sharing program between Capital One businesses and Brex using a high-potential lead pipeline
  • Walmart P&L referenced as part of strength in retail deposit growth (attributed to broader synergies/mix)

AI IconFinancial Highlights

  • Reported EPS: $4.73 diluted common share; adjusted EPS: $5.81 after Discover/Brex adjusting items
  • Pre-provision earnings: +1% YoY vs Q1; adjusted pre-provision earnings flat QoQ
  • Provision for credit losses: $3.0B (-$1.1B, -27% QoQ) driven by $3.7B net charge-offs and $662M allowance release
  • Allowance release and coverage: allowance balance $23B; total portfolio coverage ratio -26 bps to 5.02%
  • Domestic card coverage: -41 bps to 6.99% on $705M allowance release; consumer banking coverage: +3 bps to 2.39% on $115M allowance build (driven by auto business growth); commercial banking coverage: -8 bps to 1.62% (driven by specific reserves)
  • Net interest margin (NIM): 8.01% (+14 bps QoQ), increase attributed to 1 additional day (+9 bps) and lower rate paid on retail deposits plus $5B decline in average cash balances
  • Liquidity: liquidity reserves ~$144B (-$21B QoQ); ending cash ~$55B (-$22B), impacted by loan portfolio wholesale funding maturities and Brex impacts
  • Common Equity Tier 1: 13.7% (-70 bps QoQ), driven by $2.7B share repurchases, ~40 bps Brex impact, and higher risk-weighted assets despite net income

AI IconCapital Funding

  • Share repurchases: $2.7B during the quarter
  • CET1 ratio: 13.7% (-70 bps QoQ)
  • Capital target framing from management: long-term capital need defined as 11% (not a near-term race to reduce below it)

AI IconStrategy & Ops

  • Brex growth acceleration framing: mobilizing solutions immediately post-close that do not require full integration; marketing/data-pipeline model calibration for Brex expected later
  • Travel roadmap: hopper build-out through remainder of 2026; Brex travel portal likely follows hopper work
  • Discover 'brownout' mechanics: loan growth pressured in near term due to prior Discover credit policy pullbacks; management trimming Discover credit-policy margins for high-balance revolvers; brownout viewed as temporary
  • Discover tech conversion milestones: 50% of Discover originations on Capital One tech platform now; fully on Capital One tech stack for new originations by end of Q3; back-book major conversion waves later this month, then July/October/January; full back-book tech stack expected first quarter of next year
  • Commercial and credit discipline: domestic card charge-off rate 4.71% (-39 bps QoQ, -54 bps YoY) and delinquency 3.39% (-31 bps QoQ, -21 bps YoY)
  • Operating cost/capital synergy timing: debit revenue synergies included in Q2 run-rate; operating expense synergies ~1/3 realized to date; remaining operating expense synergies targeted by second half 2027

AI IconMarket Outlook

  • NIM: management indicated 'catch-up' in Q3 as average cash catches up to ending cash; back half of year includes +1 day per quarter adding ~9 bps tailwind to NIM
  • Discover growth: management expects continued contraction near term; bottom of brownout in Q4 2026 with returning growth as conversions and tech capabilities roll on
  • Operating expense synergies: on track to achieve remaining operating expense synergies by second half of 2027

AI IconRisks & Headwinds

  • Discover loan growth 'brownout' remains a near-term headwind: continued contraction expected through conversion waves, with brownout bottom around Q4 2026
  • Back-book Discover tech migration delays full benefit manifestation until first quarter of next year (phased waves: July/October/January)
  • Personal loan 'brownout' described as continuing and increasing during integration
  • NIM variability risk from liquidity mix/seasonality: significant changes in balance sheet could impact NIM; Fed repricing timing could cause short-term deposit/asset repricing effects
  • CET1 pressured (-70 bps QoQ) by risk-weighted asset increases and Brex impacts despite net income and buybacks

Q&A: Analyst Interest

  • Brex integration timing: Management clarified that they did not promise immediate growth acceleration 'from day 1.' Instead, they emphasized early mobilization of solutions that can work without full integration, plus lead sharing. Marketing and model calibration require deeper technical integration and are expected later as travel/Hopper work progresses.
  • Discover brownout and growth path: Management explained that Discover loan growth is temporarily pressured due to prior Discover credit-policy pullbacks and margin trimming, especially for high-balance revolvers. They provided milestones: 50% of originations on Capital One tech now; new originations fully on tech by end of Q3; back-book waves later this month, then July/October/January.
  • NIM outlook and expense synergy framing: For NIM, management said ending cash fell more than average cash (Q2 ending ~$55B vs higher prior-quarter cash), implying third-quarter 'catch-up' as averages normalize, plus ~9 bps day-count tailwind in the back half. For efficiency, they repeated OpEx synergies are back-loaded with remaining synergies by second half of 2027, and no explicit efficiency ratio guidance.

Sentiment: MIXED

Note: This summary was synthesized by AI from the COF Q2 2026 earnings transcript. Financial data is complex; please verify all metrics against official SEC filings before making investment decisions.

📋 Official Regulatory 10-K / 10-Q SEC Filings

Direct authenticated documentation links to audited SEC database reports for COF.

SEC EDGAR Live Feed
Loading financial data and tables...
📁

SEC Filings (COF)

© 2026 Stock Market Info — Capital One Financial Corporation (COF) Financial Profile