Cogent Biosciences, Inc.

Cogent Biosciences, Inc. (COGT) Market Cap

Cogent Biosciences, Inc. has a market capitalization of $6.65B.

Price: $38.93

-2.43 (-5.88%)

Market Cap: 6.65B

NASDAQ · time unavailable

CEO: Andrew R. Robbins

Sector: Healthcare

Industry: Biotechnology

IPO Date: 2018-03-29

Website: https://www.cogentbio.com

Cogent Biosciences, Inc. (COGT) - Company Information

Market Cap: 6.65B|Sector: Healthcare

Company Profile

Cogent Biosciences, Inc. is a biotechnology firm dedicated to creating targeted treatments for illnesses rooted in specific genetic anomalies. The company's primary therapeutic candidate is CGT9486, a selective tyrosine kinase inhibitor engineered to block the KIT D816V mutation, a key driver of systemic mastocytosis, along with other KIT exon 17 mutations observed in individuals suffering from advanced gastrointestinal stromal tumors (GIST). Furthermore, Cogent holds a licensing pact with Plexxikon Inc., granting it rights for the investigation, advancement, and marketing of bezuclastinib. Previously known as Unum Therapeutics Inc., the company adopted its current name, Cogent Biosciences, Inc., in October 2020. Established in 2014, Cogent Biosciences is headquartered in Cambridge, Massachusetts.

Analyst Sentiment

81%
Strong Buy

From 13 Active Polls

1Y Forecast: $46.75

▲ +20.1% Potential Upside

Consensus Target Metrics

Low Bound

$35

Median

$49

High Bound

$55

Average

$47

Price & Moving Averages

Loading chart...

🎯 Wall Street Analyst Intelligence Report

1-Year structural target targets, chart projections, and sentiment maps.

Average 1Y Target
$46.75
▲ +20.09% Upside
Low Target
$35.00
-10% Risk
Median Target
$48.50
25% Mid
High Target
$55.00
41% Max
Consensus
Buy
10 / 12 Buys

Consensus Trend Projection

Trailing closures vs. 12-month metrics map.

Analyst Vote Distribution

Aggregate institutional coverage sentiment weights.

📊 Historical Valuation Multiples

Real-time Trailing Twelve Month (TTM) momentum side-by-side with discrete quarterly metrics.

Fiscal QuarterTTMQ1 2026Q4 2025Q3 2025Q2 2025Q1 2025Q4 2024Q3 2024Q2 2024
Period EndingTrailing 12MMar 31, 2026Dec 31, 2025Sep 30, 2025Jun 30, 2025Mar 31, 2025Dec 31, 2024Sep 30, 2024Jun 30, 2024
Market Cap ($M)6,6522,5952,4011,6448226798621,190887
Enterprise Value ($M)6,6492,5922,3421,5797555707811,111817
Price to Earnings Ratio (P/E)-12.64-16.04-7.86-5.06-2.80-2.88-3.20-4.22-3.79
Price/Earnings-to-Growth Ratio (PEG)
Price to Sales Ratio (P/S)
Price to Book Ratio (P/B)4.324.273.775.435.303.103.363.782.38
Price to Free Cash Flow Ratio (P/FCF)-23.24-29.71-30.05-25.54-15.03-10.12-14.21-22.76-20.71
Enterprise Value to Sales (EV/Sales)
Enterprise Value to EBITDA (EV/EBITDA)-18.97-27.29-22.39-20.03-10.48-8.04-11.69-15.97-14.12
Debt to Equity Ratio0.010.390.400.200.390.080.070.060.05

📘 Full Research Report

ℹ️

AI-Generated Research: This report is for informational purposes only.

📘 COGENT BIOSCIENCES INC (COGT) — Investment Overview

🧩 Business Model Overview

Cogent Biosciences is structured like a development-stage biotechnology platform: it allocates capital to discover, develop, and advance product candidates through preclinical and clinical stages, then seeks commercial or partnership pathways after regulatory validation. The value chain is dominated by (1) pipeline creation and target selection, (2) execution of clinical development to generate data packages sufficient for regulatory review, and (3) monetization via commercialization rights and/or licensing and collaboration arrangements with larger pharmaceutical and biotech partners.

Customer “stickiness” is not measured through consumer usage; the practical stickiness comes from (i) the regulatory and scientific bar needed to replace an approved therapy, and (ii) the long-duration relationships and know-how embedded in platform development, manufacturing scale-up, and trial execution capabilities.

💰 Revenue Streams & Monetisation Model

For development-stage biotechs, monetisation typically blends non-dilutive and event-driven cash flows. The model most commonly includes:

  • Collaboration and partnership revenue (including upfront payments, cost sharing, and research support).
  • Milestone payments tied to clinical, regulatory, or commercial milestones.
  • Licensing and commercialization economics after approval, where revenue potential shifts from event-driven to sales-driven economics.
  • Grant and contract revenue where available, supporting specific research activities.

Margin drivers in this sector are less about “gross margin from production” early on and more about minimizing dilution and extending the cash runway while advancing the probability of technical and regulatory success. Durable long-term economics depend on achieving approval and capturing meaningful market access through competitive differentiation, then controlling manufacturing and supply-chain execution.

🧠 Competitive Advantages & Market Positioning

Cogent’s moat profile is primarily Intangible Assets and Patent/Regulatory Barriers rather than switching-cost economics or network effects.

  • Patent protection and IP portfolio: In biotech, exclusivity and intellectual property claims can restrict competitors from copying the underlying assets or key improvements, extending monetisation windows.
  • Regulatory data package and clinical evidence: Clinical datasets that support safety and efficacy submissions create a high evidentiary hurdle for rivals and raise the effective cost of “fast-following.”
  • Execution capability: Consistent trial design, site execution, and manufacturing/process development can become a practical barrier, even when programs are not fully protected by patents.

Competitive benchmarking (examples):

  • Moderna (MRNA) — competes for capital and partnership attention in advanced bio/therapeutic development, with a different modality and commercial scale profile.
  • Regeneron Pharmaceuticals (REGN) — competes in the broader therapeutic innovation ecosystem, where evidence strength and regulatory readiness drive partner and market confidence.
  • Biogen (BIIB) — competes for execution and commercialization outcomes across therapeutic R&D, typically with deeper late-stage infrastructure and broader commercialization muscle.

Cogent’s competitive positioning differs from large-platform incumbents: it competes primarily on the quality of its pipeline and the probability-weighted path to approval, rather than on near-term manufacturing scale or diversified marketed-product cash flows.

🚀 Multi-Year Growth Drivers

Over a 5–10 year horizon, growth depends on typical secular tailwinds in therapeutics plus pipeline-specific execution:

  • Expanding addressable disease categories: Ongoing advances in biology, biomarkers, and target discovery broaden the set of treatable patients.
  • Shift toward more precise therapies: Improved diagnostics and patient stratification support the adoption of differentiated treatments, increasing the probability of meaningful clinical impact.
  • Platform compounding: Successful execution can reinforce platform credibility, improving partner access, trial enrollment efficiency, and future financing terms.
  • Partnership leverage: Collaboration economics can increase capital efficiency by sharing development costs and accelerating regulatory and commercial pathways.

TAM expansion matters, but the investment case is ultimately driven by the pipeline’s ability to translate scientific promise into regulatory-compliant evidence and sustainable differentiation.

⚠ Risk Factors to Monitor

  • Clinical and regulatory risk: Efficacy/safety uncertainty is the central structural risk in biotech; failure can impair or end program value.
  • Financing and dilution risk: Development-stage cash needs can require equity issuance or debt/structured financing, affecting shareholder outcomes.
  • Patent and competitive encroachment: IP strength can erode via patent litigation outcomes, design-around strategies, or weaker-than-expected claim scope.
  • Manufacturing and supply-chain risk: Process scale-up, quality systems, and cost control become decisive for long-term unit economics after approval.
  • Market access and reimbursement dynamics: Even with clinical efficacy, adoption depends on pricing, payer evidence requirements, and competitive positioning within the same treatment lines.

📊 Valuation & Market View

Market valuation for development-stage biotech commonly reflects risk-adjusted expectations rather than straightforward earnings power. Key frameworks include:

  • Pipeline probability-weighted valuation (often more informative than standard multiples when revenue is limited).
  • EV-to-R&D and/or enterprise-to-development milestones as proxies for technical progress.
  • Sales-based multiples post-approval once commercialization evidence reduces uncertainty.

Practical drivers that move valuation in this sector include: probability of technical success, quality of clinical endpoints, timeline credibility, depth of IP protection, partner validation, and cash runway relative to development milestones.

🔍 Investment Takeaway

Cogent Biosciences’ long-term investment case rests on intangible-asset moats—notably patent protection, regulatory data advantage, and execution capability that increases the likelihood of approvals. The multi-year upside is tied to successful progression of its pipeline into regulatory endpoints and monetization pathways via commercialization and/or partnerships, while the key risks remain clinical/regulatory uncertainty and financing-dilution dynamics.


⚠ AI-generated — informational only. Validate using filings before investing.

📰 Market News & Coverage

15 Stories Available

Real-time institutional reporting and market updates for COGT.

globenewswire.com2026-06-30

Cogent Biosciences Announces Submission of New Drug Application (NDA) for Bezuclastinib in Advanced Systemic Mastocytosis (AdvSM)

Submission based on results of APEX pivotal trial which demonstrated bezuclastinib objective response rate (CR+CRh+PR+CI) of 65% per mIWG criteria and 81% ORR per PPR criteria with a well-tolerated safety profile for AdvSM patients

seekingalpha.com2026-06-14

Cogent Biosciences: A Pre-Commercial Biotech With Commercial-Stage Leverage

Cogent Biosciences is positioned to build a niche KIT-mutant franchise, leveraging bezuclastinib across three pivotal indications with strong clinical data. COGT holds $866.4 million in cash, supporting operations through 2028 and enabling launches in systemic mastocytosis and GIST, mitigating near-term financing risk. Bezuclastinib has demonstrated robust efficacy in nonadvanced and advanced systemic mastocytosis and second-line GIST, with three regulatory filings and positive pivotal trial results.

globenewswire.com2026-06-12

Cogent Biosciences Announces Preclinical Data from Novel JAK2 V617F Inhibitor at the 2026 European Hematology Association (EHA) Congress

-  JAK2 V671F poster presentation showcases potential best-in-class properties, including improved selectivity compared with currently approved JAK inhibitors -

globenewswire.com2026-06-12

Cogent Biosciences Announces Detailed Data from APEX Pivotal Trial of Bezuclastinib in Patients with Advanced Systemic Mastocytosis at the 2026 European Hematology Association (EHA) Congress

-- Bezuclastinib demonstrated rapid and deep clinical benefit in AdvSM patients resulting in an updated objective response rate (CR+CRh+PR+CI) of 65% per mIWG criteria and 81% ORR per PPR criteria –

globenewswire.com2026-05-30

Cogent Biosciences Announces Detailed Clinical Data from PEAK Phase 3 Trial with Bezuclastinib in Combination with Sunitinib in Gastrointestinal Stromal Tumors (GIST) at 2026 American Society of Clinical Oncology (ASCO) Annual Meeting

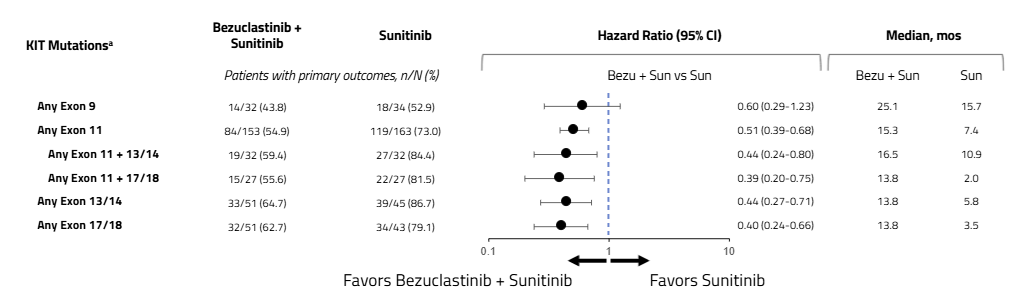
Bezuclastinib combination is first treatment ever to demonstrate statistically significant advantage against active comparator in GIST patients; median PFS of 16. 5 months versus 9. 2 months (HR=0. 50, CI: 0. 39-0.

globenewswire.com2026-05-30

Cogent Biosciences Announces Detailed Clinical Data from PEAK Phase 3 Trial with Bezuclastinib in Combination with Sunitinib in Gastrointestinal Stromal Tumors (GIST) at 2026 American Society of Clinical Oncology (ASCO) Annual Meeting

Bezuclastinib combination is first treatment ever to demonstrate statistically significant advantage against active comparator in GIST patients; median PFS of 16.5 months versus 9.2 months (HR=0.50, CI: 0.39-0.65, p

globenewswire.com2026-05-28

Cogent Biosciences Announces FDA Acceptance of New Drug Application (NDA) with Priority Review for Bezuclastinib in Combination with Sunitinib for Patients with GIST

NDA acceptance with Priority Review builds upon previous assignment of Breakthrough Therapy Designation and Real-Time Oncology Review following Phase 3 PEAK results; PDUFA date set for November 30, 2026

globenewswire.com2026-05-27

Cogent Biosciences Announces Participation in the 2026 Jefferies Global Healthcare Conference

WALTHAM, Mass. and BOULDER, Colo.

globenewswire.com2026-05-12

Cogent Biosciences Announces Multiple Presentations at the European Hematology Association (EHA) 2026 Congress

WALTHAM, Mass. and BOULDER, Colo., May 12, 2026 (GLOBE NEWSWIRE) -- Cogent Biosciences, Inc. (Nasdaq: COGT), a biotechnology company focused on developing precision therapies for genetically defined diseases, today announced two presentations from the company's Advanced Systemic Mastocytosis (AdvSM) program, including an oral presentation highlighting the results of the APEX trial, as well as a poster presentation from its emerging JAK2 V617F program at the European Hematology Association (EHA) Congress being held in Stockholm, Sweden, June 11-14, 2026.

globenewswire.com2026-05-05

Cogent Biosciences Reports Recent Business Highlights and First Quarter 2026 Financial Results

- Planning for dual launches of bezuclastinib in Systemic Mastocytosis and Gastrointestinal Stromal Tumors (GIST) - Pivotal data from Phase 3 PEAK trial in GIST patients selected for oral presentation at 2026 ASCO annual meeting  - Ended 1Q 2026 with $866.4 million in cash, sufficient to fund operations into 2028 WALTHAM, Mass. and BOULDER, Colo.

globenewswire.com2026-04-17

Cogent Biosciences Announces Poster Presentations at the American Association for Cancer Research (AACR) Annual Meeting 2026

– Updated presentation on Cogent's potent pan-KRAS(ON) inhibitor, CGT1263, showcasing its selectivity profile which could lead to reduction in skin toxicity associated with multi-RAS inhibitors

seekingalpha.com2026-04-02

Cogent Biosciences: Blockbuster Potential, Premium Valuation, Still A 'Buy'

Cogent Biosciences, Inc. maintains a Buy rating as bezuclastinib demonstrates blockbuster potential in GIST and systemic mastocytosis (SM) indications. Bezuclastinib nearly doubled median PFS in 2L GIST (PEAK trial), supporting a high peak market share assumption despite competitive pressures. COGT's sum-of-the-parts valuation yields a fair value of $26.54/share, with current cash reserves likely sufficient to reach commercial launch, though dilution risk remains.

defenseworld.net2026-04-02

Head to Head Contrast: Cogent Biosciences (NASDAQ:COGT) versus GT Biopharma (NASDAQ:GTBP)

Cogent Biosciences (NASDAQ: COGT - Get Free Report) and GT Biopharma (NASDAQ: GTBP - Get Free Report) are both medical companies, but which is the superior stock? We will compare the two companies based on the strength of their dividends, earnings, risk, valuation, analyst recommendations, profitability and institutional ownership. Analyst Ratings This is a breakdown of recent

globenewswire.com2026-04-01

Cogent Biosciences Announces Submission of New Drug Application for Bezuclastinib in Gastrointestinal Stromal Tumors (GIST)

WALTHAM, Mass. and BOULDER, Colo., April 01, 2026 (GLOBE NEWSWIRE) -- Cogent Biosciences, Inc. (Nasdaq: COGT), a biotechnology company focused on developing precision therapies for genetically defined diseases, today announced the completion of the submission of its New Drug Application (NDA) to the U.S. Food and Drug Administration (FDA) for bezuclastinib in patients with Gastrointestinal Stromal Tumors (GIST) who have received prior treatment with imatinib. Based on the positive results from the PEAK trial, the bezuclastinib NDA was submitted under the FDA's Real-Time Oncology Review (RTOR) program, which is intended to enable a more streamlined review process. Bezuclastinib was also granted Breakthrough Therapy Designation as a treatment for GIST earlier this year.

📊 AI Financial Analysis

Powered by StockMarketInfo
Earnings Data: Q Ending 2026-03-31

"COGT reported Q1’26 (ended 2026-03-31) net income of -$97.4M and EPS of -$0.53, with revenue reported as $0. On a profitability basis, losses narrowed sequentially: net income was -$97.4M in Q1’26 vs -$102.5M in Q4’25 (QoQ improvement of ~+5.0%), and vs -$71.99M in Q1’25 (YoY deterioration of ~-35.2%). EPS followed the same direction: -$0.53 in Q1’26 vs -$1.13 in Q4’25 (QoQ improvement) and -$0.52 in Q1’25 (flat-to-slightly worse YoY). Over the four-quarter period, the company’s loss profile remained driven by operating expense intensity—R&D was ~$75.4M in Q1’26 (up ~+1.4% QoQ and ~+19.6% YoY). Cash and balance sheet support remained strong for a pre-profit company: total assets were ~$903.0M with stockholders’ equity of ~$607.7M. Liquidity improved QoQ with cash + short-term investments rising to ~$866.4M from ~$900.8M (slight decline), and net debt was modestly negative (net cash position). Operating cash flow was -$86.9M and free cash flow -$87.3M, indicating continued burn. Shareholder returns look highly positive: the stock is up 772.4% over the last year (and ~127.7% over 6 months), suggesting strong market momentum despite ongoing losses. No dividends are paid; any capital return would be via buybacks (minor in Q1’26 at ~$1.1M)."

Revenue Growth

Neutral

Revenue was reported as $0 in Q1’26 and all prior quarters provided, so meaningful revenue growth/trajectory was not assessable.

Profitability

Fair

Net income improved QoQ ( -$97.4M vs -$102.5M; ~+5.0% improvement) but worsened YoY ( -$97.4M vs -$72.0M; ~-35.2% deterioration). R&D increased YoY (~+19.6%), while losses remained substantial; margin metrics are not meaningful with zero revenue.

Cash Flow Quality

Caution

Operating cash flow was -$86.9M and free cash flow -$87.3M in Q1’26, indicating persistent burn. No dividends paid; buybacks were immaterial (~$1.1M) versus ongoing operating cash losses.

Leverage & Balance Sheet

Good

Balance sheet remains well-capitalized for a loss-making firm: Q1’26 total assets ~$903.0M and equity ~$607.7M. Net debt stayed near zero to slightly negative (net cash position), with very high liquidity (cash + short-term investments ~$866.4M).

Shareholder Returns

Strong

Total shareholder return signal is strongly positive from capital appreciation: price is up 772.4% over 1 year (>20% momentum threshold). Dividend yield is 0; buybacks are small.

Analyst Sentiment & Valuation

Neutral

Consensus price target (~$48.13) is below the current price ($37.25), implying limited downside/valuation support is not strongly positive based on the provided figures. Targets have wide range ($35–$60), consistent with uncertainty.

Disclaimer:This analysis is AI-generated for informational purposes only. Accuracy is not guaranteed and this does not constitute financial advice.

Fundamentals Overview

Loading fundamentals overview...

📋 Official Regulatory 10-K / 10-Q SEC Filings

Direct authenticated documentation links to audited SEC database reports for COGT.

SEC EDGAR Live Feed
Loading financial data and tables...
📁

SEC Filings (COGT)

© 2026 Stock Market Info — Cogent Biosciences, Inc. (COGT) Financial Profile