Cohu, Inc.

Cohu, Inc. (COHU) Market Cap

Cohu, Inc. has a market capitalization of $2.26B.

Price: $47.99

1.54 (3.32%)

Market Cap: 2.26B

NASDAQ · time unavailable

CEO: Luis Antonio Müller

Sector: Technology

Industry: Semiconductors

IPO Date: 1980-03-17

Website: https://www.cohu.com

Cohu, Inc. (COHU) - Company Information

Market Cap: 2.26B|Sector: Technology

Company Profile

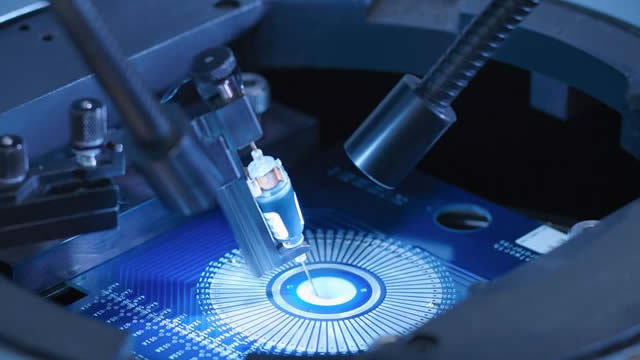
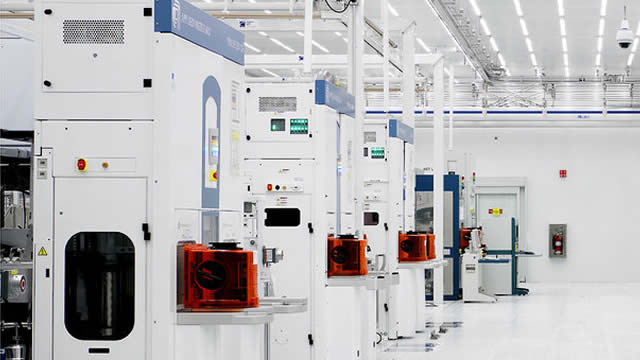
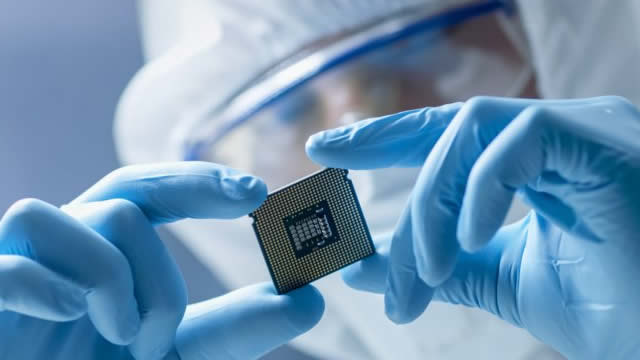
Cohu, Inc. stands as a prominent global provider of advanced semiconductor test equipment and comprehensive associated services. Operating through its various subsidiaries, the company extends its reach across key international markets including China, the United States, Taiwan, Malaysia, and the Philippines. Its diverse product portfolio caters to semiconductor and electronics manufacturers, as well as test subcontractors, encompassing crucial equipment such as automated test equipment (ATE) for both wafer-level and device package testing, and a wide array of test and inspection handlers. These handlers include specialized pick-and-place, turret, gravity, strip, and advanced micro-electromechanical system (MEMS) and thermal sub-systems. Cohu also offers vital interface components like test contactors, probe heads, and pins. Beyond hardware, Cohu delivers extensive post-sales support, including spare parts and kits, robust parts and labor warranties for its systems and instruments, and essential training for system maintenance and operation. The company further provides application and data management software, alongside expert consulting services related to its product offerings. A significant technological offering is the DI-Core data analytics product suite. This sophisticated software is engineered to optimize the performance of Cohu equipment, facilitating real-time online monitoring and precise process control. Cohu distributes its solutions through a combination of its direct sales force and a network of independent sales representatives. Established in 1947, the company originally operated as Cohu Electronics, Inc. before adopting its current name, Cohu, Inc., in 1972. Its corporate headquarters are located in Poway, California.

Analyst Sentiment

92%
Strong Buy

From 8 Active Polls

1Y Forecast: $66.83

▲ +39.3% Potential Upside

Consensus Target Metrics

Low Bound

$53

Median

$68

High Bound

$74

Average

$67

Price & Moving Averages

Loading chart...

🎯 Wall Street Analyst Intelligence Report

1-Year structural target targets, chart projections, and sentiment maps.

Average 1Y Target
$66.83
▲ +39.26% Upside
Low Target
$53.00
10% Risk
Median Target
$67.50
41% Mid
High Target
$74.00
54% Max
Consensus
Buy
12 / 14 Buys

Consensus Trend Projection

Trailing closures vs. 12-month metrics map.

Analyst Vote Distribution

Aggregate institutional coverage sentiment weights.

📊 Historical Valuation Multiples

Real-time Trailing Twelve Month (TTM) momentum side-by-side with discrete quarterly metrics.

Fiscal QuarterTTMQ2 2026Q1 2026Q4 2025Q3 2025Q2 2025Q1 2025Q4 2024Q3 2024
Period EndingTrailing 12MJun 27, 2026Mar 28, 2026Dec 27, 2025Sep 27, 2025Jun 28, 2025Mar 29, 2025Dec 28, 2024Sep 28, 2024
Market Cap ($M)2,2643,0331,4091,1009619047041,2591,215
Enterprise Value ($M)2,3713,1401,5251,2018617905791,0711,047
Price to Earnings Ratio (P/E)-57.74-4711.76-28.83-12.23-58.61-13.46-5.72-14.58-16.63
Price/Earnings-to-Growth Ratio (PEG)-246.84-12.20-3.40-1.20-2.01
Price to Sales Ratio (P/S)4.3320.3511.269.007.618.407.2813.3712.74
Price to Book Ratio (P/B)2.933.921.831.401.161.090.851.471.37
Price to Free Cash Flow Ratio (P/FCF)64.84372.62170.0230.18-53.4967.55-33.31-264.5780.40
Enterprise Value to Sales (EV/Sales)21.0712.199.836.827.345.9911.3810.98
Enterprise Value to EBITDA (EV/EBITDA)104.33870.08407.80-1311.07130.71-1469.00-48.38-91.87-402.20
Debt to Equity Ratio4.720.420.430.420.060.060.030.020.02

📘 Full Research Report

ℹ️

AI-Generated Research: This report is for informational purposes only.

📘 COHU INC (COHU) — Investment Overview

🧩 Business Model Overview

COHU supplies semiconductor test and burn-in infrastructure used to validate device performance and reliability before shipment. The value chain begins with semiconductor manufacturers and OSAT (outsourced semiconductor assembly and test) providers that need to screen parts for defects, measure electrical/functional performance, and confirm thermal endurance under stress conditions. COHU’s offerings sit in the workflow where reliability testing and test-handling interfaces matter—turning product-ready semiconductors into production-screened units by integrating hardware, controls, and customer-specific engineering into automated test environments.

The practical “how it works” is equipment qualification and integration: customers evaluate COHU systems for throughput, test coverage, thermal performance, uptime, and ease of sustaining operations over time. After acceptance, COHU typically benefits from the installed base through service, parts, and upgrades that support ongoing production needs.

💰 Revenue Streams & Monetisation Model

COHU’s monetization is primarily equipment-driven, supplemented by recurring aftermarket activities. Revenue streams typically include:

  • System sales and upgrades: transactional revenue tied to customer capex cycles and new product ramps requiring additional test capacity.
  • Aftermarket service and parts: maintenance, repairs, and replacement components that support uptime and extend equipment life.
  • Component-level sales tied to the installed base: recurring demand can emerge as customers reorder parts for continued production and as production formats evolve.

Margin drivers are tied to (1) system mix and configuration complexity, (2) manufacturing execution and component sourcing, and (3) the share of aftermarket revenue, which generally carries stronger gross margin characteristics than initial system sales.

🧠 Competitive Advantages & Market Positioning

COHU’s moat is best characterized as switching costs and process know-how, reinforced by intangible credibility from qualification and service track record.

  • Switching costs (qualification + integration): Semiconductor reliability test systems require validation, integration into existing factory workflows, and production acceptance. Replacing qualified systems involves engineering effort, downtime, and performance risk—making customers reluctant to change vendors without clear economic or technical advantages.
  • Installed base service economics: Once deployed, operational dependence on maintenance, spare parts, and support creates ongoing revenue opportunities and strengthens long-term relationships.
  • Reliability and throughput engineering: Test-handling and thermal/burn-in use cases demand stable operation and accurate measurement under stress, where accumulated engineering experience can translate into fewer production disruptions and better yield outcomes.

COMPETITIVE BENCHMARKING (primary competitors)

  • Teradyne: A leading provider of automated test equipment (ATE) platforms. Teradyne competes more directly for broad test system footprints, while COHU’s emphasis tends to concentrate on reliability testing and test-handling solutions that integrate into customers’ broader test architectures.
  • Advantest: Also a major ATE incumbent. Advantest’s focus spans high-volume test platforms; COHU typically competes in adjacent infrastructure segments where test-handling reliability and thermal validation are critical.
  • FormFactor: Primarily known for probe cards and wafer test interface technologies. While FormFactor’s overlap occurs earlier in the electrical testing chain, customers evaluating complete test workflows often consider the same constraints around manufacturability, uptime, and sustaining performance—creating indirect competitive tension.

Overall, COHU differentiates by targeting the reliability-screening and test-handling interface that supports production yield and product endurance, rather than competing as a general-purpose ATE platform provider.

🚀 Multi-Year Growth Drivers

Over a 5–10 year horizon, COHU’s opportunity is tied to enduring drivers that increase the need for higher-throughput, more reliable screening across a growing and more complex semiconductor end-market:

  • AI and high-performance compute drive semiconductor complexity: More advanced memory and compute architectures increase demand for effective reliability screening and production test throughput.
  • Reliability standards become harder to meet: As devices scale and operating conditions tighten, burn-in and stress testing remain essential to reduce field failures.
  • Advanced packaging and heterogeneous integration: Chiplets, stacked memory, and other packaging approaches tend to expand test complexity, requiring equipment that can sustain stable throughput and thermal performance while supporting evolving device formats.
  • OSAT/production capacity expansion in electronics manufacturing: Growth in outsourced assembly and test capacity increases the total installed base of test infrastructure and sustains aftermarket service demand.
  • Lifecycle sustaining demand: Even when equipment is originally purchased during ramp-up periods, ongoing production and product refreshes support parts and service intensity.

⚠ Risk Factors to Monitor

  • Semiconductor capex cyclicality: System purchases remain sensitive to memory and broader semiconductor spending cycles; demand can soften when manufacturers reduce investment.
  • Technological substitution risk: Shifts in device architecture, packaging, or test methodology may require redesigns to maintain fit-for-purpose performance and reliability outcomes.
  • Customer concentration and specification risk: Large customers can drive qualification timelines and specification changes, affecting backlog conversion and product mix.
  • Competitive pricing and installed-base leverage: Incumbents and system integrators may pressure pricing if customers standardize around preferred platforms or vendors.
  • Supply chain and component availability: Semiconductor equipment manufacturing depends on timely access to specialized components; disruptions can impact delivery schedules and service responsiveness.
  • Export controls and trade restrictions: Cross-border technology and equipment sales can face regulatory constraints that affect market access and product availability.

📊 Valuation & Market View

Market valuation for semiconductor test and automation suppliers typically reflects a blend of (1) cyclical visibility into customer capex, (2) aftermarket/service contribution, and (3) confidence in sustaining installed-base demand through product transitions. Investors commonly evaluate this sector using metrics such as EV/EBITDA and price-to-sales, with sentiment increasingly influenced by:

  • Aftermarket/service durability and parts replacement behavior
  • Order conversion tied to new product ramps
  • Gross margin resilience through component and mix changes
  • Evidence of qualification wins in higher-complexity device generations

🔍 Investment Takeaway

COHU presents an evergreen investment case rooted in switching costs from qualification and integration, an installed-base service engine, and engineering credibility in reliability-focused test infrastructure. The multi-year demand backdrop—driven by AI-related semiconductor complexity, advanced packaging, and sustained reliability screening needs—supports a structural role for COHU’s niche in semiconductor test workflows. Key diligence focus should center on qualification momentum, aftermarket/service mix, and adaptability to evolving device and packaging test requirements.


⚠ AI-generated — informational only. Validate using filings before investing.

📰 Market News & Coverage

15 Stories Available

Real-time institutional reporting and market updates for COHU.

seekingalpha.com2026-07-31

Cohu, Inc. (COHU) Q2 2026 Earnings Call Transcript

Cohu, Inc. (COHU) Q2 2026 Earnings Call Transcript

zacks.com2026-07-31

COHU Q2 Earnings Beat Estimates on AI Compute and Favorable Mix

Cohu's Q2 earnings and revenues beat estimates as AI compute demand, higher tester and recurring sales and a favorable mix lift results.

zacks.com2026-07-30

Cohu (COHU) Q2 Earnings and Revenues Surpass Estimates

Cohu (COHU) came out with quarterly earnings of $0.26 per share, beating the Zacks Consensus Estimate of $0.14 per share. This compares to earnings of $0.02 per share a year ago.

marketbeat.com2026-07-30

Cohu Q2 Earnings Call Highlights

Cohu NASDAQ: COHU reported second-quarter 2026 revenue of $149 million, up 38% from a year earlier and above the midpoint of its guidance, as demand for high-performance computing equipment and a recovery in several core semiconductor markets supported results.

businesswire.com2026-07-30

Cohu Reports Second Quarter 2026 Results

SAN DIEGO--(BUSINESS WIRE)--Cohu, Inc. (NASDAQ: COHU), a global supplier of equipment and services optimizing semiconductor manufacturing yield and productivity, today reported fiscal 2026 second quarter net sales of $149.0 million and GAAP loss of $0.2 million or $0.00 per share. Net sales for the first six months of 2026 were $274.1 million and GAAP loss was $12.2 million or $0.26 per share. Cohu also reported non-GAAP results, with second quarter 2026 income of $14.1 million or $0.26 per sha.

marketbeat.com2026-07-28

These 3 Stocks Have Soared in 2026—Can They Keep Climbing?

Heading into August 2026, the S&P 500 seems to be experiencing a sluggish summer, although the market remains up about 8% year to date (YTD). This is despite a protracted sell-off in the AI industry that has rattled some of the biggest gainers this year.

businesswire.com2026-07-16

Cohu To Announce Second Quarter Financial Results on July 30

SAN DIEGO--(BUSINESS WIRE)--Cohu, Inc. (NASDAQ: COHU), a global supplier of equipment and services optimizing semiconductor manufacturing yield and productivity, will release financial results for second quarter 2026 on Thursday, July 30, 2026, at 1:00 p.m. Pacific Time/4:00 p.m. Eastern Time. The Company will host a live conference call and webcast with presentation materials to discuss the results at 1:30 p.m. Pacific Time/4:30 p.m. Eastern Time. Interested parties may listen live via webcast.

seekingalpha.com2026-07-16

Cohu Is An Underfollowed AI Testing Play

I rate Cohu a Strong Buy with an $83 price target, reflecting 57% upside from current levels. COHU is expanding into AI processor testing, high-bandwidth memory inspection, power management, and analytics, targeting a $1.6B serviceable market. Eclipse, Neon, Diamondx, PAICe software, and improving utilization could add about $1.05 of incremental EPS and lift my 2027 non-GAAP EPS estimate to $1.63.

fool.com2026-07-09

Why Cohu Stock Raced Nearly 6% Higher Today

He feels the company is well-positioned to capitalize on the current feverish build-out of AI capacity. He's also flagged it as a business that can weather semiconductor sector dips.

247wallst.com2026-07-09

Here Are Thursday's Best Wall Street Analyst Research Calls: Align Technology, American Tower, Caesars Entertainment, Cohu, Five Below, Intuitive Surgical, Salesforce, Toast, and More

Futures are trading mixed after another tough day across Wall Street, with all the major indices crushed early on, before the Nasdaq made a late-afternoon push to wind up just modestly higher at 25,870, up 0.20%.

seekingalpha.com2026-07-04

Cohu: AI Test Exposure Can Still Pull Earnings Higher

I rate Cohu a buy, as its AI/HPC pipeline and recurring revenue base are underappreciated in current earnings. COHU's products address the increasing complexity of AI and high-performance computing chip testing, positioning it for significant revenue growth. Management targets $600–800M revenue, 48–50% gross margin, and $1.50–$3.25 non-GAAP EPS mid-term, with upside if the AI/HPC funnel converts.

fool.com2026-07-03

Cohu's CFO Sold 13,000 Company Shares. Here's What That Means for Investors.

CFO Jeffrey Jones sold 13,000 shares for a total value of approximately $609,000 on May 22, 2026. This transaction represented 3.64% of Jones' direct holdings at the time of sale.

zacks.com2026-07-02

Cohu Is Riding AI and HBM Trends But Execution Still Matters

COHU is gaining AI and HBM momentum as test demand recovers, but customer qualifications, ramps and execution remain key to the story.

zacks.com2026-07-02

Is COHU Stock Still Worth Buying After Its Big 2026 Rally?

COHU's rally reflects AI and HPC momentum, but richer valuation and early profit recovery make execution risks harder to ignore.

zacks.com2026-07-02

COHU Stock Outlook Hinges on AI Growth and Profit Recovery

Cohu's AI and HPC opportunities are growing, but the stock outlook still hinges on execution, HBM traction and stronger profitability follow-through.

📊 AI Financial Analysis

Powered by StockMarketInfo
Earnings Data: Q Ending 2026-06-27

"COHU reported Q2’26 revenue of $149.0M and EPS of -$0.0034, with net income of -$0.16M. YoY (Q2’26 vs Q2’25), revenue increased from $107.7M to $149.0M (+38.3%) while net income remained negative and improved from -$16.9M to -$0.16M. QoQ (Q2’26 vs Q1’26), revenue rose from $125.1M to $149.0M (+19.1%), but profitability deteriorated: net income moved from -$12.1M to -$0.16M (loss narrowed significantly), and margins improved sequentially (net margin -0.096% in Q1 to -0.107% in Q2 is slightly more negative by ratio, but absolute losses narrowed materially as operating income turned positive). Over the last four quarters, gross profit ratio peaked in Q1’26 (40.4%) before moderating to 34.1% in Q4’25 and ~35.6% in Q3’25; Q2’26 shows gross profit ratio data not populated, but operating income is positive ($0.29M) versus losses in Q1–Q4’25. Operating cash flow was -$10.3M and free cash flow was -$8.3M in Q2’26, reversing the prior quarter’s +$10.3M operating cash flow, suggesting working-capital pressure. Balance sheet resilience improved: cash/short-term investments rose to $498.2M and total equity to $805.3M (vs $769.0M in Q1’26). Total shareholder return looks very strong given the stock’s +196.2% 1Y change; dividends are zero and buybacks were modest (+$4.6M in Q2’26)."

Revenue Growth

Strong

QoQ revenue rose +19.1% (125.1M to 149.0M) and YoY revenue rose +38.3% (107.7M to 149.0M). Trajectory is upward over the period.

Profitability

Caution

Net income remains negative in Q2’26 (-0.16M). Sequentially, losses narrowed sharply vs Q1’26 (-12.1M to -0.16M), but operating margin/ratios are still very low; profitability volatility persists across the 4-quarter history.

Cash Flow Quality

Caution

Q2’26 operating cash flow was -$10.3M and free cash flow -$8.3M, reversing Q1’26 positive operating/free cash flow (+$10.3M/+8.3M). Net income is not supported by cash generation in the latest quarter.

Leverage & Balance Sheet

Positive

Total assets increased to $1.26B and equity strengthened to $805.3M. Cash balance is higher (cash+ST inv $498.2M vs $488.7M in Q1’26). Debt is elevated but liquidity improved; net debt is negative (net cash position) at -$171.2M.

Shareholder Returns

Strong

Total return tailwind from market performance: +196.2% 1Y. No dividend yield (0%), but modest buybacks occurred (+$4.6M in Q2’26), supporting per-share value.

Analyst Sentiment & Valuation

Fair

Analyst consensus target is $60.4 vs current price $41.26 (upside ~46%). However, near-term valuation is distorted by negative earnings (e.g., negative P/E), and cash/free-cash flow softness in Q2’26 tempers confidence.

Disclaimer:This analysis is AI-generated for informational purposes only. Accuracy is not guaranteed and this does not constitute financial advice.

Fundamentals Overview

Loading fundamentals overview...

Cohu delivered a strong Q2 with $149M revenue (+38% YoY) and gross margin of 45.5% (above guidance) on favorable mix, while scaling operating expenses only to $52.7M to support high-performance compute (HPC) momentum. The key driver is utilization rising to 80%, translating into a visibly strengthening commercial funnel: management estimates ~$850M annual HPC pipeline, including $190M qualified across 4 customers (3 HPC, 1 HBM) and $250M actively qualifying across 5. They raised fiscal 2026 growth outlook to ~35% and guided Q3 to ~$170M revenue (+14% sequentially). Management repeatedly linked upside to HPC handler/Eclipse adoption plus analytics/software scaling (PACE moving toward larger account expansion), while inspection (HBM3/HBM4/HBM4e shipments) and Neon/DI-Core initiatives add platform breadth. The main headwinds are supply chain scaling and higher/longer-lead memory costs; mitigation relies on advanced purchases and Malaysia (plus thermal head) capacity expansion.

AI IconGrowth Catalysts

  • Advanced thermal test handlers for AI processors—Eclipse Handler adoption in high-performance computing using advanced active thermal control
  • PACE prescriptive analytics software expanding within high-performance-compute test handler fleets (first deployment progressing toward largest single-customer software opportunity)
  • HBM inspection and metrology—shipped additional final inspection systems for HBM3, HBM4, and HBM4e to a US-based IDM; investment positioned for HBM5 and beyond
  • Diamondx-configured GaN power and advanced connectivity test solutions engaging leading power/RF customers for GaN mobile front end and advanced connectivity applications
  • Neon vision inspection sensor with shortwave infrared capability for inner-crack detection in complex silicon devices
  • Interface solutions traction in silicon photonics—$500k interface solutions booked for optical engine test (insertion 3)

Business Development

  • Eclipse Handler—adoption enabled by advanced active thermal control for extreme power; customers expanding in data centers with next-generation JetAc Max devices
  • PACE software analytics—progressing from an announced HPC chipmaker commitment (predictive maintenance across test handler fleet) toward a largest software-to-single-customer expansion plan during 2H 2026
  • US-based IDM—additional final inspection system shipments for HBM3/HBM4/HBM4e
  • Taiwan-based OSAT—qualified Neon, establishing a foothold in high-volume outsourced assembly environment (pursuing advanced package, mobile, and AI-adjacent inspection opportunities)
  • SE Asia OSAT expansion—COHU increasing presence/infrastructure to support fabless and hyperscaler programs moving from qualification to production ramp
  • Supply partners and internal Malaysia manufacturing expansion—working with suppliers to increase capacity; expanding internal manufacturing in Malaysia to double output by year-end

AI IconFinancial Highlights

  • Q2 2026 revenue: $149M, +38% YoY; exceeded midpoint of guidance (midpoint reference but no exact expected figure provided)
  • Recurring revenue ~53% of total revenue (consumables primarily referenced)
  • Gross margin: 45.5%, above guidance primarily due to more favorable product mix
  • Operating expenses: $52.7M, in line with guidance (scaled resources to support rapid HPC opportunity increase)
  • Non-GAAP EPS: $0.26; adjusted EBITDA: 12%
  • Q2 tax provision: $2.7M, lower than guidance due to improved profitability in the US
  • Q3 guidance: revenue +14% sequentially, +35% YoY to ~$170M (±$7M); Q3 gross margin ~45%; Q3 operating expenses ~$54M
  • Full-year 2026 revenue outlook increased to ~35% growth over last year; full-year gross margin expected mid-40% range

AI IconCapital Funding

  • No stock repurchases completed during Q2
  • Cash and investments: $498M (up ~$9M during Q2); cash from operations: $10M
  • Total debt: $304M, including $288M from Q4 2025 convertible debt offering
  • Capex: ~$2M in Q2; targeting total 2026 capex about 2% of revenue

AI IconStrategy & Ops

  • Estimated semiconductor test utilization increased sequentially to 80% by end of Q2
  • Segment utilization mix: computing low 80s; industrial low 80s; automotive and mobile in high 70s (automotive high 70s referenced; automotive orders down 24% YoY despite utilization context)
  • HPC customer traction pipeline estimated at ~$850M annually: $190M qualified annual opportunity (4 customers), $250M active qualification (5 customers), ~$445M early-stage engagement (10 customers)
  • Capacity actions: Malaysia HPC handler manufacturing expansion—expects to double output by year-end and support another step-up by mid-2027
  • Small Philippines expansion for thermal heads to add supply capacity
  • Supply chain mitigation: advanced purchases for higher-cost/long-lead memory; proactive component securing to minimize lead-time/profitability/customer pricing impact

AI IconMarket Outlook

  • Q3 2026 revenue guidance: approximately $170M (plus or minus $7M)
  • Q3 gross margin guidance: ~45%
  • Full-year 2026 revenue growth guidance: ~35% YoY
  • Full-year 2026 gross margin guidance: mid-40% range
  • Reiterated supply/capacity ramp timeline: increased output about 50% over next 6 months (HPC handlers) and double output between now and June/July next year; target path to triple output by end of next year if market supports

AI IconRisks & Headwinds

  • Longer lead times and higher input costs across parts of the supply chain due to HPC ramp; CFO/management cited memory as the leading cost/lead-time constraint
  • HPC production expansion relies on exercising supply chain capacity—management noted it is more challenging on the supplier side than internal factory expansion
  • Automotive segment remains weak in recovery cycle: automotive orders down 24% YoY in Q2 despite broader utilization improvement
  • Potential Q4 seasonality uncertainty tied to utilization levels (risk of pullback accelerating into Q1 if utilization seasonally retreats)

Q&A: Analyst Interest

  • HPC pipeline composition and timing: Management confirmed 3 HPC customers and 1 HBM customer in qualified bucket ($190M annual opportunity). For qualification timing, one customer was close to green-lighting; production configuration ship end of August; expect qualification within ~1 month. Another set targets mid-Q1 based on ~6-month qualification duration.
  • Recurring revenue definition: Management broke recurring into three core elements—device application kits (~18-month production life cycles), thermal heads/coverage upgrades as die size grows, and equipment maintenance/spares/consumables. Added a fourth software “soft-sale” subscription component bundled with system orders, with lifecycle value lasting through the product life cycle.
  • Capacity expansion levers and supply constraints: Management described Malaysia output ramp—~50% increase over next 6 months and roughly double output between now and June/July next year, with intent to triple by end of next year if market takes it. They emphasized supplier-side component scaling is the main challenge versus easier internal factory expansion.

Sentiment: POSITIVE

Note: This summary was synthesized by AI from the COHU Q2 2026 earnings transcript. Financial data is complex; please verify all metrics against official SEC filings before making investment decisions.

📋 Official Regulatory 10-K / 10-Q SEC Filings

Direct authenticated documentation links to audited SEC database reports for COHU.

SEC EDGAR Live Feed
Loading financial data and tables...
📁

SEC Filings (COHU)

© 2026 Stock Market Info — Cohu, Inc. (COHU) Financial Profile