Coinbase Global, Inc.

Coinbase Global, Inc. (COIN) Market Cap

Coinbase Global, Inc. has a market capitalization of $40.15B.

Price: $152.40

-11.73 (-7.15%)

Market Cap: 40.15B

NASDAQ · time unavailable

CEO: Brian Armstrong

Sector: Financial Services

Industry: Financial - Data & Stock Exchanges

IPO Date: 2021-04-14

Website: https://www.coinbase.com

Coinbase Global, Inc. (COIN) - Company Information

Market Cap: 40.15B|Sector: Financial Services

Company Profile

Coinbase Global, Inc. provides financial infrastructure and technology for the cryptoeconomy in the United States and internationally. It offers the primary financial account in the cryptoeconomy for consumers; a marketplace with a pool of liquidity for transacting in crypto assets for institutions; and technology and services that enable developers to build crypto-based applications and securely accept crypto assets as payment. The company was founded in 2012 and is based in Wilmington, Delaware.

Analyst Sentiment

79%
Strong Buy

From 34 Active Polls

1Y Forecast: $237.39

▲ +55.8% Potential Upside

Consensus Target Metrics

Low Bound

$107

Median

$240

High Bound

$440

Average

$237

Price & Moving Averages

Loading chart...

🎯 Wall Street Analyst Intelligence Report

1-Year structural target targets, chart projections, and sentiment maps.

Average 1Y Target
$237.39
▲ +55.77% Upside
Low Target
$107.00
-30% Risk
Median Target
$240.00
57% Mid
High Target
$440.00
189% Max
Consensus
Buy
21 / 38 Buys

Consensus Trend Projection

Trailing closures vs. 12-month metrics map.

Analyst Vote Distribution

Aggregate institutional coverage sentiment weights.

📊 Historical Valuation Multiples

Real-time Trailing Twelve Month (TTM) momentum side-by-side with discrete quarterly metrics.

Fiscal QuarterTTMQ1 2026Q4 2025Q3 2025Q2 2025Q1 2025Q4 2024Q3 2024Q2 2024
Period EndingTrailing 12MMar 31, 2026Dec 31, 2025Sep 30, 2025Jun 30, 2025Mar 31, 2025Dec 31, 2024Sep 30, 2024Jun 30, 2024
Market Cap ($M)40,15146,23260,66688,70389,44143,72562,44944,33557,479
Enterprise Value ($M)37,91143,99257,21287,39886,31140,26958,53541,10754,719
Price to Earnings Ratio (P/E)50.40-29.33-22.7551.2715.65166.6212.09146.81397.50
Price/Earnings-to-Growth Ratio (PEG)-0.792.070.14
Price to Sales Ratio (P/S)6.9132.7258.7747.4759.7421.4927.4936.7939.65
Price to Book Ratio (P/B)2.993.434.105.547.394.186.085.086.87
Price to Free Cash Flow Ratio (P/FCF)14.38252.9919.79-113.07272.29-239.2964.7463.65118.71
Enterprise Value to Sales (EV/Sales)31.1355.4346.7757.6519.8025.7734.1137.75
Enterprise Value to EBITDA (EV/EBITDA)29.95-117.58-72.18157.6845.95295.4437.75343.12-10464.43
Debt to Equity Ratio-1.770.590.530.460.360.440.450.520.53

COIN Growth Runway Model

Standard long term linear growth fade

Multi-Stage Discounted Cash Flow Sandbox

Market Price$152.40
Intrinsic Value$22.13
Market Alignment
Overvalued by 85.5%relative to calculated intrinsic value
9.00%
Exp: 12%12%
i

Growth runway slowdown

This value provides a time window for the growth rate to decline beyond Stage 1 toward the terminal rate. Longer windows are most useful for companies with high growth starting conditions or strong competitive advantages. This option stretches out the growth rate slowdown across 5, 10, or 15-year steps. A high-growth starting condition (exceeding a 25% initial growth rate) automatically applies a curve decay to simulate realistic, rapid market saturation.
i

Terminal growth rate

With long-term inflation between 3-5%, revenue must grow by that baseline to maintain flat real-world market share. This value sets the permanent terminal growth rate to factor into the valuation beyond the growth slowdown runway toward maturity.

3-Stage Financial Runway Horizon

🧠 Perpetuity Horizon Engine (Stage 3: Post-2035)

Terminal FCF Base$0.77B
Perpetuity TV Value$14.50B
Discounted TV (PV)$6.12B
TV Weighting %63.3%
⚠️
Financial Model Disclaimer & Risk Disclosure: This interactive scenario simulator is an educational sandbox provided strictly for informational and analytical research purposes. Core historical financial statements and consensus estimates are sourced directly via Financial Modeling Prep (FMP). All downstream outputs are entirely deterministic, hypothetical projections generated by combining automated mathematical formulas (including linear interpolation and Gaussian bell-curve decay models) with user-selected variables and third-party financial data inputs. Users assume all liability for trading decisions executed based on these sandbox calculations.

📘 Full Research Report

ℹ️

AI-Generated Research: This report is for informational purposes only.

📘 COINBASE GLOBAL INC CLASS A (COIN) — Investment Overview

🧩 Business Model Overview

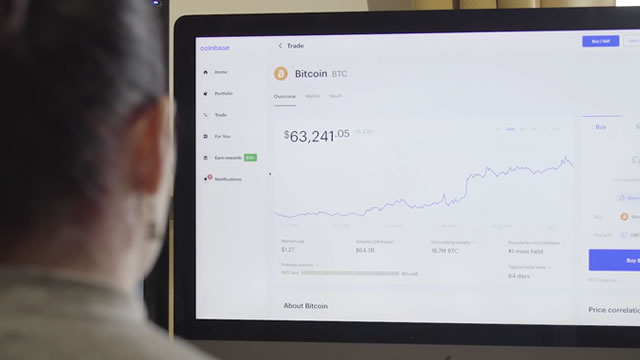
Coinbase operates a regulated digital-asset trading platform and related services stack. The core workflow is: users access an order book for spot trading (directly or via smart routing), transact against Coinbase’s liquidity and market structure, and Coinbase earns transaction-based fees. A second leg of the model serves institutional and wealth segments through custody, prime-style connectivity, portfolio tooling, and other platform services—capturing value beyond one-off trades through recurring account relationships.

The economic center of gravity is liquidity. Higher quality market liquidity supports tighter spreads and improved execution, which in turn tends to attract more activity. Coinbase also converts user activity into operating and data advantages (risk controls, compliance processes, and customer onboarding efficiency), which reduces per-customer marginal effort over time.

💰 Revenue Streams & Monetisation Model

Coinbase monetizes primarily through:

  • Trading and related transaction fees: revenue tied to spot volumes and retail/institutional activity. This is the most cyclical component and typically varies with market sentiment and volatility.
  • Custody and institutional services: fees associated with holding and servicing assets for institutions and sophisticated users. This component is generally less correlated with intraday trading and can provide more durability.
  • Subscription and platform services: monetization from account tiers, tools, and access to ecosystem services. These are typically structurally recurring as usage increases.
  • Other ancillary offerings: services that monetize platform engagement (e.g., settlement/connectivity, programmatic access), which contribute incremental operating leverage when volumes rise.

Margin structure is driven by (1) execution quality and fee design, (2) cost of providing reliable infrastructure (technology, risk management, custody operations), (3) regulatory and compliance overhead, and (4) the mix shift toward custody/institutional services as a greater share of revenue becomes more recurring.

🧠 Competitive Advantages & Market Positioning

Primary moat: regulatory and operational trust in a high-risk asset class, reinforced by customer stickiness.

  • Regulatory moat (license + compliance capability): Coinbase’s differentiated posture comes from operating within a regulated framework with mature risk controls, surveillance, and compliance processes. In digital assets, the ability to serve users at scale while meeting regulatory and institutional requirements creates a meaningful barrier to entry.
  • Operational switching costs / workflow embedding: for institutional clients, custody and trading access are integrated into internal workflows (onboarding, reporting, security, settlement procedures). Migrating providers is not a simple “account change” because it affects controls, reporting, and operational processes.
  • Network effects via liquidity: as trading venues attract liquidity providers and active users, execution improves and participation rises. This dynamic supports Coinbase’s ability to retain share when market activity expands, even if unit economics face pressure.

Competitive benchmarking:

  • Binance: a global venue with broad asset listings and deep liquidity. Coinbase’s positioning emphasizes regulated access and institutional-ready services (custody, reporting, and compliance) versus relying primarily on global retail/international reach.
  • Kraken: a well-known exchange offering both retail and institutional access. Kraken competes through platform breadth and liquidity; Coinbase differentiates through U.S. regulatory focus and the scaling of institutional custody and platform tooling.
  • Gemini: known for compliance-led positioning and regulated custody capabilities. Coinbase competes strongly in institutional service infrastructure and liquidity execution, while Gemini similarly emphasizes regulation; the competitive contest is often around custody depth, product breadth, and execution quality.

Overall, Coinbase’s industry focus differs from global, less regulated competitors by emphasizing compliance, custody credibility, and institutional workflow fit—factors that materially influence customer willingness to switch.

🚀 Multi-Year Growth Drivers

  • Institutionalization of digital assets: growth in custody, treasury management, and trading access for institutions increases demand for regulated infrastructure and operational controls.
  • Market expansion beyond retail trading: tokenization, stablecoin usage, and enterprise adoption can increase the number of participants and use cases, supporting broader transaction ecosystems.
  • Custody and recurring services growth: as more participants treat digital assets as a balance-sheet or operational asset, custody and service layers gain share in total monetization.
  • Improving accessibility and user onboarding: ongoing product development, risk controls, and support infrastructure can increase conversion rates and reduce operational friction, supporting volume growth across cycles.
  • Regulatory clarity as a growth catalyst: clearer rules can expand the addressable universe of compliant counterparties and reduce the “compliance premium” that constrains institutional adoption.

⚠ Risk Factors to Monitor

  • Regulatory uncertainty and compliance cost escalation: changes in licensing regimes, custody rules, taxation, or trading restrictions can alter revenue models and increase overhead.
  • Competition and fee compression: increased market participation by well-capitalized exchanges can pressure trading fee rates, impacting transaction-margin economics.
  • Liquidity and market structure dependence: Coinbase’s exchange economics remain sensitive to market volatility, trading activity, and the health of market makers/liquidity providers.
  • Security, custody, and operational risk: failures in custody operations, security controls, or third-party dependencies could cause direct losses and reputational harm.
  • Counterparty and third-party risk: reliance on banking partners, payment rails, and infrastructure providers can introduce business continuity and settlement risk.
  • Technological disruption: shifts in trading venues, wallet/custody paradigms, or protocol-level changes could alter customer preferences and platform economics.

📊 Valuation & Market View

Markets often value digital-asset platforms using a mix of revenue-based multiples (e.g., EV/Revenue or P/S) and profitability potential (EV/EBITDA when earnings durability improves). The key driver for re-rating typically is the transition from predominantly transaction-driven earnings to a greater share of recurring or more stable services (custody and institutional offerings), alongside evidence of resilient margins through market cycles.

Because exchange businesses are exposed to trading activity, valuation sensitivity tends to concentrate around:

  • Operating leverage: whether cost structure scales with activity without proportional overhead growth.
  • Mix shift: custody/institutional services contribution versus purely trading-based revenue.
  • Regulatory risk perception: how confidently the market can underwrite licensing continuity and business model durability.

🔍 Investment Takeaway

Coinbase’s long-term investment case rests on a durable barrier profile built from regulated trust, operational risk management, and institutional workflow integration—strengthened by liquidity-driven network dynamics. The principal upside lies in multi-year institutionalization and the growth of custody and recurring platform services, while the key vulnerabilities remain regulatory shifts, competitive fee pressure, and crypto market cyclicality.


⚠ AI-generated — informational only. Validate using filings before investing.

📰 Market News & Coverage

15 Stories Available

Real-time institutional reporting and market updates for COIN.

zacks.com2026-06-05

Coinbase Global, Inc. (COIN) Falls More Steeply Than Broader Market: What Investors Need to Know

Coinbase Global, Inc. (COIN) concluded the recent trading session at $152.4, signifying a -7.15% move from its prior day's close.

investors.com2026-06-05

Coinbase Stock Trending Lower; A Spread Strategy In These Call Options Presents Profit Potential

Coinbase stock is in a downtrend. Use a bear call spread trade to generate a return.

247wallst.com2026-06-05

Prediction: Coinbase Stock Will Trade at This Price at The End of The Year

Coinbase (NASDAQ:COIN | COIN Price Prediction) sits at the center of every fight worth having in crypto right now.

barrons.com2026-06-05

Investors Flee Bitcoin ETFs as Crypto Continues to Crumble

Bitcoin is trading at its lowest level since October 2024. That's bad news for crypto bulls and ETFs,

247wallst.com2026-06-05

Bad News for XRP and Bitcoin Investors. Retail Investors are Fleeing Crypto.

On Bloomberg Tech, live from San Francisco today, a venture capital investor laid out a striking thesis about what's actually happening inside the cryptocurrency markets. Retail investors now make up 70% of crypto markets, down from 90%, while institutional participation has climbed from 10% of the digital asset economy to between 20-30%. The shift is... Bad News for XRP and Bitcoin Investors. Retail Investors are Fleeing Crypto.

invezz.com2026-06-05

Coinbase stock falls as Baird flags weak trading volumes and valuation risks

Shares of Coinbase Global COIN moved lower on Friday after Baird reiterated its Neutral rating on the cryptocurrency exchange operator but lowered its price target, warning that weak trading activity could continue to weigh on the business. Coinbase stock fell nearly 7% in trading to around $152.

247wallst.com2026-06-05

Ripple (XRP) Slides 6% as Crypto Risks Becoming a "First Casualty" of the SpaceX IPO

Ripple's XRP token is taking a hit on Friday, June 5. The cryptocurrency is down 6% to $1.103, extending a multi-day slide that has dragged the broader digital asset complex into the red. Bitcoin (CRYPTO: BTC) and Ethereum (CRYPTO: ETH) are also down, but the XRP move stands out given the token's famously devoted retail following. The selling... Ripple (XRP) Slides 6% as Crypto Risks Becoming a "First Casualty" of the SpaceX IPO

fool.com2026-06-05

3 Stocks Cathie Wood Bought on Thursday

If a megacap falls in a forest of upticks, does it make a sound? For one aggressive growth investor, that sound is opportunity.

zacks.com2026-06-05

Investors Heavily Search Coinbase Global, Inc. (COIN): Here is What You Need to Know

Coinbase Global (COIN) has received quite a bit of attention from Zacks.com users lately. Therefore, it is wise to be aware of the facts that can impact the stock's prospects.

zacks.com2026-06-05

HOOD, Webull & Other Brokerages Gain as FINRA Eliminates PDT Rule

HOOD and other brokerages gain after FINRA scraps the PDT rule, ending the $25,000 day-trading minimum and widening retail market access.

zacks.com2026-06-05

Coinbase Eyes Next-Gen Capital Markets Expansion With SpaceX Pre-IPO?

Coinbase launches SpaceX pre-IPO perpetual futures, giving eligible non-U.S. traders blockchain-based private-market price exposure.

schaeffersresearch.com2026-06-04

Drowning Bitcoin Pulls Crypto Stocks into Deep Water

Bitcoin's (BTC) technical weakness is now spilling over into sector peers Strategy (MSTR) and Coinbase (COIN)

barrons.com2026-06-04

Bitcoin Weakness Is Hitting Strategy and Coinbase. What the Charts Say.

Technical weakness in Bitcoin is beginning to spill over into Strategy and Coinbase, with both stocks showing deteriorating chart patterns and growing downside risk.

investopedia.com2026-06-04

5 Things to Know Before the Stock Market Opens

Stocks are largely moving lower ahead of the opening bell Thursday as chip stocks pull back from recent highs, while oil prices fall are falling amid fresh developments in the Middle East; Broadcom shares are dropping despite positive results and guidance from the chipmaker; SpaceX yesterday revealed an IPO target price of $135 per share, which would raise about $75 billion and value the company around $1.75 trillion; CrowdStrike shares are slipping after the company beat estimates, following a record rally for the cybersecurity firm ahead of the report; Bitcoin is extending a recent slump to the lowest point since February, pulling other crypto stocks down with it.

cnbc.com2026-06-04

Investors can 'buy' SpaceX early with Coinbase perpetual futures on pre-IPOs

Pre-IPO perpetual futures contracts give traders the ability to speculate on the value of a private company without owning shares. Coinbase said SpaceX is the first in a planned pipeline of pre-IPO contracts covering hot sectors like AI, energy and space.

📊 AI Financial Analysis

Powered by StockMarketInfo
Earnings Data: Q Ending 2026-03-31

"COIN reported Q1’26 revenue of $1.41B and net loss of $(394.1)M (EPS: -$1.49). On a QoQ basis, revenue rose to $1.41B from $1.03B in Q4’25 (+36.9% QoQ), but profitability deteriorated: net income fell from $(666.7)M to $(394.1)M (net loss narrowed by +40.9% QoQ). YoY, revenue declined from $2.03B in Q1’25 to $1.41B (−30.5% YoY) and net income swung from +$65.6M in Q1’25 to a loss of $(394.1)M (down −701.5% YoY). Margin trends show major contraction over the year: gross margin was ~86.1% in Q1’26 versus ~75.3% in Q1’25 (up), but operating and pre-tax performance remains sharply negative, with net margin at −27.9% (vs +3.2% in Q1’25). Operating cash flow stayed positive at $182.7M despite the net loss, while free cash flow matched operating cash flow. Balance sheet resilience remains solid with $13.25B cash & cash equivalents and short-term cash, net debt of approximately −$3.29B (net cash), and equity of $13.48B. Shareholder returns likely benefited from market momentum: COIN’s 1Y price change is +19.81% (below the +20% threshold), with no dividends and buybacks of about $1.06B during the quarter supporting capital return. Analyst sentiment/valuation: consensus price target is $244.38, below the current price of $206.33 implied by the provided dataset; upside/downside depends on where the target is measured, but the targets suggest a valuation reset versus recent peaks."

Revenue Growth

Fair

Revenue increased +36.9% QoQ (Q4’25 $1.03B to Q1’26 $1.41B) but fell −30.5% YoY (Q1’25 $2.03B to Q1’26 $1.41B), indicating a volatile, down YoY trajectory.

Profitability

Neutral

Gross margin improved to ~86.1% in Q1’26, but earnings collapsed: net margin was −27.9% vs +3.2% in Q1’25, and EPS was −$1.49 vs +$0.26. Net loss narrowed QoQ (from −$2.49 EPS to −$1.49), but profitability remains materially negative.

Cash Flow Quality

Positive

Despite the net loss, operating cash flow was positive at $182.7M and free cash flow matched that level. No dividends were paid; buybacks were significant (repurchased ~$1.06B), indicating cash generation/management can support capital return even in down quarters.

Leverage & Balance Sheet

Good

Balance sheet remains strong: cash & cash equivalents of ~$10.5B (plus short-term investments as provided), equity of $13.48B, and net debt of about −$3.29B (net cash). Total assets were ~$28.85B, up slightly QoQ.

Shareholder Returns

Neutral

Total shareholder return is mixed: share price performance is +19.81% over 1Y (near but below the >20% momentum boost). No dividends; buybacks were material in Q1’26 (common stock repurchased ~$1.06B).

Analyst Sentiment & Valuation

Fair

Consensus target ($244.38) is above the provided current price ($206.33), but the valuation has not clearly re-rated to offset the earnings deterioration. High volatility and negative earnings can keep sentiment cautious.

Disclaimer:This analysis is AI-generated for informational purposes only. Accuracy is not guaranteed and this does not constitute financial advice.

Fundamentals Overview

Loading fundamentals overview...

Q1 2026 showed Coinbase holding fundamentals while the market stayed weak: revenue fell 21% QoQ and consumer transaction revenue declined 23%, but management delivered within/better than every February range and kept profitability positive (adjusted EBITDA $303M). The core narrative is mix and diversification: Everything Exchange expansion is offsetting spot pressure, with derivatives annualized >$200M and prediction markets annualized ~$100M by March, plus >4x QoQ growth in non-crypto contracts (silver/gold/oil). Stablecoins remained a bright spot—USDC held hit an all-time high, stablecoin revenue was $305M, and agentic commerce is concentrated on Base (over 90% of agentic volume; Base settlement ~90% for agentic stablecoin transactions). Expenses declined 5% QoQ with G&A down 17% and a further Q2 sequential decline guided, alongside $50M–$60M restructuring. Regulatory clarity is the dominant external overhang: CLARITY timing looks favorable, but rule-writing details remain a near-term uncertainty.

AI IconGrowth Catalysts

  • Everything Exchange traction: derivatives revenue annualized >$200M and prediction markets annualized to ~$100M by March (2 months after launch)
  • Non-crypto contract expansion on Everything Exchange (silver, gold, oil) with >4x quarter-over-quarter growth
  • Stablecoin adoption momentum: new all-time high USDC held in Coinbase products; Base dominance for agentic stablecoin transactions (over 90% on Base in Q1)
  • DeFi scaling: DEX volumes up 2x quarter-over-quarter; borrow/lend balances >$1B
  • Agentic commerce: over 90% of onchain agentic transaction volume happening on Base; x402 ecosystem expansion

Business Development

  • Circle: USDC contract auto-renews; management expects relationship to proceed under set Circle contract terms despite CLARITY rewards language uncertainty
  • Linux Foundation governance for x402; additional contributors named: Cloudflare, AWS, Stripe, Shopify, Google
  • Deribit: Deribit transaction closed; Coinbase integrating to unify spot/perps/futures/options (US timeline not provided; global integration expected during 2026)

AI IconFinancial Highlights

  • Q1 revenue $1.4B; quarterly net loss $394M; positive adjusted EBITDA $303M
  • Revenue down 21% QoQ; transaction revenue $756M with consumer down 23% vs overall consumer spot volumes down 35% (mix shift toward core trading and increased contribution from newer products not in spot trading volume)
  • Subscription and services revenue $584M down 16% QoQ; stablecoin revenue $305M
  • Total operating expenses $1.4B down 5% QoQ; G&A declined 17% QoQ (declines in deal-related legal/customer support/policy-related costs); came in under expense guidance
  • Expectations/outlook check: management states results delivered within or better than every February range
  • Q2 guidance: subscription and services revenue $565M–$645M; T&D and G&A $820M–$870M (down 4%–9% from Q1) plus $50M–$60M restructuring expenses from announced headcount reduction
  • Annual adjusted expense outlook: 2026 adjusted expenses $4.3B–$4.6B (midpoint roughly $500M lower than Q4 2025 annualized exit rate); absent growth in USDC rewards, expects 2026 expenses flat to 2025
  • USDC and accounting/reporting: reclassified $18M corporate stablecoin revenue to other revenue to reflect fungibility treatment; recast historical periods for comparability
  • Balance sheet/quarter: ended with >$10B cash and cash equivalents; total available resources of $12B

AI IconCapital Funding

  • Buybacks: repurchased ~6M shares for ~$1.1B in Q1
  • Convertible notes: 2026 convertible notes due June 1; management intends to retire the $1.3B obligation if notes do not reach defined conversion price
  • Liquidity: >$10B cash and cash equivalents; total available resources $12B; described as flexible to invest through the cycle and return capital

AI IconStrategy & Ops

  • AI-native transition: pull requests per engineer up ~80% YoY; integration test coverage across core services up 3x in last 6 months; quality scaling faster than growth in new pull requests
  • Restructuring: headcount reduction announced earlier this week; $50M–$60M restructuring expenses expected in Q2 as a stand-alone line item
  • Operational controls: management described multiple human review levels for code drafted by nontechnical users/AI agents; emphasized quality and cybersecurity
  • Product/segment execution: derivatives and prediction markets considered leading indicators of Everything Exchange adoption; retail derivatives ~$200M+ annualized; prediction markets ~$100M annualized by March

AI IconMarket Outlook

  • Macro condition acknowledgment: total crypto market cap and total crypto trading volume down >20% QoQ; volatility in long-tail assets at historic lows (context for declines)
  • Q2 subscription and services revenue guidance: $565M–$645M
  • Q2 technology & development and G&A guidance: $820M–$870M (down 4%–9% from Q1)
  • Q2 restructuring expense guidance: $50M–$60M
  • 2026 adjusted expense guidance: $4.3B–$4.6B; absent USDC reward growth, expects 2026 expenses flat to 2025

AI IconRisks & Headwinds

  • Industry macro: total crypto market cap and total crypto trading volume down >20% QoQ; price headwinds outpaced strong growth in controlled fundamentals
  • Nonlinear revenue sensitivity: transaction revenue driven by crypto asset prices and trading volumes; spot volumes down despite diversification into derivatives/prediction markets
  • Regulatory process uncertainty: CLARITY Act still requires markup and post-floor vote steps; details on stablecoin rewards and other rules still being written after passage
  • Execution risk on AI/code automation: reliance on AI agents for draft code requires human review; management acknowledges frontier automation is not yet production-autonomous
  • Crypto speculative volume timing: management addressed the possibility that speculative volume decline may precede utility-driven step-function demand (no full quantitative response captured due to transcript truncation)

Q&A: Analyst Interest

  • CLARITY Act timing and stablecoin rewards impact: Management (Paul Grewal) said CLARITY is headed to markup “this month,” with a floor vote in early summer and expects signed legislation by end of summer. He cited a Senator Tillis/Alsobrooks compromise preserving activity-based rewards while prohibiting passive deposit-style yield; emphasized remaining rule-writing still uncertain.
  • Stablecoin rewards policy and Circle revenue-share mechanics: Management (Paul Grewal, Alesia Haas) stated Circle contracts are already set and auto-renew, so they expect to continue the relationship under existing terms. Haas added revenue share ties to overall USDC supply and adoption and is described as unaffected by rewards language.
  • x402 opportunity and incremental USDC monetization: Management (Brian Armstrong) explained x402 as an open protocol incubated at Coinbase and now governed via Linux Foundation contributions. He stated 99% of x402 transactions are settled in USDC and ~90% of agentic stablecoin volume is on Base in Q1, suggesting monetization linkage through USDC settlement and Coinbase developer platform integration.

Sentiment: MIXED

Note: This summary was synthesized by AI from the COIN Q1 2026 earnings transcript. Financial data is complex; please verify all metrics against official SEC filings before making investment decisions.

📋 Official Regulatory 10-K / 10-Q SEC Filings

Direct authenticated documentation links to audited SEC database reports for COIN.

SEC EDGAR Live Feed
Loading financial data and tables...
📁

SEC Filings (COIN)

© 2026 Stock Market Info — Coinbase Global, Inc. (COIN) Financial Profile