Crocs, Inc.

Crocs, Inc. (CROX) Market Cap

Crocs, Inc. has a market capitalization of $6.14B.

Price: $128.01

4.35 (3.52%)

Market Cap: 6.14B

NASDAQ · time unavailable

CEO: Andrew Rees

Sector: Consumer Cyclical

Industry: Apparel - Footwear & Accessories

IPO Date: 2006-02-08

Website: https://www.crocs.com

Crocs, Inc. (CROX) - Company Information

Market Cap: 6.14B|Sector: Consumer Cyclical

Company Profile

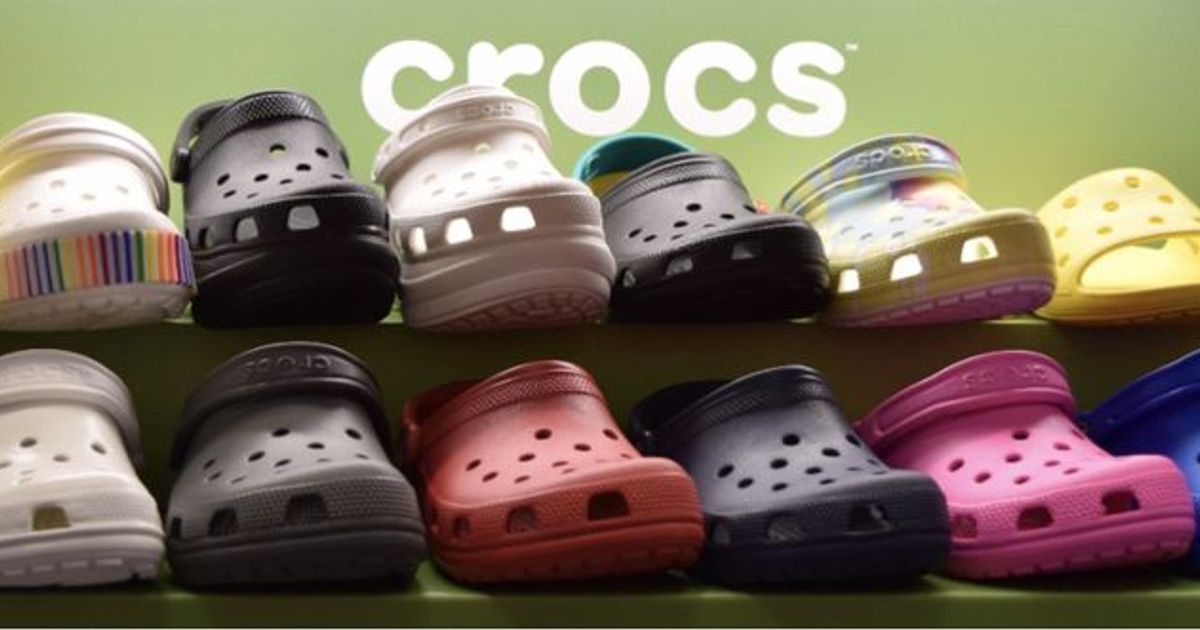
Crocs, Inc., along with its affiliated entities, specializes in the design, development, production, promotion, and distribution of everyday footwear and accessories for men, women, and children. Operating under its well-known Crocs brand, the company provides a diverse range of footwear items, such as its signature clogs, sandals, slides, flip-flops, boots, flats, wedges, platforms, loafers, sneakers, and slippers. Complementing these are accessories like socks and shoe charms. Crocs distributes its merchandise across roughly 85 countries, utilizing multiple sales channels including wholesale partners, its own retail outlets, proprietary e-commerce platforms, and external online marketplaces. By December 31, 2021, its extensive retail network featured 193 outlet stores, 107 traditional retail locations, and an additional 373 company-operated stores, along with 73 kiosks and store-in-store concessions. Furthermore, Crocs managed 14 dedicated e-commerce websites. Geographically, the company's reach extends to the Americas, the Asia Pacific region, Europe, the Middle East, and Africa. Crocs, Inc. was established in 1999 and maintains its corporate headquarters in Broomfield, Colorado.

Analyst Sentiment

66%
Buy

From 15 Active Polls

1Y Forecast: $136.78

▲ +6.9% Potential Upside

Consensus Target Metrics

Low Bound

$95

Median

$150

High Bound

$163

Average

$137

Price & Moving Averages

Loading chart...

🎯 Wall Street Analyst Intelligence Report

1-Year structural target targets, chart projections, and sentiment maps.

Average 1Y Target
$136.78
▲ +6.85% Upside
Low Target
$95.00
-26% Risk
Median Target
$150.00
17% Mid
High Target
$163.00
27% Max
Consensus
Buy
19 / 37 Buys

Consensus Trend Projection

Trailing closures vs. 12-month metrics map.

Analyst Vote Distribution

Aggregate institutional coverage sentiment weights.

📊 Historical Valuation Multiples

Real-time Trailing Twelve Month (TTM) momentum side-by-side with discrete quarterly metrics.

Fiscal QuarterTTMQ2 2026Q1 2026Q4 2025Q3 2025Q2 2025Q1 2025Q4 2024Q3 2024
Period EndingTrailing 12MJun 30, 2026Mar 31, 2026Dec 31, 2025Sep 30, 2025Jun 30, 2025Mar 31, 2025Dec 31, 2024Sep 30, 2024
Market Cap ($M)6,1375,9954,1744,3924,4825,6505,9596,3118,550
Enterprise Value ($M)6,3496,2065,7695,8756,0347,2237,6557,83110,138
Price to Earnings Ratio (P/E)10.987.277.5710.437.68-2.879.324.2810.71
Price/Earnings-to-Growth Ratio (PEG)0.26-0.13
Price to Sales Ratio (P/S)1.515.084.534.594.504.926.366.388.05
Price to Book Ratio (P/B)4.594.332.923.403.293.983.033.444.96
Price to Free Cash Flow Ratio (P/FCF)8.7119.77-58.6717.8219.8220.98-72.1320.8030.66
Enterprise Value to Sales (EV/Sales)5.266.266.146.066.288.177.919.54
Enterprise Value to EBITDA (EV/EBITDA)7.1523.2526.2834.6726.07-17.7631.0936.1735.05
Debt to Equity Ratio0.240.281.211.251.251.250.950.931.03

📘 Full Research Report

ℹ️

AI-Generated Research: This report is for informational purposes only.

📘 CROCS INC (CROX) — Investment Overview

🧩 Business Model Overview

CROX designs and sells casual footwear built around the Crocs clog platform and related silhouettes. Demand is generated through a multi-channel distribution model: wholesale partners plus a direct-to-consumer (DTC) footprint (owned e-commerce and retail). The company monetizes its installed base through product line extensions and accessories, most notably branded charms that personalize footwear. This setup creates a repeatable “platform + personalization” model: recognizable core products drive base volume, while accessories and new color/style drops lift unit economics without requiring a fully new footwear franchise each season.

💰 Revenue Streams & Monetisation Model

Revenue is primarily driven by footwear unit sales, with incremental contributions from accessories and related categories. Margin drivers tend to include:

  • Gross margin mix: footwear pricing and product/cost positioning, influenced by material choices and manufacturing/sourcing efficiencies.
  • Accessory attachment: charms/accessories typically offer higher contribution margin than the core footwear, supporting blended profitability when attachment rates rise.
  • Channel mix: DTC generally supports higher gross margin dollars than wholesale, while wholesale supports scale and reduces retail operational intensity.
  • Inventory and sell-through discipline: fashion/casual footwear economics are sensitive to demand forecasting; disciplined inventory management protects gross margin and reduces discount leakage.

While footwear sales are not recurring in a subscription sense, CROX’s personalization layer and product platform structure can create repeat purchase behavior across styles, seasons, and accessory refresh cycles.

🧠 Competitive Advantages & Market Positioning

CROX’s moats are best characterized as a consumer “platform + personalization” moat anchored by recognizable product design, attachment products, and operational scale in a globally sourced supply chain.

  • Intangible Assets (Brand/Design Recognition): Crocs’ distinctive silhouette and material identity support category standing and reduce marketing dependence versus less differentiated footwear.
  • Personalisation & Light Switching Friction: Branded charms and accessory ecosystems can raise switching costs in a practical sense—customers who invest in personalization are more likely to continue purchasing compatible variants.
  • Cost & Operating Scale: CROX benefits from scale sourcing, logistics know-how, and manufacturing relationships that support competitive product cost positioning.
  • Channel Leverage: The ability to flex between wholesale and DTC supports throughput and brand presentation, enabling better management of promotional intensity.

Competitive benchmarking (primary peers):

  • Skechers: broader comfort and performance categories with significant scale and marketing breadth; competition often centers on athletic-inspired comfort lines rather than CROX’s iconic clog platform.
  • Birkenstock: premium comfort and orthotic positioning; Birkenstock competes through a comfort/performance narrative and different product construction rather than CROX’s foam-based platform.
  • Nike / Adidas (and broader athletic brands): large ecosystems and direct-to-consumer strength; these peers emphasize performance and lifestyle franchises, creating demand headwinds for category share when consumer attention shifts to sport-led silhouettes.

CROX’s industry focus emphasizes iconic casual comfort + personalization rather than performance footwear engineering or premium orthotic specialization. This positioning has historically supported durable demand for a recognizable, differentiated silhouette while allowing product refresh without requiring an entirely new brand identity each cycle.

🚀 Multi-Year Growth Drivers

  • Global penetration of casual comfort footwear: ongoing global shift toward comfortable, versatile everyday footwear expands the addressable base beyond traditional clog buyers.
  • Platform expansion: iterative introductions around the core form (colors, styles, and seasonal variants) can broaden usage occasions without resetting the brand from scratch.
  • Accessory ecosystem scaling: increasing penetration of charms and related add-ons can lift blended margin and improve customer lifetime value.
  • International distribution growth: expanding wholesale relationships and DTC reach can extend category exposure in markets with lower base penetration.
  • Operational leverage: as scale increases, fixed-cost absorption and procurement/logistics efficiencies can support margin resilience through cycles.

⚠ Risk Factors to Monitor

  • Fashion/style cyclicality: casual footwear remains trend-sensitive; demand can shift away from specific silhouettes or color palettes, pressuring pricing and inventory.
  • Inventory and promotion risk: elevated inventory levels can lead to discounting, which can impair gross margin and brand positioning.
  • Competitive intensity: large comfort/lifestyle competitors may replicate product themes, increasing customer acquisition costs and limiting unit growth.
  • Channel execution: misalignment between wholesale orders and DTC demand can cause retailer destocking or excess inventory.
  • Input cost and sourcing disruptions: materials, logistics, and supplier capacity constraints can affect landed costs and lead times.
  • Reputation and compliance: footwear supply chain standards, labor practices, and sustainability expectations can create cost and operational risks if unmet.

📊 Valuation & Market View

Equity valuation for branded footwear typically reflects earnings power, gross margin trajectory, and the quality of working capital more than purely revenue growth. Market participants often anchor on multiples such as EV/EBITDA and/or P/S for growth profiles, with valuation sensitivity driven by:

  • Sustainable gross margin: mix shift, accessory contribution, and discount control.
  • Operating leverage: fulfillment, distribution, and overhead discipline as sales scale.
  • Inventory turns and cash conversion: strong sell-through and reduced markdown exposure support higher multiple durability.
  • Channel mix durability: maintaining DTC economics without destabilizing wholesale partners.

A stable valuation case generally requires evidence of resilient sell-through, continued product platform relevance, and accessory ecosystem scaling without disproportionate promotional intensity.

🔍 Investment Takeaway

CROX is positioned to compound through a platform-led growth model supported by an iconic product identity and a personalization accessory ecosystem that creates practical customer stickiness. The key debate for long-term investors centers on maintaining demand relevance while executing disciplined inventory and channel management. When those operational elements align, CROX’s mix of branded differentiation, scale advantages, and accessory-led margin support can sustain attractive long-run value creation.


⚠ AI-generated — informational only. Validate using filings before investing.

📰 Market News & Coverage

15 Stories Available

Real-time institutional reporting and market updates for CROX.

seekingalpha.com2026-08-01

Crocs, Inc. (CROX) Q2 2026 Earnings Call Transcript

Crocs, Inc. (CROX) Q2 2026 Earnings Call Transcript

zacks.com2026-07-30

Crocs' Q2 Earnings Beat Estimates on DTC Growth, 2026 View Raised

CROX tops Q2 estimates as DTC and international demand lift sales, pushing Crocs past $1 billion in quarterly revenues.

wsj.com2026-07-30

Crocs Steps Up Outlook, But With Dim Near-Term View

The footwear maker raised its sales and profit outlook for the full year, but expectations for the current quarter missed Wall Street targets. Shares fell.

proactiveinvestors.com2026-07-30

Crocs shares slide as weak outlook draws focus from earnings beat

Crocs, Inc. (NASDAQ:CROX) shares fell almost 10% on Thursday after the footwear company issued a weaker-than-expected third quarter outlook, as tariff pressures and continued weakness at its HEYDUDE brand weighed on sentiment, despite a second-quarter earnings and revenue beat. The company forecast Q3 adjusted earnings per share of $3.20 to $3.30 on roughly flat revenue, below Wall Street expectations for adjusted EPS of around $3.53 to $3.55 and revenue of about $1 billion.

zacks.com2026-07-30

Here's What Key Metrics Tell Us About Crocs (CROX) Q2 Earnings

While the top- and bottom-line numbers for Crocs (CROX) give a sense of how the business performed in the quarter ended June 2026, it could be worth looking at how some of its key metrics compare to Wall Street estimates and year-ago values.

marketbeat.com2026-07-30

Crocs Q2 Earnings Call Highlights

Crocs NASDAQ: CROX reported record second-quarter revenue of $1.2 billion for 2026, up 2% from a year earlier on a constant-currency basis, as direct-to-consumer demand and international growth helped offset planned wholesale declines. The company raised its full-year revenue and adjusted earnings outlook while expanding its share-repurchase authorization.

zacks.com2026-07-30

Crocs (CROX) Surpasses Q2 Earnings and Revenue Estimates

Crocs (CROX) came out with quarterly earnings of $4.55 per share, beating the Zacks Consensus Estimate of $4.32 per share. This compares to earnings of $4.23 per share a year ago.

proactiveinvestors.com2026-07-30

Crocs shares slide as weak outlook draws focus from earnings beat

Crocs, Inc. (NASDAQ:CROX) shares fell almost 10% on Thursday after the footwear company issued a weaker-than-expected third quarter outlook, as tariff...

prnewswire.com2026-07-30

Crocs, Inc. Reports Record Second Quarter 2026 Results; Raises Full-Year 2026 Outlook

Full-Year 2026 Outlook Raised On Both The Top- And Bottom-Line Crocs Brand Surpasses $1 Billion In Quarterly Revenue For The First Time Share Repurchase Authorization Increased By $1.5 Billion To Approximately $2 Billion BROOMFIELD, Colo., July 30, 2026 /PRNewswire/ -- Crocs, Inc. (NASDAQ: CROX), a world leader in innovative casual footwear for all, today announced its second quarter 2026 financial results.

defenseworld.net2026-07-29

Crocs, Inc. $CROX Shares Sold by Dimensional Fund Advisors LP

Dimensional Fund Advisors LP trimmed its holdings in shares of Crocs, Inc. (NASDAQ: CROX) by 1.8% during the first quarter, according to the company in its most recent Form 13F filing with the SEC. The fund owned 1,420,996 shares of the textile maker's stock after selling 26,100 shares during the quarter. Dimensional Fund

zacks.com2026-07-27

Crocs (CROX) Q2 Earnings on the Horizon: Analysts' Insights on Key Performance Measures

Evaluate the expected performance of Crocs (CROX) for the quarter ended June 2026, looking beyond the conventional Wall Street top-and-bottom-line estimates and examining some of its key metrics for better insight.

seekingalpha.com2026-07-25

Crocs: Sound Company But Close To Fair Value

Crocs is fairly valued at $125, with stable operations, high gross margins, and international expansion driving future growth potential. International sales are projected to be strong given the growth from 41% (2023) to 48.6% (2025), with further gains expected as DTC and store openings accelerate in key markets. HEYDUDE remains a turnaround priority, with revenue declines of 5–7% expected this year and stabilization targeted before 2027.

zacks.com2026-07-24

Crocs (CROX) Exceeds Market Returns: Some Facts to Consider

The latest trading day saw Crocs (CROX) settling at $134.66, representing a +1.65% change from its previous close.

zacks.com2026-07-24

How to Play Crocs Stock After a 28.1% Increase in 3 Months?

CROX stock benefits from strong technical momentum, but investors are balancing international growth opportunities against tariff, margin and brand headwinds.

zacks.com2026-07-24

Crocs' Q2 Earnings Coming Up: What Surprise Awaits Investors?

CROX's brand strength, DTC growth and international momentum may support Q2, but HEYDUDE weakness and tariff pressures remain key watchpoints.

📊 AI Financial Analysis

Powered by StockMarketInfo
Earnings Data: Q Ending 2026-06-30

"CROX reported Q2’26 revenue of $1.18B and net income of $205M (EPS $4.15). QoQ, revenue rose from $921.5M in Q1’26 (+28.0%) and net income increased from $137.6M (+48.9%). YoY, revenue declined from $1.149B in Q2’25 (-2.6%), while net income swung from a loss of -$492.3M to +$204.9M (turnaround; +141.6% YoY). Profitability improved across both horizons. Gross margin was 59.4% in Q2’26 vs 56.8% in Q1’26 (+2.6pp QoQ) but below 61.7% in Q2’25 (-2.3pp YoY). Operating margin improved to 24.2% in Q2’26 from 21.8% in Q1’26 (+2.3pp QoQ) and from a negative profitability profile in Q2’25 (operating margin 27.0% but with severe net loss). Net margin was 17.4% in Q2’26 vs 14.9% QoQ (+2.5pp). Cash flow quality is strong: operating cash flow was $324M, lifting free cash flow to $303M. Balance sheet resilience appears solid with total equity of $1.38B and net debt of ~$211M, though cash decreased vs Q1’26 (from $130.9M to $170.3M actually increased) and leverage is far lower than prior quarters’ equity structure issues. Shareholder returns look positive: the stock is up +19.4% over 1Y (capital appreciation), with no dividend payments reported; the company did repurchase shares (Q2’26 buybacks of ~$254M), supporting total return."

Revenue Growth

Neutral

QoQ revenue grew +28.0% (Q2’26 vs Q1’26) but YoY revenue declined -2.6% (Q2’26 vs Q2’25), indicating lumpy demand/seasonality rather than steady top-line acceleration.

Profitability

Good

Net income improved sharply QoQ (+48.9%) and YoY (loss to profit). Margins expanded QoQ: gross margin +2.6pp and operating margin +2.3pp; YoY gross margin contracted -2.3pp.

Cash Flow Quality

Positive

Operating cash flow was $324M with free cash flow of $303M in Q2’26. Share repurchases were meaningful; no dividends were paid, so cash return is primarily via buybacks.

Leverage & Balance Sheet

Positive

Total assets were $4.36B with equity of $1.38B in Q2’26. Net debt remains manageable (~$211M). Liquidity improved vs Q1’26 with cash rising to $170M.

Shareholder Returns

Positive

Total value creation is supported by price momentum (+19.4% 1Y; below the >20% threshold) and substantial buybacks (~$254M in Q2’26). Dividend yield is 0% (no dividends reported).

Analyst Sentiment & Valuation

Neutral

Consensus target ($131.44) implies upside vs the cited price ($105.87), but valuation multiples appear demanding (P/E ~7.3; EV multiple high per provided ratios), suggesting sentiment is constructive but not deeply mispriced.

Disclaimer:This analysis is AI-generated for informational purposes only. Accuracy is not guaranteed and this does not constitute financial advice.

Fundamentals Overview

Loading fundamentals overview...

So What? CROX delivered a “better-than-expected” Q1 despite constant-currency enterprise revenue down 4%, driven by DTC resilience (Crocs DTC +11%, HEYDUDE DTC +8%) and strong inventory discipline (units down high single digits; turns up >4x). The core margin story is pressure from tariffs and product mix: enterprise adjusted gross margin fell 90 bps, including 100 bps incremental tariff impact, while new product mix carried slightly lower margins. HEYDUDE’s revenue is still down materially (−13%), but management used stronger-than-expected Q1 to raise HEYDUDE full-year revenue guidance improvement (to −5% to −7%) and lift FY adjusted EPS to $13.20–$13.75. The key forward pivot is second-half confidence anchored in brand/platform newness across clogs, sandals, and personalization plus anniversarying last year’s promotion and paid-search pullbacks. Main risks remain tariff volatility, $120 oil-driven freight/transportation costs, and uncertain Middle East macro spillover—refund upside not embedded.

AI IconGrowth Catalysts

  • Crocs clog franchise reintroduction and performance: Crocband reintroduced with strength across channels, colors, and iterations; Crafted scaling with canvas and floral embroidery uppers; Echo franchise scaled via new Echo RO colorways and expanded distribution
  • Crocs product newness and category expansion: sandal momentum including personalizable 2-strap Saturday Sandal; Classic Ballet flat global sellout leading to replenishment/supply chase
  • HEYDUDE DTC outperformance with lower marketing spend: growth from Wally & Wendy leadership in slip-ons, Stretch Jersey franchise ("T-shirt for your feet") and continued momentum in Stretch Sox platform
  • Collaborations driving sell-through and engagement: LEGO Brick clog (multiyear partnership launched Feb; best-performing on social; drove digital traffic) and LoveShackFancy collaboration (sold out completely); Disney Mickey Mouse personalization on bags/accessories
  • International demand pull from brand relevance and personalization: China Super Brand Day on Douyin with celebrity live streaming; Let Them Talk campaign in India featuring Echo RO for KL Rahul; Tokyo retail personalization strength in Japan; Western Europe growth led by digital marketplace performance

Business Development

  • LEGO multiyear partnership launched in February via LEGO Brick clog
  • RealShorts micro-drama mini-series launch: Charmed To Meet You (over 10 million views)
  • Social commerce/marketplace achievements and expansions: TikTok Shop Top Seller of the Year (Crocs, 2025); HEYDUDE Top Growth Seller of the Year on TikTok Shop; scaled TikTok Shop in U.K. and Malaysia with planned Japan launch to make Crocs first major footwear brand on platform
  • Regional channel/footprint shift: converted Malaysia distributor business to directly owned/operated on April 1, absorbing 21 retail stores
  • HEYDUDE collaboration set: Houston Rodeo (3rd consecutive year retail presence); collaborations with Chevy, Jelly Roll, and Naruto

AI IconFinancial Highlights

  • Enterprise revenue: $921 million, down 2% YoY reported (down 4% constant currency) but "better-than-expected" and slightly ahead on top and bottom line
  • Brand revenue performance: Crocs down 2% to $767 million; HEYDUDE down 13% to $154 million; DTC growth offset planned wholesale declines
  • Direct-to-consumer growth: Crocs DTC up 11% (despite pulling back promotional activity); HEYDUDE DTC up 8% (with lower performance marketing spend)
  • Wholesale channel: HEYDUDE wholesale down 26%; Crocs North America wholesale declined (offsets DTC up 5%)
  • Gross margin: Enterprise adjusted gross margin 56.9%, down 90 bps YoY, driven by 100 bps incremental tariff impact and product mix offset by brand mix
  • Brand margin: Crocs adjusted gross margin 59.5% (down 120 bps); HEYDUDE adjusted gross margin 44.5% (down 210 bps)
  • Operating margin: Adjusted operating margin 22.3%, down 150 bps YoY (excluding $5 million specific costs for cost-savings initiative implementation)
  • EPS: Adjusted diluted EPS $2.99, ahead of expectations and flat YoY; non-GAAP effective tax rate 18%
  • Inventory/efficiency: total footwear units down high single digits; inventory turns up more than 4x; enterprise inventory turns above annualized 4x; inventory balance $398 million, up 2% YoY including higher tariffs impact
  • Cash flow/capital return: quarter-end cash $131 million; revolver borrowing capacity over $800 million; net leverage at low end of 1.0x–1.5x; repurchased 800,000 shares for $74 million quarter-to-date with $747 million remaining on authorization
  • FY2026 guidance (updated): enterprise revenue up 1% to down 1% reported (currency rates as of April 27); Crocs revenue flat to up 2%; HEYDUDE revenue down ~5% to 7% (improved from prior down 7% to 9%); adjusted operating margin expected to expand modestly from FY2025 22.3% level (excluding ~$25 million nonrecurring costs); adjusted diluted EPS raised to $13.20–$13.75

AI IconCapital Funding

  • Share repurchase progress: second-quarter repurchases underway; bought back 800,000 shares for $74 million quarter-to-date
  • Remaining buyback authorization: $747 million remaining as of quarter end
  • Balance sheet liquidity: $131 million cash and cash equivalents; over $800 million of revolver borrowing capacity
  • Leverage: net leverage at low end of 1.0x–1.5x target range

AI IconStrategy & Ops

  • Inventory management and channel optimization: total footwear units down high single digits; inventory turning up more than 4x; ongoing tight inventory control and segmentation across key partners in North America (Crocs Classics)
  • Marketing and promotions discipline: Crocs promotional activity pulled back yet DTC still up 11%; HEYDUDE outperformance delivered with significant reduction in performance marketing spend
  • Cost structure initiatives: adjusted SG&A dollars flat YoY aided by partial benefit from 2025 and 2026 cost savings; adjusted operating margin down 150 bps due to gross margin pressures (tariffs/product mix) despite expense stability
  • Supply chain/offense posture: referenced always-on offense to seek supply chain efficiencies that can drop to bottom line or reinvest
  • Retail network: opened ~40 mono-brand stores in kiosks in the quarter (including 6 owned and operated internationally)
  • International distribution model change: Malaysia converted to owned/operated April 1; absorbed 21 retail stores

AI IconMarket Outlook

  • Q2 2026 guidance: revenues down slightly at currency rates as of April 27; Crocs brand up 1% to 3%; HEYDUDE down 12% to 14%
  • Q2 adjusted operating margin: ~24.7%, embedding adjusted gross margin down ~150 bps YoY driven by tariffs
  • Q2 adjusted diluted EPS: $4.15 to $4.35
  • FY2026 guidance: enterprise revenue up 1% to down 1% reported (as of April 27 currency); adjusted diluted EPS $13.20–$13.75
  • Tariff/refund policy stance: February Supreme Court rulings on tariff refunds—company has not embedded any upside from refunds in guidance

AI IconRisks & Headwinds

  • Middle East conflict: unanticipated impact affecting Crocs via (1) revenue reduction from Middle East distributor business (contemplated in annual guidance), (2) increased raw material and transportation costs due to elevated oil prices, and (3) possible broader macro slowdown risk though not seen in consumer behavior
  • Tariff impacts: enterprise adjusted gross margin down 90 bps YoY with 100 bps incremental tariff impact in Q1; Q2 embeds adjusted gross margin down ~150 bps YoY driven by tariffs
  • Margin headwinds from new product mix: select new products carry slightly lower product margins; Q1 margin downside partially attributed to new product mix vs plan
  • Wholesale channel pressures: continued planned wholesale declines as inventory optimized for long-term profitable growth; wholesale sellouts improved sequentially but still below aspirations
  • Macro/consumer confidence sensitivity to sustained $120 oil: management indicated risk but currently no discernible trend in consumer behavior

Q&A: Analyst Interest

  • Sell-through and DTC durability: Jonathan asked for Crocs North America sell-through trends across channels and whether momentum risks slowing past core sandal season. Management attributed strength to broad-based newness across sandals, clogs, and other silhouettes, plus improved DTC execution and Gen Z-focused storytelling; confidence remains despite global headwinds.
  • Second-half confidence and margin drivers: Jonathan asked Patraic to explain confidence in second-half revenue and profitability ramp. Patraic cited diversification via the 5 Crocs and 3 HEYDUDE strategic pillars delivering product newness (green shoots in Q4/Q1) and a tailwind from lapping painful 2H actions in 2025 (promotions, paid search, and inventory reductions).
  • Tariff cost embedding and inventory posture: Adrienne asked what tariff level remains embedded (given 10% statutory collection) and whether inventory/order-book dynamics changed. Management said wholesale customers are being prudent and brands are supporting at-once inventory for reorders driven by newness; tariffs are managed via a blended rate in Q2 and treated more like a base in 2H.

Sentiment: MIXED

Note: This summary was synthesized by AI from the CROX Q1 2026 earnings transcript. Financial data is complex; please verify all metrics against official SEC filings before making investment decisions.

📋 Official Regulatory 10-K / 10-Q SEC Filings

Direct authenticated documentation links to audited SEC database reports for CROX.

SEC EDGAR Live Feed
Loading financial data and tables...
📁

SEC Filings (CROX)

© 2026 Stock Market Info — Crocs, Inc. (CROX) Financial Profile