Denny's Corporation

Denny's Corporation (DENN) Market Cap

Denny's Corporation has a market capitalization of $321.9M.

Price: $6.25

-0.01 (-0.16%)

Market Cap: 321.87M

NASDAQ · time unavailable

CEO: Kelli F. Valade

Sector: Consumer Cyclical

Industry: Restaurants

IPO Date: 1998-01-08

Website: https://www.dennys.com

Denny's Corporation (DENN) - Company Information

Market Cap: 321.87M|Sector: Consumer Cyclical

Company Profile

Denny's Corporation, primarily through its subsidiary Denny's, Inc., operates and owns a chain of full-service eateries under the renowned Denny's brand. As of December 29, 2021, its worldwide portfolio included 1,640 locations, a mix of franchised, licensed, and company-owned establishments. Established in 1953, the company is based in Spartanburg, South Carolina, and officially became Denny's Corporation in 2002, having previously been known as Advantica Restaurant Group, Inc.

Analyst Sentiment

50%
Hold

From 5 Active Polls

1Y Forecast: $7.00

▲ +12.0% Potential Upside

Consensus Target Metrics

Low Bound

$4

Median

$6

High Bound

$14

Average

$7

Price & Moving Averages

Loading chart...

🎯 Wall Street Analyst Intelligence Report

1-Year structural target targets, chart projections, and sentiment maps.

Average 1Y Target
$7.00
▲ +12.00% Upside
Low Target
$4.00
-36% Risk
Median Target
$6.00
-4% Mid
High Target
$13.50
116% Max
Consensus
Buy
12 / 21 Buys

Consensus Trend Projection

Trailing closures vs. 12-month metrics map.

Analyst Vote Distribution

Aggregate institutional coverage sentiment weights.

📊 Historical Valuation Multiples

Real-time Trailing Twelve Month (TTM) momentum side-by-side with discrete quarterly metrics.

Fiscal QuarterTTMQ3 2025Q2 2025Q1 2025Q4 2024Q3 2024Q2 2024Q1 2024Q4 2023
Period EndingTrailing 12MSep 24, 2025Jun 25, 2025Mar 26, 2025Dec 31, 2024Sep 25, 2024Jun 26, 2024Mar 27, 2024Dec 31, 2023
Market Cap ($M)322339212198315336364481584
Enterprise Value ($M)736754629613722739752878974
Price to Earnings Ratio (P/E)98.27134.2521.52152.8211.6312.4024.6425.1754.40
Price/Earnings-to-Growth Ratio (PEG)3.994.464.5553.09
Price to Sales Ratio (P/S)0.943.001.811.782.753.013.144.375.06
Price to Book Ratio (P/B)-12.08-10.38-6.14-5.45-9.26-6.17-6.83-8.63-9.31
Price to Free Cash Flow Ratio (P/FCF)68.5850.59102.71-48.56-135.93-277.7539.78-102.5234.58
Enterprise Value to Sales (EV/Sales)6.655.345.496.296.626.497.988.44
Enterprise Value to EBITDA (EV/EBITDA)21.5864.4647.3866.9337.1742.8153.0857.1372.15
Debt to Equity Ratio12.14-12.74-12.07-11.41-12.00-7.42-7.32-7.15-6.31

📘 Full Research Report

ℹ️

AI-Generated Research: This report is for informational purposes only.

📘 DENNYS CORP (DENN) — Investment Overview

🧩 Business Model Overview

Denny’s operates a portfolio of full-service, casual dining restaurants through a mix of company-owned units and franchised locations. The economic engine is straightforward: Denny’s sells food and beverages to dine-in and off-premise customers, while it also monetizes franchising through franchise-related fees (and typically ongoing royalties/related charges) that are tied to franchisee sales performance. Operating leverage tends to flow from disciplined labor and food-cost management, menu and traffic-driving execution, and the ability to expand units (or remodel existing ones) without proportionally expanding fixed corporate overhead.

Franchising is a key structural feature: it shifts a portion of unit-level capital requirements and operating execution risk from the corporate balance sheet to franchise partners, while still allowing Denny’s to participate in category demand through fee streams linked to restaurant throughput.

💰 Revenue Streams & Monetisation Model

Revenue is predominantly transactional at the restaurant level (sales generated by customers purchasing meals). The monetisation model includes:

  • Company-owned restaurant sales: generate revenue directly but require ongoing capital and operational execution (labor, food, maintenance, and restaurant-level improvements).
  • Franchise-related revenue: typically includes upfront franchise fees and ongoing fees/royalties that scale with franchisee performance, generally creating a more asset-light profit profile.

Margin drivers are primarily operational rather than pricing power:

  • Labor efficiency: scheduling discipline, productivity, and wage-cost management.
  • Food and beverage input costs: procurement strategy, menu engineering, and supplier mix.
  • Restaurant-level throughput: traffic and average ticket, influenced by promotional intensity and local competitive conditions.
  • Unit economics: lease/occupancy terms, maintenance and remodel cycles, and operating cost inflation absorption.

🧠 Competitive Advantages & Market Positioning

Denny’s operates in a mature, highly competitive environment where true switching costs do not exist for consumers. The relevant “moat” is therefore operational and structural—centered on scale efficiencies, standardized restaurant systems, and an asset-light growth lever via franchising.

  • Scale and procurement leverage (Cost Advantage): Centralized supply chain relationships and standardized menu/operating practices can help normalize input costs versus smaller operators, supporting gross margin resilience when commodity and labor conditions tighten.
  • Franchising as a capital-allocation moat (Asset-Light Growth): Compared with fully company-owned models, franchising reduces incremental corporate capital needs and can stabilize earnings by shifting unit-level execution and investment burden to franchisees.
  • Operating playbook and training systems (Intangible Execution Capability): Consistent operational standards, training, and promotion/brand execution mechanisms can improve throughput and reduce variation in unit performance.

Competitive benchmarking (industry peers):

  • IHOP (International House of Pancakes): competes for breakfast and family dining occasions with a different marketing cadence and menu emphasis.
  • Applebee’s: targets similar casual dining demand with a broader bar/entertainment positioning and extensive promotional activity.
  • Cracker Barrel: emphasizes a distinctive dining-and-retail experience; its differentiation can support more durable unit performance in certain geographies.

Denny’s positions as a value-oriented, high-availability casual dining brand, with competitive focus on operational execution and unit economics rather than premium differentiation. That approach matters because category outcomes often hinge on cost discipline and the ability to maintain throughput through promotional cycles.

🚀 Multi-Year Growth Drivers

Over a 5–10 year horizon, growth is most likely to come from improving restaurant-level performance and selectively scaling units rather than from broad category disruption. Key drivers include:

  • Traffic stabilization and throughput improvement: menu engineering, consistency in execution, and effective promotional targeting that supports sales per available seat.
  • Remodeling and format optimization: incremental unit improvements that can lift customer experience and operational efficiency, supporting productivity and brand relevance.
  • Franchise expansion: growing the franchise footprint can increase fee revenue and reduce corporate capital intensity while maintaining participation in demand growth.
  • Digital and off-premise enablement: improving order convenience (delivery/takeout/digital ordering) can broaden reachable demand, particularly in markets where delivery platforms and off-premise consumption are structurally important.
  • Real estate and market selection: prioritizing locations with favorable demographics and durable demand can support long-run unit economics.

⚠ Risk Factors to Monitor

  • Labor and food-cost inflation: restaurants are operationally sensitive; cost increases without corresponding demand support can compress margins.
  • Consumer spending cyclicality: discretionary dining can soften during periods of economic stress, pressuring traffic and average check.
  • Competitive promotional intensity: peers may increase promotional spending, creating margin pressure and making sales gains harder to monetize.
  • Franchisee credit risk: a recessionary environment can strain franchisees, impacting fee collectability and potentially requiring corporate support or structural remediation.
  • Lease and real estate constraints: unfavorable lease terms, maintenance obligations, and impairment risk can affect earnings power for underperforming units.
  • Execution risk in digital/off-premise: logistics, platform fees, and service reliability can erode profitability if not managed tightly.

📊 Valuation & Market View

Markets typically value restaurant operators using EV/EBITDA and earnings power rather than long-duration growth multiples, because the business is ultimately tied to unit economics and operating cash flows. The valuation framework is highly sensitive to:

  • Same-restaurant performance: throughput trends and margin stability.
  • Company-owned versus franchised mix: fee revenue can be less capital intensive, improving resilience.
  • Operating cost trendlines: labor, food, occupancy, and promotional intensity.
  • Unit growth quality: the ability to open/convert/mature units with acceptable payback periods and manageable remodel costs.

Key “needle movers” are therefore less about abstract brand sentiment and more about demonstrable operating discipline and sustainable economics across the unit base.

🔍 Investment Takeaway

Denny’s long-term investment case centers on improving and sustaining restaurant-level profitability through operational execution, leveraging scale-based cost efficiencies, and using franchising to expand with lower incremental corporate capital requirements. With switching costs inherently low in casual dining, the durability of returns depends on how reliably management can maintain margins through cost cycles, defend throughput amid promotional competition, and allocate capital to the highest-quality unit opportunities.


⚠ AI-generated — informational only. Validate using filings before investing.
📰 Market News & Coverage

15 Stories Available

Real-time institutional reporting and market updates for DENN.

globenewswire.com2026-06-24

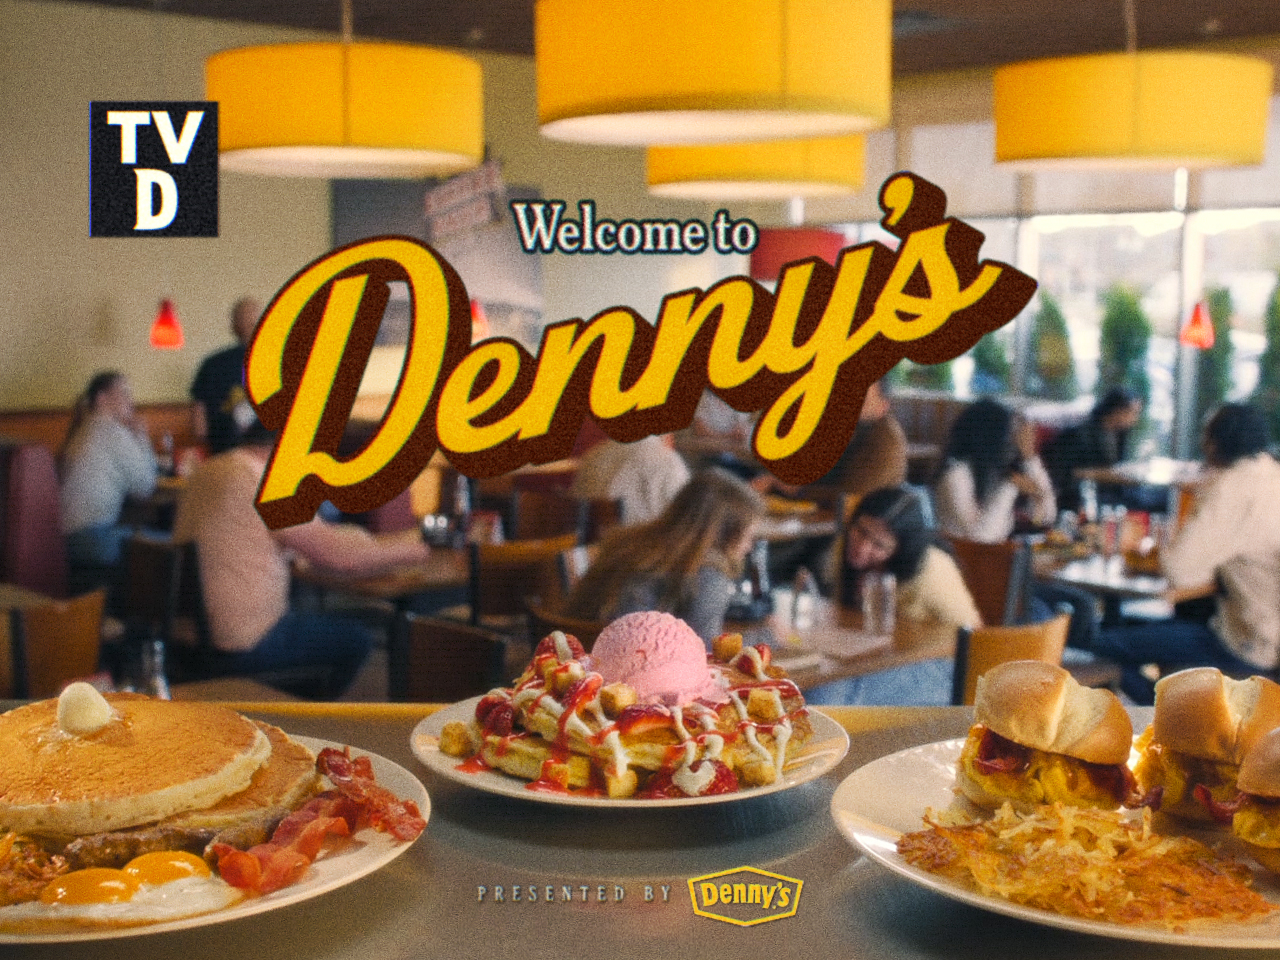
Denny's Unveils New Brand Evolution And Creative Campaign Drawing Inspiration From Classic Sitcoms

Denny's unveils a new brand evolution and sitcom-inspired campaign, inviting guests to the booth with nostalgia, new menu items, and a refreshed look.

globenewswire.com2026-06-15

Denny's Officially Declares The Clock's Off and the Kitchen is Open

SPARTANBURG, S.C., June 15, 2026 (GLOBE NEWSWIRE) -- Denny's is breaking all the rules this summer with the launch of The Clock's Off Menu on June 24, a new lineup that brings together breakfast, lunch and dinner favorites – all available any time of day across its restaurants nationwide.

globenewswire.com2026-06-10

Denny's Canada and Saskatchewan Roughrider Foundation Reunite for 2026 Riders Slam Campaign

Beloved breakfast special returns to support youth literacy across the province, with next Riders Slam Day set for June 12 Beloved breakfast special returns to support youth literacy across the province, with next Riders Slam Day set for June 12

globenewswire.com2026-05-27

Denny's Awards $85,000 in Scholarships to Students Driving Change in Their Communities

Denny's awards $85K in scholarships to 34 students through Hungry for Education™, honoring young leaders driving real change in their communities.

globenewswire.com2026-05-11

Denny's Brings Canada's Modern Diner to St. Albert with New Jensen Lakes Restaurant

First St. Albert location marks another milestone in Denny's growing Alberta presence First St. Albert location marks another milestone in Denny's growing Alberta presence

globenewswire.com2026-04-27

Mosh Pit to Mozz Pit: Denny's Launches All-New Mozz Pit Burger

SPARTANBURG, S.C., April 27, 2026 (GLOBE NEWSWIRE) -- Denny's most viral video of all time became internet history by asking one loud question (IYKYK).

globenewswire.com2026-04-23

Denny's Launches Nationwide Fundraising Campaign for Cookies for Kids' Cancer

SPARTANBURG, S.C., April 23, 2026 (GLOBE NEWSWIRE) -- Denny's has launched its Cookies for Kids' Cancer (CFKC) annual fundraising campaign, continuing its 17-year commitment to helping advance research for safer, more effective pediatric cancer treatments.

globenewswire.com2026-04-21

Denny's Battle Cat-Themed Masters of the Universe™ Mobile Diner Roars Across America

Snap and share a picture of the custom-wrapped truck for the chance to win diner deals on Denny's all-new, limited-time menu inspired by Masters of the Universe LINK TO ASSETS SPARTANBURG, S.C., April 21, 2026 (GLOBE NEWSWIRE) -- Denny's is ROAR-ing cross-country with a custom-wrapped Masters of the Universe™ Mobile Diner, created in partnership with Mattel, Inc. and Amazon MGM Studios.

globenewswire.com2026-04-15

Order Like a Legend! Denny's Joins Forces With Masters of the Universe™ for Epic Flavor and Value

Denny's joins forces with "Masters of the Universe" for epic flavor and value, plus the chance to win a hero's journey to the movie's Hollywood premiere.

globenewswire.com2026-04-13

Denny's Names Christopher Bode President and Chief Executive Officer

SPARTANBURG, S.C., April 13, 2026 (GLOBE NEWSWIRE) -- Denny's, America's Diner, announced today Christopher Bode as its new President and Chief Executive Officer.

globenewswire.com2026-04-01

Denny's Canada is excited to welcome guests to its newest Calgary location in Cornerstone

Canada's Modern Diner continues to grow across Alberta with a brand-new restaurant opening in one of Calgary's newest communities Canada's Modern Diner continues to grow across Alberta with a brand-new restaurant opening in one of Calgary's newest communities

youtube.com2026-02-24

Did you know Nvidia was founded in a Denny's?

Before Nvidia was worth trillions, it almost folded in 1995

globenewswire.com2026-02-19

Syrup-Soaked Spring Break: Snag the Denny's Spring Break Pass for Free Eats

SPARTANBURG, S.C., Feb. 19, 2026 (GLOBE NEWSWIRE) -- This Spring Break, Denny's is serving up a must-pack accessory – the Denny's Spring Break Pass.

globenewswire.com2026-02-17

Denny's Raises $950K to Fight Childhood Hunger with No Kid Hungry

Denny's celebrates 15 years of partnership with No Kid Hungry, including matching donations on Giving Tuesday in 2025 SPARTANBURG, S.C., Feb. 17, 2026 (GLOBE NEWSWIRE) -- For 15 years, Denny's has been proud to partner with No Kid Hungry, helping to ensure children have access to the meals they need to grow and thrive.

defenseworld.net2026-01-27

Denny’s (NASDAQ:DENN) Share Price Crosses Above Two Hundred Day Moving Average – What’s Next?

Denny's Corporation (NASDAQ: DENN - Get Free Report)'s stock price passed above its two hundred day moving average during trading on Monday. The stock has a two hundred day moving average of $5.25 and traded as high as $6.26. Denny's shares last traded at $6.2450, with a volume of 4,056,515 shares trading hands. Analyst Upgrades

📊 AI Financial Analysis

Powered by StockMarketInfo
Earnings Data: Q Ending 2025-09-24

"DENN reported revenue of $113.2M and a net income of $632k for the most recent quarter ending September 24, 2025. With a negative total equity of $32.7M and total liabilities exceeding total assets, the company is currently in a financially leveraged position, raising concerns about its stability. Operating cash flow is positive at $15.97M, and free cash flow is also positive at $6.71M, indicating some operational efficiency in generating cash. However, there are no dividends paid to shareholders, limiting direct returns. Given the current market performance and lack of significant price change data, the overall valuation sentiment is uncertain. The absence of market capitalization data further complicates the analysis, as does the company's inability to project dividends or substantial shareholder returns in the near term. Overall, while revenue growth shows promise, profitability and balance sheet issues bring caution for investors."

Revenue Growth

Neutral

Revenue of $113.2M indicates growth, but further context on trends is needed.

Profitability

Caution

Positive net income but insufficient to suggest strong profitability.

Cash Flow Quality

Neutral

Positive operating and free cash flow support operational efficiency.

Leverage & Balance Sheet

Neutral

Negative equity and high debt levels indicate significant financial risk.

Shareholder Returns

Neutral

No dividends paid, limited direct returns to shareholders.

Analyst Sentiment & Valuation

Caution

Ambiguous market sentiment and lack of price change data affect valuation confidence.

Disclaimer:This analysis is AI-generated for informational purposes only. Accuracy is not guaranteed and this does not constitute financial advice.

Fundamentals Overview

Loading fundamentals overview...

Management’s tone is cautiously constructive: Kelli and Robert emphasize traffic levers (BOGO and “4 Slams under $10”), strong off-premise performance, and a loyalty CRM program expected to add +50 to +100 bps traffic. They acknowledge demand is “very choppy” and attribute the Q2 comp softness to macro pressure concentrated in their top DMAs, estimating a ~30 bps drag versus a ~40 bps tailwind in Q1. The financials show why analysts should stay skeptical: adjusted company restaurant operating margin fell to 11.5% largely from +80 bps product costs plus temporary headwinds of ~115 bps legal/medical reserves and ~100 bps new-cafe inefficiencies; adjusted EPS was only $0.09 and the tax rate jumped to 34.3%. In the Q&A, however, pressure is visible—management refused to quote July comps but said they’re ~-2.2% YTD and need ~+0.5 point improvement to land the low end of guidance, relying on value messaging, remodel momentum, and near-term CRM launch readiness.

AI IconGrowth Catalysts

  • Denny’s value promotions driving traffic and repeat visits: Mar BOGO Slam for $1 (Original Grand Slam + All-American Slam); June “4 Slams under $10” (Red, White and Berry Everyday Value Slam; Choconana Everyday Value Slam; Super Slam; Everyday Value Slam)
  • BOGO/Slam-led new and lapsed user reactivation: >15% of new/lapsed users during BOGO had returned (some multiple visits)
  • Off-premise strength: off-premise sales contributed +1.5% to Q2 same-restaurant sales; digital investments improving online sales and conversion
  • New points-based loyalty program (back half of 2025) expected to deliver +50 to +100 bps traffic over time via first-party data + personalized CRM

Business Development

  • Virtual brand partnership with Franklin Junction selling Nathan’s Famous hot dogs; rolled out in >70% of company restaurants; in Q2 improved company same-restaurant sales by ~+50 bps
  • Keke’s development: opened 8 new cafes in Q2 (4 company-owned) including reopening 2 previously closed franchise cafes under new image/new ownership
  • Keke’s refranchised 3 company cafes in Northern Florida; expects 2 more in near term

AI IconFinancial Highlights

  • Denny’s system-wide same-restaurant sales: -1.3% in Q2; +170 bps sequential improvement from Q1
  • Top 4 DMAs concentration impact: LA, San Francisco, Houston, Phoenix ~30% of comp sales base; macro pressure reduced system-wide same-restaurant sales by ~30 bps in Q2 (historically contributed ~+40 bps in Q1)
  • Off-premise contribution: +1.5% improvement to same-restaurant sales in Q2; off-premise represents 21% of total sales; benefited system same-restaurant sales by ~+150 bps
  • Value mix: “incidents just over 20%”; LTO value via slams; traffic offset discount (margin positive per management)
  • Denny’s company same-restaurant sales: flat in Q2; attributed to controllable investments (server tablets, remodels, higher guest satisfaction)
  • Keke’s system-wide same-restaurant sales: +4% in Q2; outperformed BBI Family Dining Index in Florida for fourth consecutive quarter; company comps sequentially improved by ~+300 bps
  • Keke’s check increased ~6% (pricing, menu trades, higher beverage incidents, off-premise growth)
  • Q2 revenues: total operating revenue $117.7M vs $115.9M prior year quarter
  • Adjusted franchise operating margin: $30.0M (50.7% of franchise & license revenue) vs $30.8M (50.0%) prior year quarter; driven by fewer equivalent units and softer Denny’s same-restaurant sales
  • Adjusted company restaurant operating margin: $6.7M (11.5%) vs $13.7M (12.9%); product cost +80 bps; commodity prices held steady ~5%
  • Company margin headwinds included: ~115 bps legal/medical reserve adjustments + ~100 bps new cafe opening inefficiencies/oversight
  • Absent temporary ramp + reserves + normalized commodities: adjusted company margins would have been ~14%
  • Q2 effective income tax rate: 34.3% vs 25.1% prior year quarter (discrete items relating to share-based compensation)
  • Adjusted EPS: $0.09

AI IconCapital Funding

  • Total debt outstanding: ~$279M; ~$269M drawn under credit facility
  • Refinancing process underway; completion expected prior to Q3 earnings call
  • Share repurchases: intend to resume in Q4; guidance to repurchase $15M to $25M

AI IconStrategy & Ops

  • Portfolio rationalization/closures: opened 3 Denny’s; closed 10 franchise restaurants (avg unit volumes ~$1M) to improve franchise health/AUV
  • Remodels: completed 14 remodels in Q2 (5 company); company fleet ~55% remodeled; franchise system >10% remodeled; expect 5–10 more company remodels in 2025 and ~50+ franchise remodels
  • Underperformer rehab: Quintile 5 restaurants now outperform franchise same-restaurant sales by ~+120 bps in Q2 (training + field team support; moving to new operators where needed)
  • Cost/margin protection: management identified savings drivers (supplier negotiations, spec/recipe/menu enhancements, procedure modifications); additional opportunities include pack size + packaging/to-go packaging; up to ~200 bps savings expected over next 12–18 months
  • Keke’s remodeling/branding: company fleet >70% converted to new image; franchise fleet ~20% representing new image; 3 company remodels completed in period; broader franchise remodel program planned for 2026

AI IconMarket Outlook

  • 2025 same-restaurant sales guidance: reiterating low end of range expected to be within reach (choppy demand but levers improving)
  • July comps (Q&A): management would not quote exact July level due to volatility; stated they are ~down 2.2% year-to-date and need ~0.5 point improvement on back half to hit guidance
  • Keke’s openings: currently confident in 25–40 openings in 2025 (20 openings through Q2; 2 additional openings in Q3 thus far)
  • Closures: expect 70–90 closures (including underperformers + attrition from lease expirations)
  • Commodities and labor assumptions: commodities 3%–5%; labor inflation 2.5%–3.5%
  • G&A guidance: $80M–$85M (includes ~$1M related to 53rd week)
  • Adjusted EBITDA guidance: $80M–$85M; on track to reach low end
  • Refinancing: completion anticipated prior to third quarter earnings call

AI IconRisks & Headwinds

  • Choppy consumer environment: household incomes under pressure; consumers more selective (volatile demand across categories)
  • Concentration risk in stressed DMAs: top 4 DMAs drove ~30 bps decline in Q2 system-wide comps (LA/SF/Houston/Phoenix ~30% of comp base)
  • Margin pressure in company restaurants: product costs +80 bps; temporary headwinds from legal/medical reserves (~115 bps) and new cafe opening inefficiencies/oversight (~100 bps); softened company operating margin vs prior year
  • Tax rate volatility: effective tax rate 34.3% vs 25.1% due to discrete share-based compensation items

Sentiment: MIXED

Note: This summary was synthesized by AI from the DENN Q2 2025 earnings transcript. Financial data is complex; please verify all metrics against official SEC filings before making investment decisions.

📋 Official Regulatory 10-K / 10-Q SEC Filings

Direct authenticated documentation links to audited SEC database reports for DENN.

SEC EDGAR Live Feed
No recent 10-K available.
No recent 10-Q available.
Loading financial data and tables...
📁

SEC Filings (DENN)

© 2026 Stock Market Info — Denny's Corporation (DENN) Financial Profile