Dream Finders Homes, Inc.

Dream Finders Homes, Inc. (DFH) Market Cap

Dream Finders Homes, Inc. has a market capitalization of $1.35B.

Price: $14.60

0.25 (1.74%)

Market Cap: 1.35B

NYSE · time unavailable

CEO: Patrick O. Zalupski

Sector: Consumer Cyclical

Industry: Residential Construction

IPO Date: 2021-01-21

Website: https://www.dreamfindershomes.com

Dream Finders Homes, Inc. (DFH) - Company Information

Market Cap: 1.35B|Sector: Consumer Cyclical

Company Profile

Dream Finders Homes, Inc. operates as a holding company for Dream Finders Holdings LLC that engages in homebuilding business in the United States. It designs, constructs, and sells single-family entry-level, and first-time and second time move-up homes in Charlotte, Raleigh, Jacksonville, Orlando, Denver, the Washington D.C. metropolitan area, Austin, Dallas, and Houston. The company also operates as a licensed home mortgage broker that underwrites, originates, and sells mortgages to Prime Lending; and provides insurance agency services, including closing, escrow, and title insurance, as well as mortgage banking solutions. It sells its homes through its sales representatives and independent real estate brokers. The company was founded in 2008 and is headquartered in Jacksonville, Florida.

Analyst Sentiment

60%
Buy

From 2 Active Polls

1Y Forecast: $38.00

▲ +160.3% Potential Upside

Consensus Target Metrics

Low Bound

$38

Median

$38

High Bound

$38

Average

$38

Price & Moving Averages

Loading chart...

🎯 Wall Street Analyst Intelligence Report

1-Year structural target targets, chart projections, and sentiment maps.

Average 1Y Target
$38.00
▲ +160.27% Upside
Low Target
$38.00
160% Risk
Median Target
$38.00
160% Mid
High Target
$38.00
160% Max
Consensus
Hold
1 / 5 Buys

Consensus Trend Projection

Trailing closures vs. 12-month metrics map.

Analyst Vote Distribution

Aggregate institutional coverage sentiment weights.

📊 Historical Valuation Multiples

Real-time Trailing Twelve Month (TTM) momentum side-by-side with discrete quarterly metrics.

Fiscal QuarterTTMQ1 2026Q4 2025Q3 2025Q2 2025Q1 2025Q4 2024Q3 2024Q2 2024
Period EndingTrailing 12MMar 31, 2026Dec 31, 2025Sep 30, 2025Jun 30, 2025Mar 31, 2025Dec 31, 2024Sep 30, 2024Jun 30, 2024
Market Cap ($M)1,3541,2811,5842,4062,3502,1102,1763,3872,322
Enterprise Value ($M)2,7642,6911,9403,9213,7203,3123,2064,6573,252
Price to Earnings Ratio (P/E)7.6524.166.7412.8010.389.614.2111.987.17
Price/Earnings-to-Growth Ratio (PEG)0.270.640.080.26
Price to Sales Ratio (P/S)0.321.441.312.482.042.131.393.362.20
Price to Book Ratio (P/B)0.860.821.011.581.581.471.562.681.94
Price to Free Cash Flow Ratio (P/FCF)-10.16-23.3711.64-17.73-29.82-44.087.19-15.22-20.66
Enterprise Value to Sales (EV/Sales)3.031.604.043.233.352.054.633.08
Enterprise Value to EBITDA (EV/EBITDA)10.5397.1322.6058.2945.5339.3918.7746.7830.02
Debt to Equity Ratio5.371.210.381.161.071.040.941.171.01

DFH Growth Runway Model

Standard long term linear growth fade

Multi-Stage Discounted Cash Flow Sandbox

Market Price$14.60
Intrinsic Value$43.56
Market Alignment
Undervalued by 198.4%relative to calculated intrinsic value
9.00%
Exp: -0%-0%
i

Growth runway slowdown

This value provides a time window for the growth rate to decline beyond Stage 1 toward the terminal rate. Longer windows are most useful for companies with high growth starting conditions or strong competitive advantages. This option stretches out the growth rate slowdown across 5, 10, or 15-year steps. A high-growth starting condition (exceeding a 25% initial growth rate) automatically applies a curve decay to simulate realistic, rapid market saturation.
i

Terminal growth rate

With long-term inflation between 3-5%, revenue must grow by that baseline to maintain flat real-world market share. This value sets the permanent terminal growth rate to factor into the valuation beyond the growth slowdown runway toward maturity.

3-Stage Financial Runway Horizon

🧠 Perpetuity Horizon Engine (Stage 3: Post-2035)

Terminal FCF Base$0.39B
Perpetuity TV Value$7.26B
Discounted TV (PV)$3.07B
TV Weighting %57.1%
⚠️
Financial Model Disclaimer & Risk Disclosure: This interactive scenario simulator is an educational sandbox provided strictly for informational and analytical research purposes. Core historical financial statements and consensus estimates are sourced directly via Financial Modeling Prep (FMP). All downstream outputs are entirely deterministic, hypothetical projections generated by combining automated mathematical formulas (including linear interpolation and Gaussian bell-curve decay models) with user-selected variables and third-party financial data inputs. Users assume all liability for trading decisions executed based on these sandbox calculations.

📘 Full Research Report

ℹ️

AI-Generated Research: This report is for informational purposes only.

📘 DREAM FINDERS HOMES INC CLASS A (DFH) — Investment Overview

🧩 Business Model Overview

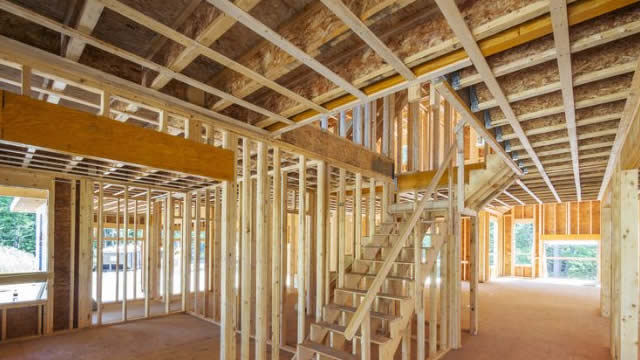
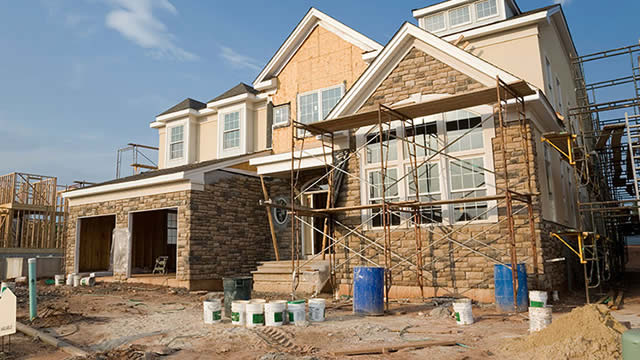
Dream Finders Homes builds and sells single-family homes, converting land and construction into move-in-ready inventory sold to end buyers. The value chain centers on (1) land acquisition and entitlement, (2) home design and permitting, (3) construction execution using a mix of internal project management and subcontract labor, and (4) marketing and closing, followed by (5) warranty/service obligations. Competitive performance depends less on repeat purchases and more on the ability to source buildable lots at attractive costs, control construction cycle time, and maintain buyer demand across housing cycles.

💰 Revenue Streams & Monetisation Model

Revenue is primarily generated through home sales, recognized as homes are delivered/closed. Monetisation is largely transactional, with margins driven by the spread between total project cost (land, construction, overhead allocation, and financing/carrying costs) and the contract selling price. In many homebuilder models, additional profitability drivers include:

  • Land economics: lot basis and timing of amortization into finished product.
  • Construction cost control: labor productivity, material pricing, and change-order discipline.
  • Operational leverage: overhead absorption and the ability to manage subcontractor schedules efficiently.
  • Incentive discipline: pricing strategy that balances sales pace with margin protection.

While homebuilder revenues are not “recurring” in the software sense, the business can exhibit some stability through multi-phase community development, repeatable sourcing processes, and established local trade relationships that support execution consistency.

🧠 Competitive Advantages & Market Positioning

The moat in single-family homebuilding is typically operational and cost-linked rather than technological. For Dream Finders Homes, the most durable advantages tend to come from:

  • Land and entitlement positioning (soft switching / execution advantage): homebuilders with a stronger pipeline of buildable lots can better match housing supply to demand and reduce costly stop-start cycles.
  • Construction cost and cycle-time discipline: consistent project execution can preserve margin when industry-wide material or labor conditions compress spreads.
  • Local operating familiarity: knowledge of submarkets, buyer profiles, and permitting/inspection pathways can reduce friction and planning risk.

Competitive benchmarking:

  • D.R. Horton — larger-scale builder with broader geographic coverage and significant purchasing power; competes heavily on scale and land sourcing breadth.
  • Lennar — major national builder; differentiates through community management and platform capabilities across cycles.
  • PulteGroup — diversified builder with strong brand positioning in certain segments; often competes on product mix and community locations.

Against these rivals, Dream Finders Homes’ positioning generally reflects an emphasis on select market participation and execution-led margin management rather than wholesale scale leadership. The competitive challenge is maintaining cost advantage while competing for land, labor, and finished lot availability during tighter supply conditions.

🚀 Multi-Year Growth Drivers

Over a 5–10 year horizon, the investment case rests on structural and capacity-driven drivers more than on incremental product innovation:

  • Supply constraint dynamics: the long-cycle nature of land development and permitting can keep market supply below demand growth, supporting pricing power during normalization of financing and affordability.
  • Household formation and migration: demographic growth and regional migration sustain underlying demand for ownership housing, particularly in Sunbelt and other job-concentrated geographies.
  • Refinancing/turnover effects within ownership markets: housing turnover and household formation create continual replacement demand even when macro affordability tightens.
  • Improving operational maturity: better land selection, more repeatable community planning, and improved construction productivity can expand margin resilience across cycles.

The TAM expansion is tied to the large, persistent base of single-family housing demand in the U.S., with growth concentrated in areas where buildable land availability and local permitting capacity can support sustained homebuilding activity.

⚠ Risk Factors to Monitor

  • Interest-rate sensitivity and affordability: changes in mortgage rates affect buyer purchasing power and can pressure sales pace and incentives.
  • Construction cost inflation: labor scarcity, material price swings, and subcontractor availability can compress margins if contract pricing does not keep pace.
  • Land and development execution risk: delays in entitlement, permitting, or infrastructure readiness can extend carry costs and reduce returns.
  • Inventory and pricing discipline: maintaining margin requires careful management of cancellations, incentives, and finished-home inventory build-up.
  • Quality and warranty exposure: a homebuilder’s reputation and cost profile can be affected by construction defects and higher warranty costs.

📊 Valuation & Market View

Homebuilders are typically valued using cash-earnings oriented metrics and book value dynamics rather than long-duration growth assumptions. Market pricing tends to be influenced by:

  • Expected housing margins (land cost, construction cost, and pricing spreads).
  • Cycle position: the market often reprices forward earnings as affordability and sales pace change.
  • Return on invested capital: land banking efficiency and inventory turnover affect perceived durability of profitability.
  • Balance-sheet and liquidity resilience: adequate liquidity and prudent leverage help builders navigate inventory and cost shocks.

As a result, valuation is most sensitive to factors that move projected unit economics—land basis, construction productivity, and pricing/incentive strategy—rather than to purely “top-line” volume growth.

🔍 Investment Takeaway

Dream Finders Homes’ long-term thesis is anchored in execution-led economics: the ability to secure attractive land positions, control construction costs and cycle times, and manage pricing and incentives to preserve margin through housing cycles. The primary question for investors is whether operational discipline and local market execution can sustain returns when industry-wide input costs, financing conditions, and supply-demand balance shift.


⚠ AI-generated — informational only. Validate using filings before investing.

📰 Market News & Coverage

15 Stories Available

Real-time institutional reporting and market updates for DFH.

businesswire.com2026-06-01

Dream Finders Homes Appoints Clint Szubinski as Chief Operating Officer

JACKSONVILLE, Fla.--(BUSINESS WIRE)--Dream Finders Homes, Inc. (“Dream Finders Homes”, “DFH”, the “Company”) (NYSE: DFH), the 2025 National Builder of the Year, today announced the appointment of Clint Szubinski as Chief Operating Officer (“COO”). Mr. Szubinski, a seasoned executive with more than two decades of homebuilding leadership experience, will work alongside our National President – formerly COO, Doug Moran to transition teams and responsibilities. Mr. Moran will continue to provide gu.

businesswire.com2026-05-21

Dream Finders Homes Releases Investor Presentation to Reaffirm Acquisition Proposal for Beazer Homes and Opportunity to Create Value for Shareholders

JACKSONVILLE, Fla.--(BUSINESS WIRE)--Dream Finders Homes, Inc. (“Dream Finders”, “DFH”) (NYSE: DFH), today made available an investor presentation in connection with its proposal to acquire Beazer Homes USA, Inc. (“Beazer”, “Beazer Homes”) (NYSE: BZH). The investor presentation is available at announcement.dreamfindershomes.com and will be filed with the U.S. Securities and Exchange Commission. On May 5, 2026, Dream Finders submitted a proposal to acquire Beazer Homes in an all-cash transaction.

fool.com2026-05-12

Stock Market Today (LIVE): Inflation Roars Back as Tech Retreats; eBay Shoots Down GameStop Offer

Top insights from the latest market news from Tuesday, May 12, from The Motley Fool analysts on Team Rule Breakers and Team Hidden Gems.

businesswire.com2026-05-11

Beazer Homes Announces Rejection of Unsolicited Proposals from Dream Finders Homes

ATLANTA--(BUSINESS WIRE)--Beazer Homes USA, Inc. (NYSE: BZH) (“Beazer” or the “Company”) today confirmed that its Board of Directors (the “Beazer Board”), with the assistance of its financial and legal advisors, has evaluated and rejected multiple unsolicited, non-binding proposals from Dream Finders Homes, Inc. (NYSE: DFH) (“Dream Finders”) to acquire all of the outstanding shares of Beazer. In evaluating the proposals, the Beazer Board determined that they significantly undervalued the Compan.

gurufocus.com2026-05-11

Beazer Homes (BZH) Surges on Dream Finders Homes (DFH) Acquisition Proposal

Beazer Homes (BZH) is experiencing a significant increase in its stock price following an unsolicited, all-cash acquisition proposal from Dream Finders Homes (D

wsj.com2026-05-11

Dream Finders Homes Bids to Acquire Beazer Homes for $704 Million

Dream Finders Homes submitted a bid last week to acquire Beazer Homes USA for about $704 million.

barrons.com2026-05-11

Beazer Homes Stock Soars 22% on $704 Million Bid From Dream Finders Homes

Dream Finders Homes bids to acquire Beazer Homes USA for $25.75 a share.

businesswire.com2026-05-11

Dream Finders Homes Proposes to Acquire Beazer Homes for $25.75 Per Share in Cash

JACKSONVILLE, Fla.--(BUSINESS WIRE)--Dream Finders Homes, Inc. (the “Company”, “Dream Finders”) (NYSE: DFH), announced today that it has submitted a proposal to the board of directors (the “Board”) of Beazer Homes USA, Inc. (“Beazer”) to acquire all outstanding shares of Beazer in an all-cash transaction at a price of $25.75 per share, a cash premium of approximately 40% over Beazer's closing share price on May 5, 2026. The proposed transaction reflects a total equity value of approximately $70.

fool.com2026-05-07

Arcus Capital Scales Back Dream Finders Homes Stake, According to Recent SEC Filing

Dream Finders Homes has kept orders moving in a tougher housing market, but the next test is less about buyer interest than the profit attached to each closing. Its asset-light lot strategy gives the builder flexibility, while affordability pressure will help determine how much of that demand reaches earnings.

businesswire.com2026-04-30

Dream Finders Homes Announces First Quarter 2026 Results

JACKSONVILLE, Fla.--(BUSINESS WIRE)--Dream Finders Homes, Inc. (the “Company”, “Dream Finders Homes”, “Dream Finders” or “DFH”) (NYSE: DFH) announced its financial results for the first quarter ended March 31, 2026. First Quarter 2026 Highlights (As Compared to First Quarter 2025) Net sales increased 19% to 2,408 from 2,032 Homebuilding revenues of $837 million compared to $970 million Home closings of 1,870 compared to 1,925 Homebuilding gross margin of 14.5% compared to 19.2% Adjusted homebui.

defenseworld.net2026-04-27

Financial Survey: LRR Energy (NASDAQ:LRE) vs. Dream Finders Homes (NYSE:DFH)

Dream Finders Homes (NYSE: DFH - Get Free Report) and LRR Energy (NASDAQ: LRE - Get Free Report) are both small-cap construction companies, but which is the superior stock? We will contrast the two companies based on the strength of their risk, earnings, analyst recommendations, dividends, valuation, institutional ownership and profitability. Analyst Recommendations This is a summary

defenseworld.net2026-04-19

Dream Finders Homes (NYSE:DFH) Shares Up 10.5% – Time to Buy?

Shares of Dream Finders Homes, Inc. (NYSE: DFH - Get Free Report) shot up 10.5% during mid-day trading on Friday. The company traded as high as $14.45 and last traded at $15.0040. 51,475 shares traded hands during trading, a decline of 91% from the average session volume of 581,492 shares. The stock had previously closed

defenseworld.net2026-04-16

Dream Finders Homes (NYSE:DFH) & LRR Energy (NASDAQ:LRE) Head to Head Comparison

LRR Energy (NASDAQ: LRE - Get Free Report) and Dream Finders Homes (NYSE: DFH - Get Free Report) are both small-cap finance companies, but which is the better business? We will compare the two companies based on the strength of their risk, analyst recommendations, earnings, profitability, institutional ownership, dividends and valuation. Risk and Volatility LRR Energy has

defenseworld.net2026-04-13

Dream Finders Homes (NYSE:DFH) and LRR Energy (NASDAQ:LRE) Financial Survey

Dream Finders Homes (NYSE: DFH - Get Free Report) and LRR Energy (NASDAQ: LRE - Get Free Report) are both small-cap construction companies, but which is the superior investment? We will compare the two businesses based on the strength of their analyst recommendations, dividends, profitability, valuation, earnings, institutional ownership and risk. Volatility and Risk Dream Finders Homes

defenseworld.net2026-04-04

SG Americas Securities LLC Purchases 145,842 Shares of Dream Finders Homes, Inc. $DFH

SG Americas Securities LLC increased its position in Dream Finders Homes, Inc. (NYSE: DFH) by 1,443.4% during the fourth quarter, according to its most recent Form 13F filing with the Securities and Exchange Commission. The institutional investor owned 155,946 shares of the company's stock after buying an additional 145,842 shares during the period.

📊 AI Financial Analysis

Powered by StockMarketInfo
Earnings Data: Q Ending 2026-03-31

"DFH (2026-03-31, Q1) reported Revenue of $887.8M and Net Income of $13.3M (EPS $0.11). QoQ (vs 2025-12-31) Revenue fell -26.7% and Net Income fell -77.4%; margins also contracted materially (net margin 1.49% vs 4.84%). YoY (vs 2025-03-31) Revenue decreased -10.3% and Net Income decreased -75.9%, indicating a sharp deterioration in bottom-line profitability. Profitability has been unstable over the last four quarters: gross margin declined to 14.6% from 19.5% (Q1’25) and operating margin dropped to 2.18% from 7.76% (Q1’25). Operating cash flow was -$49.5M in Q1’26, producing negative free cash flow of -$54.8M—an adverse shift from Q4’25’s strong operating cash flow (+$143.6M). Balance sheet liquidity remains adequate (cash $479.0M; current ratio 5.42), but leverage is high and rising versus prior periods (total debt $1.89B; net debt $1.41B). Shareholder returns are weak: the stock is down -29.2% over 1 year with a small dividend yield (~0.26%), and there is no evidence of sustained buyback support in the cash flows. Analyst consensus target ($38) implies substantial upside versus the $14.82 price, but near-term fundamentals deteriorated sharply."

Revenue Growth

Neutral

Revenue declined -26.7% QoQ (from $1.21B) and -10.3% YoY (from $989.9M), showing no growth momentum.

Profitability

Neutral

Net income fell -77.4% QoQ and -75.9% YoY; net margin contracted to 1.49% from 4.84% (Q4’25) and 5.55% (Q1’25). Operating margin also dropped to 2.18% from 7.76% (Q1’25).

Cash Flow Quality

Neutral

Q1’26 operating cash flow was -$49.5M with free cash flow -$54.8M, reversing prior strength (Q4’25 OCF +$143.6M). Dividend paid was modest (-$3.4M).

Leverage & Balance Sheet

Neutral

Liquidity improved (current ratio 5.42; cash $479M), but leverage is high: total debt $1.89B and net debt $1.41B. Equity is sizable ($1.56B) but resilience is pressured by leverage.

Shareholder Returns

Neutral

1-year price performance is -29.2% (no >20% positive momentum boost). Dividend yield is low (~0.26%); buybacks were present but not enough to offset price weakness.

Analyst Sentiment & Valuation

Caution

Consensus price target is $38 versus $14.82 current price, suggesting attractive upside in valuation expectations; however, fundamentals in the latest quarter weakened sharply.

Disclaimer:This analysis is AI-generated for informational purposes only. Accuracy is not guaranteed and this does not constitute financial advice.

Fundamentals Overview

Loading fundamentals overview...

📋 Official Regulatory 10-K / 10-Q SEC Filings

Direct authenticated documentation links to audited SEC database reports for DFH.

SEC EDGAR Live Feed
Loading financial data and tables...
📁

SEC Filings (DFH)

© 2026 Stock Market Info — Dream Finders Homes, Inc. (DFH) Financial Profile