Krispy Kreme, Inc.

Krispy Kreme, Inc. (DNUT) Market Cap

Krispy Kreme, Inc. has a market capitalization of $548.2M.

Price: $3.18

-0.03 (-0.93%)

Market Cap: 548.23M

NASDAQ · time unavailable

CEO: Joshua Charlesworth

Sector: Consumer Cyclical

Industry: Restaurants

IPO Date: 2021-07-01

Website: https://www.krispykreme.com

Krispy Kreme, Inc. (DNUT) - Company Information

Market Cap: 548.23M|Sector: Consumer Cyclical

Company Profile

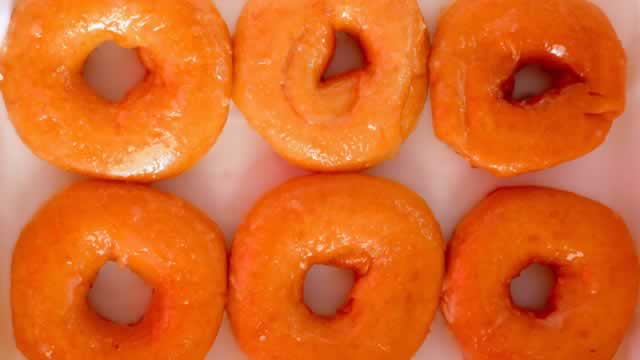
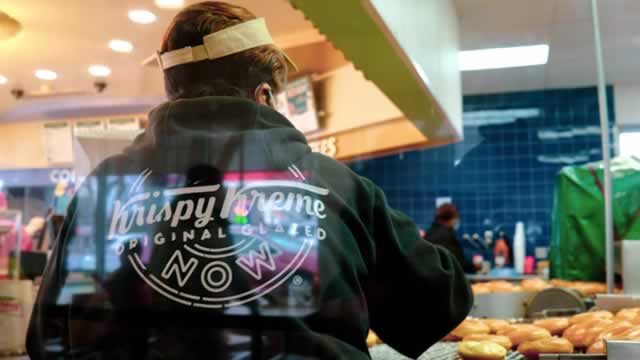
Krispy Kreme, Inc., operating alongside its various subsidiaries, focuses on creating and distributing distinctive doughnut experiences through a comprehensive omni-channel business model. Its operations are structured across three primary divisions: U.S. and Canada, International markets, and Market Development. Beyond its signature doughnuts, the company also offers a diverse array of other sweet treats, including cookies, brownies, ice cream, and various cookie-based confections, often accompanied by cold milk. Additionally, it provides doughnut mixes, other ingredients, and even equipment for doughnut production. By early 2022 (specifically January 2), Krispy Kreme boasted a global presence of 1,810 branded outlets (Krispy Kreme and Insomnia Cookies) spanning approximately 30 countries. Of these, 971 were company-owned locations and 839 were managed by franchisees. Its comprehensive distribution strategy involves sales through these retail shops, a "delivered fresh daily" model, e-commerce platforms, and direct delivery services. Established in 1937, Krispy Kreme, Inc. maintains its headquarters in Charlotte, North Carolina. The organization underwent a name change in May 2021, transitioning from its former identity, Krispy Kreme Doughnuts, Inc., to its current designation.

Analyst Sentiment

58%
Buy

From 7 Active Polls

1Y Forecast: $6.00

▲ +88.7% Potential Upside

Consensus Target Metrics

Low Bound

$6

Median

$6

High Bound

$6

Average

$6

Price & Moving Averages

Loading chart...

🎯 Wall Street Analyst Intelligence Report

1-Year structural target targets, chart projections, and sentiment maps.

Average 1Y Target
$6.00
▲ +88.68% Upside
Low Target
$6.00
89% Risk
Median Target
$6.00
89% Mid
High Target
$6.00
89% Max
Consensus
Buy
7 / 14 Buys

Consensus Trend Projection

Trailing closures vs. 12-month metrics map.

Analyst Vote Distribution

Aggregate institutional coverage sentiment weights.

📊 Historical Valuation Multiples

Real-time Trailing Twelve Month (TTM) momentum side-by-side with discrete quarterly metrics.

Fiscal QuarterTTMQ1 2026Q4 2025Q3 2025Q2 2025Q1 2025Q4 2024Q3 2024Q2 2024
Period EndingTrailing 12MMar 29, 2026Dec 28, 2025Sep 28, 2025Jun 29, 2025Mar 30, 2025Dec 29, 2024Sep 29, 2024Jun 30, 2024
Market Cap ($M)5485817156114978381,6231,8211,726
Enterprise Value ($M)9199522,1822,0181,8992,2702,9473,1013,161
Price to Earnings Ratio (P/E)-1.07-5.28-6.52-8.11-0.29-6.15-18.3711.67-78.54
Price/Earnings-to-Growth Ratio (PEG)-1.43-0.23
Price to Sales Ratio (P/S)0.361.581.821.631.312.234.024.793.93
Price to Book Ratio (P/B)0.870.921.090.910.720.761.431.541.52
Price to Free Cash Flow Ratio (P/FCF)-93.0551.0825.5939.31-8.18-17.93-236.30-79.611107.41
Enterprise Value to Sales (EV/Sales)2.595.565.385.006.057.298.167.20
Enterprise Value to EBITDA (EV/EBITDA)-2.8633.2382.4162.10-4.64161.84117.4530.1378.03
Debt to Equity Ratio-1.150.702.172.142.051.321.191.111.29

📘 Full Research Report

ℹ️

AI-Generated Research: This report is for informational purposes only.

📘 KRISPY KREME INC (DNUT) — Investment Overview

🧩 Business Model Overview

Krispy Kreme operates a hybrid model built around fresh product supply and a franchised store network. The company’s value chain centers on (1) producing and/or supporting dough preparation and finished goods through centralized or production-linked processes, (2) delivering those products to retail points of sale, and (3) monetizing through both company-owned shops and franchise partners.

Customer stickiness comes less from “switching costs” and more from consistent product quality, brand-associated taste expectations, and convenience of access within a dense store footprint. Franchise agreements further strengthen durability of the operating system by aligning incentives around unit-level standards, training, and brand execution.

💰 Revenue Streams & Monetisation Model

Revenue is primarily generated from:

  • Franchise royalties and related fees: recurring payments tied to franchisee sales activity and brand usage.
  • Company-owned shop revenue: direct retail sales of doughnuts, beverages, and incremental daypart offerings.
  • Initial franchise fees and other franchise-related income: less recurring, but supportive of cash generation during expansion.
  • Supply/operating support monetisation (where applicable): wholesale or operational support elements that benefit from scale in procurement and production.

Margin structure typically reflects two key drivers: (1) unit economics (labor, store rent/occupancy, and product yield) for company-owned shops, and (2) royalty/fee economics for franchise operations, which tend to be less capital-intensive and can carry higher incremental margins as the store base expands.

Given the product is perishable, operational execution—throughput, waste control, and production scheduling—remains a core determinant of profitability rather than pure marketing intensity.

🧠 Competitive Advantages & Market Positioning

Krispy Kreme’s most defensible advantages are anchored in a combination of intangible brand assets and scale-enabled operational capabilities rather than classic switching costs.

  • Intangible assets (brand + product identity): A long-standing, differentiated product category positioning supports consumer repeat behavior for a specific “fresh doughnut” occasion. Competitors can copy individual items, but sustained brand preference and execution consistency are harder to replicate at scale.
  • Operational scale and cost discipline: Centralized sourcing, standardized processes, training, and store operating systems can reduce waste and improve product consistency. This creates a sustainable cost advantage when input prices fluctuate.
  • Franchise system as a distribution moat: Franchise economics allow rapid unit expansion while limiting corporate capital intensity. The brand platform, proprietary methods, and store standards increase partner execution quality versus independent startups.

Competitive benchmarking:

  • Dunkin’ (Inspire Brands): broader breakfast and beverage focus with a large footprint and strong coffee economics; Krispy Kreme competes by emphasizing the fresh doughnut occasion rather than an all-day coffee-first platform.
  • Starbucks: premium coffee-led brand with loyalty and store design; Krispy Kreme targets a different consumption moment—sweet baked goods with a “fresh” product narrative.
  • Tim Hortons: value-oriented food and beverage bundling with strong morning traffic; Krispy Kreme’s differentiation is concentrated on doughnuts and related dayparts where fresh execution matters.

Overall, Krispy Kreme’s industry focus is narrower than these rivals (sweet baked goods and adjacent beverages rather than broad coffee/QSR menus), which can be an advantage when execution excellence and distribution reach align.

🚀 Multi-Year Growth Drivers

A 5–10 year outlook is supported by several structural and TAM-related levers:

  • International store rollout through franchising: Asset-light expansion can extend brand presence into underpenetrated geographies where the “fresh doughnut” format remains less saturated.
  • Unit growth plus throughput improvement: Even absent dramatic new product categories, increasing transactions per store (daypart expansion, merchandising, and operational scheduling) can lift revenue without proportional cost increases.
  • Menu adjacency and beverage mix: Adding or scaling beverages and complementary items can smooth seasonality and increase average ticket size while leveraging store labor already present.
  • Omnichannel enablement: Drive-through, delivery partnerships, and localized fulfillment improve convenience and can expand the customer base beyond walk-in traffic.
  • Category growth in “treat occasions”: Consumer behavior that values indulgence moments supports continued demand for sweet baked goods, particularly in high-traffic retail and commuting zones.

⚠ Risk Factors to Monitor

  • Commodity and input cost pressure: Flour, sugar, dairy, and cooking oil exposure can compress margins if pricing power is insufficient.
  • Labor and occupancy inflation: QSR-style labor intensity and rent/lease cost levels can impact store-level profitability, especially in company-owned locations.
  • Franchisee credit and execution risk: Franchise expansion depends on partner fitness. Weak operators can dilute brand experience and lead to higher support costs or churn.
  • Quality and food safety compliance: Perishable, high-throughput food operations face regulatory and reputational risk from process lapses.
  • Competitive intensity: Large, diversified competitors can use pricing and promotions to pressure foot traffic in overlapping dayparts.
  • Capital and production infrastructure needs (where applicable): Maintaining production standards and store format requirements may require periodic investment.

📊 Valuation & Market View

The market typically values QSR franchisors using a blend of enterprise value to operating cash flow/EBITDA and revenue-based multiples, with emphasis on franchise mix and durability of unit growth. Key valuation drivers commonly include:

  • Quality of same-store performance (traffic vs. pricing and promotion intensity)
  • Incremental margin profile (royalty scaling benefits and waste control)
  • Sustainable franchise unit growth (net new doors, franchise partner health)
  • Cash conversion and capital-light characteristics from franchising

In this framework, the primary swing factors are execution stability and the ability to grow the store base without undermining brand standards or franchise economics.

🔍 Investment Takeaway

Krispy Kreme’s long-term investment case rests on an asset-light franchise platform paired with an identifiable brand and standardized fresh-product operating system. While competitive differentiation is not based on switching costs, the combination of (1) intangible brand equity, (2) scale-enabled operational discipline, and (3) franchise distribution reach can support durable unit growth and resilient economics through cycles—provided input costs, franchise partner quality, and food-safety execution remain well-managed.


⚠ AI-generated — informational only. Validate using filings before investing.

📰 Market News & Coverage

15 Stories Available

Real-time institutional reporting and market updates for DNUT.

businesswire.com2026-07-27

KRISPY KREME® Invites Fans on a Sweet Escape with New Destination Dessert Collection

CHARLOTTE, N.C.--(BUSINESS WIRE)--Beginning Tuesday, July 28, Krispy Kreme® is bringing the vibrant flavors of some beloved Latin American desserts to its new Destination Dessert Collection. Featuring three all-new doughnuts bursting with irresistible flavor, this limited-time collection marks the next stop on Krispy Kreme's global tour, following two summers of fan-favorite doughnuts inspired by Paris and Italy. Krispy Kreme's Destination Dessert Collection invites fans to discover three class.

businesswire.com2026-07-21

KRISPY KREME® Celebrates the Sweetest Days of Summer with New Original Glazed® Blueberry Flavored Doughnut

CHARLOTTE, N.C.--(BUSINESS WIRE)--Krispy Kreme® is celebrating peak blueberry season with the new, limited-time Original Glazed® Blueberry Flavored Doughnut – a berry delicious twist on the iconic Original Glazed® that captures the sweetest moments of summer in every bite. Available for four days only – Thursday through Sunday (July 23-26) – this irresistible treat features Krispy Kreme's melt-in-your-mouth Original Glazed® doughnut made with blueberry-flavored dough, delivering a vibrant, frui.

fool.com2026-07-15

Krispy Kreme vs. McDonald's: Which Restaurant Stock Is a Better Buy in 2026?

Krispy Kreme continues to expand its omni-channel reach through 14,000 fresh points of access across global markets. McDonald's maintains a dominant global footprint with over 45,000 restaurants and a resilient franchise-led business model.

247wallst.com2026-07-10

Why Investors Are Watching These 3 Meme Stocks Now: Wendy's, Krispy Kreme, and Tootsie Roll

Meme stock season is back with three consumer names at the center of retail chatter: a heavily shorted momentum play with an activist twist, a busted IPO in turnaround mode, and a low-float, family-run confectioner riding a cocoa cost tailwind.

wsj.com2026-07-06

Krispy Kreme Needs an Artisanal Touch to Make ‘He-Man' Doughnuts

The company is hand-decorating doughnuts in a quest to lure younger consumers.

youtube.com2026-07-06

Why Krispy Kreme Can't Fully Automate Its Donuts | WSJ

Krispy Kreme is pushing its machinery to boost efficiency and reverse a period of missed sales targets and profit losses. The company is trying to boost efficiency with automation but found some tasks still require human hands.

businesswire.com2026-07-06

Krispy Kreme to Announce Second Quarter 2026 Results and Host Conference Call on August 6, 2026

CHARLOTTE, N.C.--(BUSINESS WIRE)--Krispy Kreme, Inc. (NASDAQ: DNUT) (“Krispy Kreme” or the “Company”), today announced that it will issue its second quarter 2026 earnings results on Thursday, August 6, 2026. The results and related slide presentation will be available on the Company's website at investors.krispykreme.com beginning at 6:45 AM Eastern Time. Management will host a conference call and webcast to discuss the results at 8:00 AM Eastern Time on the same day. To register for the confer.

fool.com2026-06-26

CAVA vs. Krispy Kreme: Which Consumer Stock Is a Better Buy in 2026?

CAVA Group continues to see rapid growth and positive net income as it scales its Mediterranean fast-casual concept across the United States. Krispy Kreme is executing a strategic pivot toward a capital-light model by expanding third-party retail access points and refranchising shops.

businesswire.com2026-06-15

KRISPY KREME® Brings the Sweet Taste of Summer with All-New Seasonal Collection

CHARLOTTE, N.C.--(BUSINESS WIRE)--Sunshine, road trips, backyard hangouts and late-night sweet cravings just got even better. Krispy Kreme® is kicking off summer with an all-new seasonal collection packed with bright, refreshing flavors. Available beginning Tuesday, June 16 for a limited time at participating Krispy Kreme shops across the U.S., the Summer Seasonal Collection features a mix of delicious new doughnuts and returning fan favorites that are ready to become the flavors of the season:.

businesswire.com2026-06-09

KRISPY KREME® Kicks Off the Summer of Soccer with New Match Day Dozen and $2 Original Glazed® Dozen BOGO

CHARLOTTE, N.C.--(BUSINESS WIRE)--The world's biggest soccer moments deserve an equally sweet celebration, and Krispy Kreme® is bringing the flavor with its all-new Match Day Dozen. Available for a limited time from Thursday through Sunday (June 11-14) at participating Krispy Kreme shops across the U.S., the Match Day Dozen is the ultimate game-day treat. Whether you're cheering from the couch, gathering with friends, rocking your lucky jersey, or celebrating every goal, save, and nail-biting f.

seekingalpha.com2026-06-07

Krispy Kreme: Impressive Q1 FCF, Still An EPS Show-Me Story

Krispy Kreme remains a hold as turnaround progress is evident, but valuation uncertainty persists. Q1 marked the first positive free cash flow since IPO, with adjusted EBITDA up 38% YoY and 260 bps margin expansion. FY 2026 guidance targets $1.25–$1.35B net revenue, $140–$150M adjusted EBITDA, and over $15M free cash flow.

fastcompany.com2026-06-05

National Donut Day 2026: List of freebies and deals includes Dunkin', Krispy Kreme, and 7-Eleven

It's the first Friday of June (June 5, 2026), and that means it is once again National Donut Day in America (or National Doughnut Day, if you're Krispy Kreme).

businesswire.com2026-06-01

KRISPY KREME® Celebrates National Doughnut Day this Friday with FREE Doughnut and $2 Original Glazed Dozen BOGO

CHARLOTTE, N.C.--(BUSINESS WIRE)--The countdown is on to National Doughnut Day – and there's one destination that does it best: Krispy Kreme®. This Friday (June 5), Krispy Kreme is celebrating the sweetest day of the year by treating guests to a free doughnut of their choice – no purchase necessary.* It's simple: stop by, pick your favorite and enjoy. From the iconic Original Glazed® to classics like Strawberry Iced with Sprinkles or Chocolate Iced Kreme™ Filled, Krispy Kreme is serving up the.

fastcompany.com2026-05-27

A Krispy Kreme data breach may qualify thousands of Americans for payouts over $3,000

Krispy Kreme employees may get more than just free donuts, with a portion of a $1.6 million settlement still up for grabs.

fool.com2026-05-26

Krispy Kreme vs. Domino's Pizza: Which Consumer Goods Stock Is a Better Buy in 2026?

Global reach, diverging financials: One brand posted a net loss after revenue dipped, while the other delivered rising sales and steady margins last year.

📊 AI Financial Analysis

Powered by StockMarketInfo
Earnings Data: Q Ending 2026-03-29

"DNUT (Dunkin’) reported Q1 2026 revenue of $367.0M and net income of -$22.8M (EPS -$0.16). On a YoY basis, revenue declined -2.1% (Q1’26 vs Q1’25: $367.0M vs $375.2M) while net income improved slightly (less negative) by +31.5% (from -$33.3M to -$22.8M). QoQ, revenue decreased -6.5% (vs $392.4M in Q4’25), and net losses widened (net income -$22.8M vs -$27.8M, an improvement of +18.0%). Profitability was mixed: gross margin remained strong at ~75.9%, up from ~75.8% in Q1’25 and up from ~-112.3% in Q4’25, but operating income remained essentially flat to slightly negative (operating income -$0.16M, operating margin -0.04%). The income statement shows sustained bottom-line pressure versus Q1’25 net margin (-8.9%)—improving to -6.2% in Q1’26—suggesting some cost/other-item stabilization. Cash flow quality looks acceptable: Q1’26 operating cash flow was $20.2M and free cash flow was $11.4M, with modest buyback activity (-$0.4M). Balance sheet resilience improved materially versus Q4’25: cash returned to $74.2M (from -$42.4M), total equity rose to ~$633M, while total debt fell sharply (net debt ~ $370.5M vs ~$1.47B). Total shareholder return is likely negative: marketPerformance shows price at $3.61 and 1y_change of -9.3%, with no dividend (yield 0%) and only minor buybacks—so value creation appears to rely on future margin and cash-flow normalization. Analyst consensus implies upside/limited downside versus valuation anchors (consensus target $4.5)."

Revenue Growth

Caution

Revenue was slightly down YoY (-2.1%) in Q1’26 and down QoQ (-6.5%) versus Q4’25, indicating a soft demand/top-line environment.

Profitability

Caution

Gross margin is strong (~75.9%) and stable YoY, while net margin improved to -6.2% from -8.9% (YoY). However, operating income remains near break-even to negative (operating margin -0.04%), with continued bottom-line losses.

Cash Flow Quality

Fair

Q1’26 operating cash flow was positive ($20.2M) and free cash flow was $11.4M, a constructive quarter versus loss-making earnings. No dividend paid; buybacks were small (-$0.4M).

Leverage & Balance Sheet

Neutral

Balance sheet strengthened versus Q4’25: cash turned positive ($74.2M), total equity rose (~$633M), and net debt dropped to ~$370.5M (from ~$1.47B). Leverage remains meaningful but coverage improved.

Shareholder Returns

Neutral

Price performance is weak (1y_change -9.3%; no >20% momentum). Dividend yield is 0%, and buybacks were immaterial—total shareholder return likely negative without operating improvement.

Analyst Sentiment & Valuation

Fair

Consensus price target ($4.5) is above the current price ($3.61), suggesting modest upside. Valuation appears to reflect expectations of continued normalization, though profitability remains challenged.

Disclaimer:This analysis is AI-generated for informational purposes only. Accuracy is not guaranteed and this does not constitute financial advice.

Fundamentals Overview

Loading fundamentals overview...

Krispy Kreme’s Q1 2026 performance reflects a turnaround execution focused on capital-light growth and cost discipline. Adjusted EBITDA rose 38% YoY to $33.1M, while the U.S. was the key margin driver with +480 bps adjusted EBITDA margin and >10% YoY declines in shop/delivery labor and SG&A. The company strengthened deleveraging metrics, improving net leverage to 5.5x and benefiting from a 25 bps interest-rate reduction tied to bank leverage dropping below 4x. Operationally, logistics outsourcing to third-party providers was completed in April ahead of schedule, improving cost predictability and helping offset fuel inflation. Commercially, the firm added 250+ higher-volume/higher-margin doors in Q1 with strategic fresh delivery partners and is ramping digital (23% of U.S. retail sales; loyalty 17M+ members). Guidance is moderately constructive but sensitive to deal timing: FY 2026 assumes the already-completed refranchising transactions and management signaled updates as new deals close. Overall, momentum is real, yet execution and external variability remain watch items.

AI IconGrowth Catalysts

  • Refranchising momentum: Japan refranchising agreement with Unison Capital and ownership reduction in the Western U.S. JV (WKS) to a 20% minority stake
  • U.S. network utilization leverage: ~25% utilization enabling growth without incremental capacity
  • Profitability via logistics optimization: transition of U.S. fresh delivery network to third-party logistics completed in April ahead of schedule
  • Higher-margin U.S. door gains: over 250 higher-volume, higher-margin doors added in Q1 with strategic partners (Publix, Sam's Club, Target) and launch in Jewel-Osco (Albertsons)
  • Product/digital mix strength: original glazed and dozen sales up; LTOs tied to cultural moments; digital channel 23% of U.S. retail sales in Q1; loyalty program 17M+ members

Business Development

  • Unison Capital (Japan) refranchising agreement; ~90 shops and 300 fresh delivery points of access currently in Japan; first targeted international refranchising deal of 2-3 in 2026
  • WKS Restaurant Group (Western U.S.) ownership reduced to 20% minority stake; WKS operates 70+ shops and agreed to develop new shops and expand Krispy Kreme fresh delivery footprint
  • Publix, Sam's Club, Target (U.S. strategic fresh delivery partners) adding 250+ higher-volume/higher-margin doors in Q1
  • Jewel-Osco / Albertsons family of brands (U.S. entry/launch in Jewel-Osco)
  • Walmart and Target referenced as underpenetrated strategic partners supported via existing logistics capacity delivering to 7,400+ fresh doors

AI IconFinancial Highlights

  • Net revenue $367M (-2.2% YoY) driven by strategic closure of underperforming doors completed in Q3 2025
  • System-wide sales $485.3M (+0.7% YoY constant currency), excluding sales from now-ended McDonald's USA partnership
  • Adjusted EBITDA $33.1M (+38% YoY), third consecutive quarter of YoY adjusted EBITDA growth; driven by network productivity and corporate cost control
  • Net leverage ratio improved to 5.5x at quarter end (down 1.2x QoQ; improved 2x since Aug turnaround plan announcement); below prior forecasted 6x attributed to timing of WKS refranchising proceeds
  • Interest rate benefit: bank leverage below 4x lowered interest rate on primary credit facility by 25 bps
  • U.S. adjusted EBITDA margin increased +480 bps YoY; U.S. organic revenue -4% YoY due to closure of underperforming fresh delivery doors (incl. McDonald's)
  • International organic revenue +0.4% YoY (Canada/Mexico), but International adjusted EBITDA -2.9% YoY to $14.5M due to Japan refranchising in early March
  • International/Market Development adjusted EBITDA margin decreased: Market Development margin -60 bps YoY to 57.5% due to product mix/regional changes
  • Labor and SG&A: shop and delivery labor and SG&A expenses declined more than 10% YoY

AI IconCapital Funding

  • Free cash flow: generated positive free cash flow in Q1; first positive Q1 since 2021 IPO
  • Liquidity increased to $300M+; bank leverage below 4x
  • Capital expenditures guided at $50M to $60M in FY 2026 (~50% decrease vs last year)
  • Guidance: positive free cash flow of >$15M (FY 2026)
  • No explicit buyback/debt balance amounts disclosed in transcript beyond net leverage and liquidity

AI IconStrategy & Ops

  • U.S. logistics outsourced to third-party partners (completed April ahead of schedule), improving cost predictability and reducing operational risk
  • Route/demand planning and optimized production/delivery schedules to lower cost-to-serve and support expansion
  • Door optimization completed in Q3 2025; returned to growth over last 2 quarters, adding 250+ higher-volume/higher-margin doors in Q1
  • Refranchising used to deleverage and reduce net debt; March completion of 2 transactions (Japan and Western U.S.)
  • International expansion via hub-and-spoke Hot Light Theater model: opened 2nd Hot Light Theater shop in Sao Paulo (immediately referenced as opened 'just yesterday' prior to call date)

AI IconMarket Outlook

  • FY 2026 system-wide sales guidance: +2% to +4% constant currency to >$1.96B base (and to over $2B cited for system-wide sales)
  • FY 2026 net revenue guidance: $1.25B to $1.35B
  • FY 2026 adjusted EBITDA guidance: $140M to $150M
  • FY 2026 shop openings: at least 100 shop openings, nearly all franchised; 26 opened in Q1
  • International markets: expected to add 3-4 new international franchise markets in 2026, including Netherlands; Netherlands Hot Light Theater expected to open late 2026; phased expansion to ~30 shops over next 5 years
  • Refranchising annualized EBITDA impact cited: approximately $15M for Japan and WKS (note: CFO also referenced annualized impact of both around $50M in Q&A context)

AI IconRisks & Headwinds

  • Timing/impact risk from additional refranchising deals: management stated guidance will be updated as more deals close
  • Macro consumer demand variability: executives acknowledged dynamic environment; referenced weather disruption in January (Southeast)
  • Fuel price volatility: logistics optimization expected to offset recent increases in fuel prices (implying residual exposure)
  • International volatility from transaction effects: International adjusted EBITDA decline tied to Japan refranchising early March
  • Market Development segment headwinds: Market Development organic revenue -4.3% as equipment sales declined despite royalty growth offset

Q&A: Analyst Interest

  • International refranchising puts/ takes: Analyst asked how additional international refranchising deals beyond those completed will affect the existing 2026 net revenue and adjusted EBITDA guidance. CFO said the guidance includes only deals already done and will be updated when further deals close, with annualized impacts clarified previously.
  • U.S. consumer trends by month/region: Analyst requested more detail on U.S. customer trends amid mixed macro conditions, including regional strength and how demand trended by month in 1Q plus any insights for April. Management cited strong original glazed/dozens and gifting-driven demand, with January weather disruption offset by strength through April.

Sentiment: MIXED

Note: This summary was synthesized by AI from the DNUT Q1 2026 earnings transcript. Financial data is complex; please verify all metrics against official SEC filings before making investment decisions.

📋 Official Regulatory 10-K / 10-Q SEC Filings

Direct authenticated documentation links to audited SEC database reports for DNUT.

SEC EDGAR Live Feed
No recent 10-K available.
No recent 10-Q available.
Loading financial data and tables...
📁

SEC Filings (DNUT)

© 2026 Stock Market Info — Krispy Kreme, Inc. (DNUT) Financial Profile