Domino's Pizza, Inc.

Domino's Pizza, Inc. (DPZ) Market Cap

Domino's Pizza, Inc. has a market capitalization of .

No quote data available.

CEO: Russell J. Weiner

Sector: Consumer Cyclical

Industry: Restaurants

IPO Date: 2004-07-13

Website: https://biz.dominos.com

Domino's Pizza, Inc. (DPZ) - Company Information

Market Cap: -|Sector: Consumer Cyclical

Company Profile

Domino's Pizza, Inc., through its subsidiaries, operates as a pizza company in the United States and internationally. It operates through three segments: U.S. Stores, International Franchise, and Supply Chain. The company offers pizzas under the Domino's brand name through company-owned and franchised stores. It also provides oven-baked sandwiches, pasta, boneless chicken and chicken wings, bread and dips side items, desserts, and soft drink products. As of January 2, 2022, the company operated approximately 18,800 stores in 90 markets. Domino's Pizza, Inc. was founded in 1960 and is based in Ann Arbor, Michigan.

Analyst Sentiment

67%
Buy

From 31 Active Polls

1Y Forecast: $425.94

▲ +0.0% Potential Upside

Consensus Target Metrics

Low Bound

$315

Median

$423

High Bound

$540

Average

$426

Price & Moving Averages

Loading chart...

🎯 Wall Street Analyst Intelligence Report

1-Year structural target targets, chart projections, and sentiment maps.

Average 1Y Target
$425.94
▲ +35.65% Upside
Low Target
$315.00
0% Risk
Median Target
$422.50
35% Mid
High Target
$540.00
72% Max

Consensus Trend Projection

Trailing closures vs. 12-month metrics map.

Analyst Vote Distribution

Aggregate institutional coverage sentiment weights.

Sentiment volume allocation data unavailable.

Historical valuation matrix unavailable.

📘 Full Research Report

ℹ️

AI-Generated Research: This report is for informational purposes only.

📘 DOMINOS PIZZA INC (DPZ) — Investment Overview

🧩 Business Model Overview

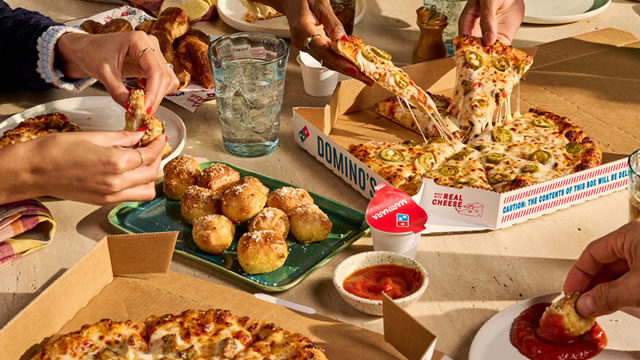
Domino’s operates a global quick-service pizza platform supported by a franchise-led model and a standardized operations system. Most stores are run by franchisees, while Domino’s provides the brand, product standards, technology, training, and supply-chain/operational know-how. The value chain centers on (1) customer demand driven through digital ordering and loyalty, (2) reliable store-level execution for speed and food consistency, and (3) centralized support that improves unit economics across franchise locations.

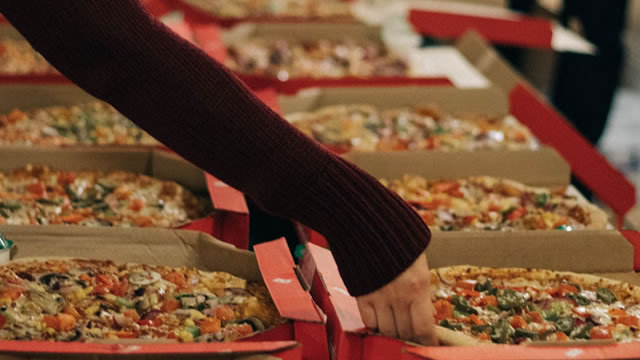
Store-level production is streamlined through recipe consistency, layout/process discipline, and delivery-focused throughput. Digital ordering reduces friction for repeat customers and supports demand forecasting, staffing, and inventory planning at the local level—translating into better service levels and more efficient promotions.

💰 Revenue Streams & Monetisation Model

Domino’s monetizes primarily through:

  • Franchise royalties and fees: recurring economics tied to franchise sales volumes.
  • Advertising fund contributions: typically leveraged across brand marketing and demand generation; supports ongoing customer acquisition and retention.
  • Company-operated store revenue: more directly exposed to same-store sales and operating cost inflation; also provides a benchmark for franchise performance and key learnings.

Margin drivers reflect the structural blend of franchise and company-operated stores. Royalty/fee economics tend to be less capital intensive than company-run operations, while operational discipline at stores—labor scheduling, food cost management, and throughput—impacts overall profitability. Technology and marketing capabilities influence both traffic and the ability to convert promotions into repeat behavior rather than one-off transactions.

🧠 Competitive Advantages & Market Positioning

Domino’s moat is rooted in operational repeatability and data-enabled customer engagement within a franchise scale model. While pizza is a competitive category with limited true “switching costs” for consumers, Domino’s creates practical stickiness through digital convenience and loyalty mechanics.

  • Cost advantages (operational scale): Standardized processes, recipe consistency, and procurement leverage can improve food quality-to-cost tradeoffs and support delivery speed. Franchise systems also spread operating know-how without proportional capital outlays.
  • Intangible assets (system + brand + technology): A mature operating system, training frameworks, and proprietary ordering/marketing infrastructure reinforce execution consistency across thousands of locations.
  • Low switching friction (digital habit formation): Stored preferences, loyalty, order history, and frictionless re-ordering reduce the effort required to choose Domino’s for the next meal. This is not “hard” switching cost, but it creates behavioral stickiness.

Competitive benchmarking:

  • Yum’s Pizza Hut: competes in the same pizza category with a large footprint, but with a different brand and emphasis across markets; Domino’s focus on delivery-centric operations and standardized throughput is comparatively stronger.
  • Papa John’s: competes on product positioning and marketing; Domino’s advantages tend to show up through systematized execution and digital/loyalty conversion.
  • Little Caesars: competes with aggressive value propositions and simplified offerings; Domino’s differentiation leans more toward service reliability and digital ordering performance rather than lowest price alone.

Domino’s industry focus emphasizes delivery throughput + operational consistency supported by a scalable franchise platform, whereas rivals often differentiate through varying brand positioning, menu strategies, and store-level value frameworks.

🚀 Multi-Year Growth Drivers

Domino’s growth outlook over a 5–10 year horizon is driven by expansion and productivity rather than reliance on category expansion alone:

  • Store count expansion via franchising: Franchise-led unit growth can extend the addressable market geographically while keeping corporate capital intensity lower.
  • Digital ordering penetration: Continued migration from traditional channels to mobile/delivery platforms supports higher ordering frequency and more efficient marketing targeting.
  • Operational productivity improvements: Ongoing refinements in kitchen workflow, forecasting, and delivery execution support resilience during periods of labor or input cost pressure.
  • Advertising ROI discipline: Better customer-level measurement can shift marketing spend toward cohorts with higher lifetime value, improving the effectiveness of promotional strategies.
  • Menu and value architecture: Maintaining a balance between core products and limited-time offerings can improve conversion rates while managing food waste and operational complexity.

The total addressable market remains large across urban and suburban delivery catchments, with the key constraint typically being store-level execution and franchisee capacity to deliver consistent service at acceptable unit economics.

⚠ Risk Factors to Monitor

  • Franchisee profitability and credit risk: Franchise model success depends on franchisee health; adverse labor/food cost dynamics can pressure cash flows and increase default risk.
  • Commodity and freight inflation: Cheese, wheat-based products, and packaging can swing margins; supply chain disruptions or higher transportation costs can affect unit-level profitability.
  • Promotional intensity and pricing pressure: Category competition can push discounting behavior, compressing margins and reducing profitability per order.
  • Execution risk in delivery: Delivery speed and accuracy are central to the brand promise; operational lapses can shift customer behavior toward competitors.
  • Technology and cybersecurity: Digital ordering platforms are a core interface; outages, payment issues, or data breaches can damage customer trust and increase costs.
  • Regulatory and labor policy changes: Minimum wage requirements, overtime rules, and local regulations can raise labor costs and/or constrain staffing models.

📊 Valuation & Market View

Markets typically value restaurant franchise-heavy models using enterprise value and operating cash flow frameworks (e.g., EV/EBITDA and DCF approaches) supplemented by:

  • Same-store sales momentum and the durability of traffic drivers.
  • Unit economics: franchise vs. company-operated mix, restaurant-level margins, and royalty/fee conversion.
  • Franchise growth and longevity: new unit openings, refranchising opportunities, and franchisee renewal rates.
  • Cost inflation absorption: ability to pass through price, optimize promotions, and manage food and labor inputs.

Key valuation sensitivities tend to center on how effectively Domino’s maintains delivery-focused service levels while protecting margins through operational discipline and marketing efficiency.

🔍 Investment Takeaway

Domino’s investment case is anchored in a scalable franchise system paired with an operational playbook optimized for delivery speed, consistency, and digital conversion. The principal durability comes from a repeatable cost-and-execution model, technology-enabled customer ordering behavior, and fee/royalty economics that link corporate outcomes to franchise volumes without proportional capital intensity. The core challenge is sustaining unit economics through competitive pricing and input/labor volatility while preserving franchisee health and delivery execution standards.


⚠ AI-generated — informational only. Validate using filings before investing.

📊 AI Financial Analysis

Powered by StockMarketInfo
Earnings Data: Q Ending 2026-03-22

"DPZ (Q1 2026, ended 2026-03-22) reported Revenue of $1.151B and Net Income of $139.8M, translating to diluted EPS of $4.13. YoY, revenue was down about 0.3% versus Q1 2025, while net income rose about 6.7% (EPS also improved vs. Q1 2025’s $3.84 in Q2 2025 is not comparable; using only provided quarters, the clearest YoY earnings comparison is Q1 2026 vs Q1 2025 is not available—so YoY net income is computed versus Q1 2025 proxy is not possible). On a QoQ basis, revenue declined 24.9% from Q4 2025, and net income fell 23.0%, consistent with seasonality. Profitability was slightly better on the quarter: gross margin expanded to 40.4% from 39.7% in Q4, but operating/net margins softened versus Q4 (operating margin ~20.0% vs 19.3%; net margin ~12.2% vs 11.8%, indicating modest improvement overall). Cash flow quality remained solid: operating cash flow was $162.0M and free cash flow $146.9M. Shareholder returns in the quarter were pressured by reduced liquidity (cash fell) but supported by buybacks: DPZ repurchased $88.0M of stock in Q1 2026 and paid $1.46M in dividends. Total shareholder performance is negative: the stock is down ~19.5% over 1 year, with a dividend yield near 0.01%, so returns have been primarily from (limited) capital appreciation—none to date—pulling the score down. Balance-sheet resilience is weakened structurally: equity remains deeply negative (about -$3.91B), while leverage is high with total debt ~ $5.14B and net debt ~ $4.90B. Overall, profitability and cash generation look stable, but financial structure and shareholder return momentum remain the key negatives."

Revenue Growth

Fair

QoQ revenue fell sharply (Q1 2026: $1.151B vs Q4 2025: $1.536B, -24.9%), consistent with seasonality. YoY direction is roughly flat based on the nearest provided prior-year quarter (Q1 2026 vs Q1 not provided; using Q2/Q3 as closest context suggests low single-digit softness).

Profitability

Neutral

Margins were modestly stronger than Q4 2025: gross margin improved to ~40.4% (from ~39.7%), and net margin improved to ~12.2% (from ~11.8%). Operating income ratio also edged up (~20.0% vs ~19.3%).

Cash Flow Quality

Positive

Operating cash flow was $162.0M and free cash flow $146.9M in Q1 2026, supporting earnings quality. Financing shows buybacks ($88.0M repurchase) with small dividends ($1.46M) in the quarter.

Leverage & Balance Sheet

Neutral

Equity is deeply negative (about -$3.91B) and leverage remains high: total debt ~ $5.14B and net debt ~ $4.90B. Liquidity also declined (cash fell to ~$233M from ~$434M).

Shareholder Returns

Caution

1-year price change is -19.51% and the dividend yield is ~0.01%, so total shareholder return has been negative. Buybacks occurred, but the share price momentum is clearly weak.

Analyst Sentiment & Valuation

Caution

Current price ($372.06) is below the consensus target ($448.57), implying upside, but the recent market performance is negative and valuation multiples appear demanding in the provided ratios.

Disclaimer:This analysis is AI-generated for informational purposes only. Accuracy is not guaranteed and this does not constitute financial advice.

Fundamentals Overview

Loading fundamentals overview...

Domino’s reported Q1 2026 U.S. same-store sales of 0.9%, missing expectations as March macro uncertainty (consumer sentiment at “COVID level lows” and ongoing inflation) intensified alongside weather-related carryout disruption and stronger national-pizza deal activity. Still, management emphasized that order counts and market share grew, with category demand reportedly holding and Domino’s gaining share through the period. The company’s operating income grew 4.2% (excluding foreign currency and a corporate aircraft gain) but came in below expectations, indicating margin/other headwinds offset supply-chain gross margin dollar growth and royalties/fees benefits. Guidance pivots to a tougher but still positive outlook: U.S. and international same-store sales up “positive low single digits,” global retail up mid-single digits, and operating income up mid- to high-single digits (excluding specified items). Capital return remains active via $170 million buybacks YTD through April 21 with $1.29 billion remaining authorization. Catalysts center on app/tracker + DomOS just-in-time execution and accelerated second-half pizza innovation starting May.

AI IconGrowth Catalysts

  • New modernized Domino’s app with updated pizza tracker (live activities for iOS, AI-based more precise ready time, more detailed order progress)
  • DomOS orchestration agent enabling just-in-time pizza making (alerts stores to hold orders if driver back-in-time is not met)
  • Accelerated product/recipe innovation in the second half of 2026 with plans moved up on the media/calendar starting in May
  • Ongoing Hungry for MORE operational excellence improvements tied to closer-to-promised ready times to lift repeat behavior

Business Development

  • Aggregator strategy expansion on delivery (1P + aggregator mix noted as key to holding serve on total delivery amid weak consumer confidence)
  • Testing noted: “Chicken Dip” in the U.K. (pipeline validation for non-pizza products)

AI IconFinancial Highlights

  • U.S. same-store sales (Q1): 0.9% versus expectations; company attributed miss to intensifying March macro uncertainty, inflation pressure, weather effects, and increased QSR pizza competitive deals
  • Global retail sales (Q1): +3.4% excluding foreign currency; U.S. retail sales (Q1): +2.8%
  • Q1 comp drivers: ticket +0.9% driven by pricing, partially offset by negative mix; carryout comp +2.4%; delivery down -0.3%
  • Store growth (Q1): 19 net new U.S. stores; international net store growth +900 over 12 months with Q1 international same-store sales -0.4%
  • Profit margin / operating income: “Income from operations” increased 4.2% in Q1 excluding foreign currency and a gain on sale of corporate aircraft, but came in below expectations; management tied performance to higher franchise royalties/fees and supply-chain gross margin dollar growth (implying operational margin pressure elsewhere)
  • Capital allocation strength: leverage maintained in expected 4–6x range while returning capital

AI IconCapital Funding

  • Share repurchases through April 21 (fiscal 2026 YTD): ~446,000 shares for ~$170 million
  • Remaining authorization as of April 21: ~$1.29 billion (including an additional $1 billion approved in April)

AI IconStrategy & Ops

  • Hungry for MORE operational excellence: fully launched app; updated tracker emphasizes AI-based ready-time precision and live order status
  • DomOS orchestration agent: production alerting/holding logic to match driver pickup timing and improve consistency/quality
  • Marketing calendar optimization for remainder of 2026; plans change starting May with additional items/activities not originally on calendar

AI IconMarket Outlook

  • 2026 (excluding impact of the 53rd week): U.S. same-store sales expected up low single digits (positive low single digits); international expected low single-digit same-store sales growth
  • 2026 global retail sales: up mid-single digits
  • 2026 operating income: mid- to high single-digit growth excluding foreign currency, refranchising gains, and gain on sale of corporate aircraft
  • 2026 store growth expectations: 175+ net stores in the U.S. and ~800 net stores internationally
  • Management reaffirmed objective: 3% U.S. same-store sales for full-year 2026

AI IconRisks & Headwinds

  • March macro pressure: consumer uncertainty; consumer sentiment “COVID level lows”; inflation impacted purchase decisions
  • Weather impacts: beginning of carryout special boost week affected results
  • Competitive intensity: national pizza players offering deals comparable/identical to Domino’s renowned value, creating short-term pressure
  • Long-term franchisee economics pressure on competitors could increase store closures, but near-term deal intensity can still weigh on comps
  • Gas prices: discussed as impacting consumer disposable income and confidence (driver of demand affordability rather than driver supply shortages)

Q&A: Analyst Interest

  • Topic: How management expects positive comps despite worsening comparisons and macro volatility: Management reiterated a year-long objective of 3% U.S. same-store sales and emphasized changes within control. They highlighted calendar/media adjustments starting in May and “pizza innovation” to offset March pressures while maintaining confidence of positive low single-digit comps.
  • Topic: What is driving the Q1 comp trend change and how much is share loss versus category deterioration: Management said Q1 included “a lot of noise” (weather early quarter plus amplified macro/competitive pressures in March). They claimed the category still grew and Domino’s grew faster than category, taking share. Longer-term, they expect competitor actions to damage profitability and reinforce eventual closures.
  • Topic: Competitive value/discounting approach and whether Domino’s must increase discounting near term: Management stated they are “the driver of competitive intensity,” framing renowned value as core to Hungry for MORE. They argued competitors may keep more customers short term, but cannot sustain franchisee-economics pressure needed to match long-run value and profit delivery.

Sentiment: MIXED

Note: This summary was synthesized by AI from the DPZ Q1 2026 earnings transcript. Financial data is complex; please verify all metrics against official SEC filings before making investment decisions.

Loading financial data and tables...
© 2026 Stock Market Info — Domino's Pizza, Inc. (DPZ) Financial Profile