📘 GREEN PLAINS INC (GPRE) — Investment Overview
🧩 Business Model Overview
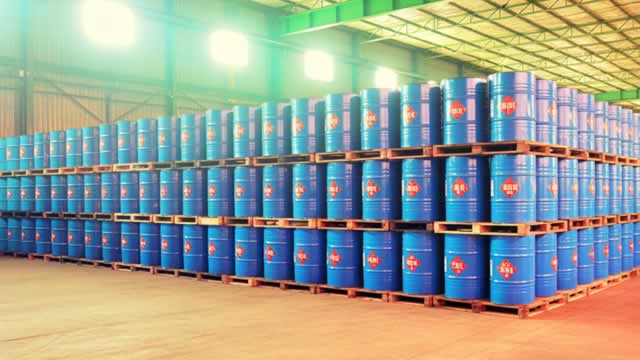
Green Plains is a North American biofuels and related co-products platform centered on transforming agricultural commodities and other feedstocks into transportation fuels and value-added byproducts. The core value chain runs from (1) sourcing and purchasing inputs (principally corn for ethanol and other feedstocks for renewable diesel/biodiesel-related outputs), to (2) processing in owned or controlled production assets, to (3) selling finished products into fuel markets and specialty channels while monetizing co-products created during processing.
A key feature of the model is integration of feedstock logistics and production footprint. Ethanol production is closely tied to the economics of Midwest corn supply, and finished fuels/co-products are distributed through a network of plant-level handling and regional logistics (including barge/rail/truck access depending on site).
💰 Revenue Streams & Monetisation Model
Revenue is primarily driven by transactional sales of:
- Ethanol: sold into gasoline blending and wholesale fuel markets; margins depend on the ethanol-to-gasoline spread and the ability to maintain utilization.
- Co-products (especially distiller grains and other processed outputs): typically capture incremental value from the feedstock, reducing the net effective cost of inputs.
- Renewable fuels (including renewable diesel/biodiesel-related production where applicable): monetization depends on feedstock costs, conversion yields, and the market value of compliance/low-carbon attributes.
- Compliance/low-carbon credits: where applicable, policy-driven credits can materially affect netbacks by providing additional per-unit value on qualifying volumes.
Overall margin structure is heavily influenced by (1) feedstock-to-output conversion economics (including yields), (2) energy and operating costs, (3) the level of utilization, and (4) the spread between renewable fuel values and conventional benchmarks, plus the contribution from policy attributes.
🧠 Competitive Advantages & Market Positioning
The moat in this sector is less about brand and more about low-cost feedstock access and logistical infrastructure that lowers delivered input costs and supports reliable throughput.
- Low-Cost Feedstock (Geographic cost advantage): Plants positioned within strong agricultural supply regions can benefit from lower delivered corn costs and reduced basis risk versus facilities that rely on longer supply chains. This directly affects the “all-in” cost per gallon.
- Logistical Infrastructure & Scale of Execution: Ownership/operation of plants and established sourcing/distribution routes supports sustained utilization, faster procurement execution, and improved working-capital efficiency versus smaller or more logistically constrained peers.
- Co-product Monetisation: Co-products such as distiller grains help diversify revenue and partially hedge feedstock economics by capturing more value from each unit of input.
Competitive benchmarking (primary peers):
- ADM (Archer Daniels Midland) and Valero Energy: both operate large-scale fuel production footprints and compete on logistics, scale, and integration advantages, often with broader global trading capabilities.
- POET and other Midwestern ethanol-focused producers: compete in the same regional corn belt with similar input-cost dynamics, often relying on local infrastructure and plant-level execution.
- Yara is not a direct ethanol competitor but is relevant in broader bio/agri markets; the key contrast is that Green Plains’ core competitive set is concentrated in renewable fuels and co-products rather than fertilizer production.
Green Plains’ positioning emphasizes a tighter linkage between regional agricultural sourcing, plant operations, and co-product capture. Versus larger multinational integrators, its competitive strength tends to center on regional execution and operational intensity; versus smaller ethanol specialists, the emphasis is on maintaining scale and infrastructure that supports stable throughput and netbacks through varying cycle conditions.
🚀 Multi-Year Growth Drivers
Over a 5–10 year horizon, growth is primarily driven by policy-supported demand for lower-carbon fuels and the ongoing economics of biofuel blending and compliance markets. Major drivers include:
- Compliance-driven demand for renewable fuels: blending requirements and low-carbon fuel standards sustain a structural demand floor for qualifying volumes.
- Renewable diesel expansion and feedstock optionality: shifting portions of the portfolio toward renewable diesel/biodiesel-related outputs can improve earnings resilience when feedstock spreads and credit values are favorable.
- Operational learning curves and utilization discipline: maintaining high operational reliability can translate into sustained volume and better absorption of fixed costs.
- Co-product market depth: distiller grains and related products benefit from continued demand from livestock and feed industries, supporting diversification of revenue beyond base fuel sales.
- Decarbonization and sustainability compliance: customers and regulators increasingly require measurable lifecycle reductions, which can preserve the “value attribution” to renewable molecules versus conventional fuels.
⚠ Risk Factors to Monitor
- Commodity and spread volatility: profitability depends on the relationship between corn (and other feedstocks), energy/utility costs, and renewable fuel pricing versus conventional benchmarks.
- Regulatory and credit risk: changes in blending mandates, qualification rules, or the economics of compliance attributes can compress netbacks even if production volumes remain stable.
- Capital intensity and construction/retrofit execution: new capacity or upgrades require disciplined capital allocation and may introduce downtime and cost overruns risk.
- Environmental and permitting compliance: biofuel plants face ongoing environmental obligations (emissions, water, waste handling) that can elevate sustaining capex.
- Competitive supply dynamics: new capacity, efficiency improvements by peers, or alternative low-carbon pathways can alter market balances and spreads.
- Demand substitution risk: long-run fuel demand can be influenced by vehicle electrification and fuel efficiency, potentially affecting the overall blending pool.
📊 Valuation & Market View
Market valuation for renewable fuels producers typically centers on cash generation and cycle-adjusted profitability, often expressed through enterprise value multiples such as EV/EBITDA, alongside unit economics (e.g., margin per gallon and cash cost per unit).
Key valuation drivers that investors typically underwrite include:
- Feedstock delivered cost and its correlation to regional agriculture cycles.
- Operating performance (utilization, yields, downtime) translating to stable volume and margin capture.
- Netbacks including compliance attributes, which can swing results materially across policy regimes.
- Capital allocation quality (maintenance vs. growth capex and the expected return profile).
- Balance sheet leverage and liquidity, given the working-capital nature of commodity-driven businesses.
🔍 Investment Takeaway
Green Plains’ long-term investment case rests on structural advantages in low-cost feedstock access through regional sourcing and logistical infrastructure that supports reliable plant throughput. The ability to monetize co-products and capture value from compliance-linked economics can create resilience across fuel cycles, while growth opportunities in renewable fuels align with persistent policy-driven demand for lower-carbon transportation molecules. The principal risk is the sensitivity of netbacks to commodity spreads, regulatory frameworks, and execution of capacity investments.
⚠ AI-generated — informational only. Validate using filings before investing.