Ferroglobe PLC

Ferroglobe PLC (GSM) Market Cap

Ferroglobe PLC has a market capitalization of $721.3M.

Price: $3.86

-0.24 (-5.85%)

Market Cap: 721.28M

NASDAQ · time unavailable

CEO: Marco Levi

Sector: Basic Materials

Industry: Industrial Materials

IPO Date: 2009-07-30

Website: https://www.ferroglobe.com

Ferroglobe PLC (GSM) - Company Information

Market Cap: 721.28M|Sector: Basic Materials

Company Profile

Ferroglobe PLC operates in the silicon and specialty metals industry in the United States, Europe, and internationally. It provides silicone chemicals that are used in a range of applications, including personal care items, construction-related products, health care products, and electronics, as well as silicon metal for primary and secondary aluminum producers; silicomanganese, which is used as deoxidizing agent in the steel manufacturing process; and ferromanganese that is used as a deoxidizing, desulphurizing, and degassing agent in the removal of nitrogen and other harmful elements from steel. The company also offers ferrosilicon products that are used to produce stainless steel, carbon steel, and various other steel alloys, as well as to manufacture electrodes and aluminum; calcium silicon, which is used in the deoxidation and desulfurization of liquid steel, and production of coatings for cast iron pipes, as well as in the welding process of powder metal and in pyrotechnics; and nodularizers and inoculants, which are used in the production of iron. In addition, it provides silica fume, a by-product of the electrometallurgical process of silicon metal and ferrosilicon. Further, the company operates quartz mines in Spain, South Africa, the United States, and Canada; and low-ash metallurgical coal mines in the United States, as well as holds interests in hydroelectric power plant in France. It serves silicone chemical, aluminum, and steel manufacturers; auto companies and their suppliers; ductile iron foundries; manufacturers of photovoltaic solar cells and computer chips; and concrete producers. The company was formerly known as VeloNewco Limited and changed its name to Ferroglobe PLC in December 2015. The company was incorporated in 2015 and is headquartered in London, the United Kingdom. Ferroglobe PLC is a subsidiary of Grupo Villar Mir, S.A.U.

Analyst Sentiment

67%
Buy

From 2 Active Polls

Consensus Target Matrix

Data feed parsing pending...

Price & Moving Averages

Loading chart...

🎯 Wall Street Analyst Intelligence Report

1-Year structural target targets, chart projections, and sentiment maps.

Average 1Y Target
$4.05
▲ +5.00% Upside
Low Target
$2.90
-25% Risk
Median Target
$3.94
2% Mid
High Target
$4.83
25% Max
Consensus
Buy
8 / 11 Buys

Consensus Trend Projection

Trailing closures vs. 12-month metrics map.

Analyst Vote Distribution

Aggregate institutional coverage sentiment weights.

📊 Historical Valuation Multiples

Real-time Trailing Twelve Month (TTM) momentum side-by-side with discrete quarterly metrics.

Fiscal QuarterTTMQ1 2026Q4 2025Q3 2025Q2 2025Q1 2025Q4 2024Q3 2024Q2 2024
Period EndingTrailing 12MMar 31, 2026Dec 31, 2025Sep 30, 2025Jun 30, 2025Mar 31, 2025Dec 31, 2024Sep 30, 2024Jun 30, 2024
Market Cap ($M)7217768748566906947158741,027
Enterprise Value ($M)8659191,0449476927397818991,020
Price to Earnings Ratio (P/E)-6.53-27.50-2.70-16.70-16.52-2.61-6.3511.61-3.86
Price/Earnings-to-Growth Ratio (PEG)-4.93-0.48-0.640.28
Price to Sales Ratio (P/S)0.522.232.652.751.782.261.942.023.34
Price to Book Ratio (P/B)1.081.161.261.090.850.890.990.951.17
Price to Free Cash Flow Ratio (P/FCF)-18.56-43.90-43.661480.52-393.66136.9847.63-87.05-51.69
Enterprise Value to Sales (EV/Sales)2.643.173.041.792.412.122.073.32
Enterprise Value to EBITDA (EV/EBITDA)-8.84-32.59-10.7349.5080.91-16.73-53.5616.98-23.80
Debt to Equity Ratio-1.470.360.420.270.170.220.280.160.16

GSM Growth Runway Model

Standard long term linear growth fade

Multi-Stage Discounted Cash Flow Sandbox

Market Price$3.86
Intrinsic Value$3.86
Market Alignment
Overvalued by 0.1%relative to calculated intrinsic value
9.00%
Exp: -2%-2%
i

Growth runway slowdown

This value provides a time window for the growth rate to decline beyond Stage 1 toward the terminal rate. Longer windows are most useful for companies with high growth starting conditions or strong competitive advantages. This option stretches out the growth rate slowdown across 5, 10, or 15-year steps. A high-growth starting condition (exceeding a 25% initial growth rate) automatically applies a curve decay to simulate realistic, rapid market saturation.
i

Terminal growth rate

With long-term inflation between 3-5%, revenue must grow by that baseline to maintain flat real-world market share. This value sets the permanent terminal growth rate to factor into the valuation beyond the growth slowdown runway toward maturity.

3-Stage Financial Runway Horizon

🧠 Perpetuity Horizon Engine (Stage 3: Post-2035)

Terminal FCF Base$0.07B
Perpetuity TV Value$1.36B
Discounted TV (PV)$0.57B
TV Weighting %55.5%
⚠️
Financial Model Disclaimer & Risk Disclosure: This interactive scenario simulator is an educational sandbox provided strictly for informational and analytical research purposes. Core historical financial statements and consensus estimates are sourced directly via Financial Modeling Prep (FMP). All downstream outputs are entirely deterministic, hypothetical projections generated by combining automated mathematical formulas (including linear interpolation and Gaussian bell-curve decay models) with user-selected variables and third-party financial data inputs. Users assume all liability for trading decisions executed based on these sandbox calculations.

📘 Full Research Report

ℹ️

AI-Generated Research: This report is for informational purposes only.

📘 FERROGLOBE PLC (GSM) — Investment Overview

🧩 Business Model Overview

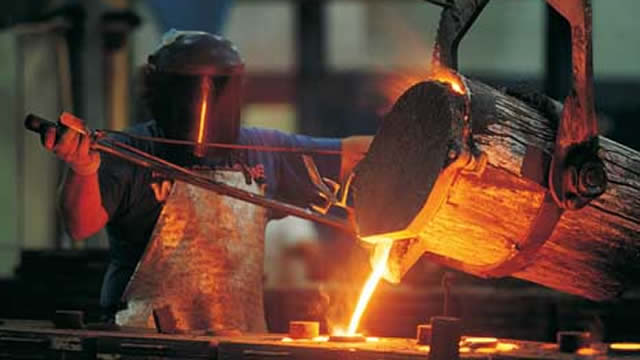
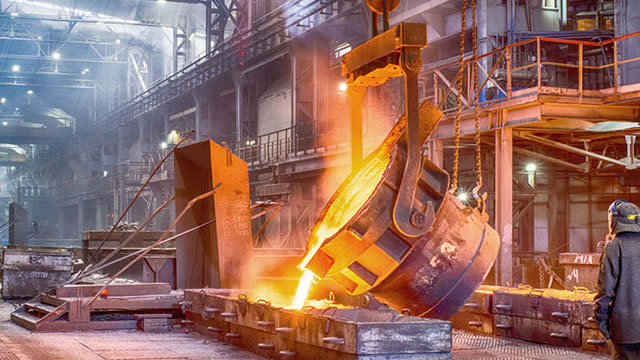
Ferroglobe is a producer of industrial alloys used primarily in metals refining—most importantly silicon and manganese-based products that act as deoxidizers, alloying agents, and impurity reducers in downstream aluminum and steel production. The value chain centers on converting electricity- and raw-material-intensive metallurgical inputs into saleable ferroalloys, then selling them into a global customer base that values consistent specifications and dependable supply.

Customer stickiness is driven less by software-like switching and more by qualification and operating practice: alloying and refining customers design processes around chemistry specifications, delivery consistency, and technical support. For Ferroglobe, the economics are fundamentally shaped by the “cost curve” (power, raw inputs, and conversion efficiency) and by logistics that reduce delivered cost to major consuming regions.

💰 Revenue Streams & Monetisation Model

Revenue is largely transactional and tied to commodity-linked volumes and pricing for ferroalloys, with margins influenced by the spread between realized alloy pricing and production costs. Monetisation is typically characterized by:

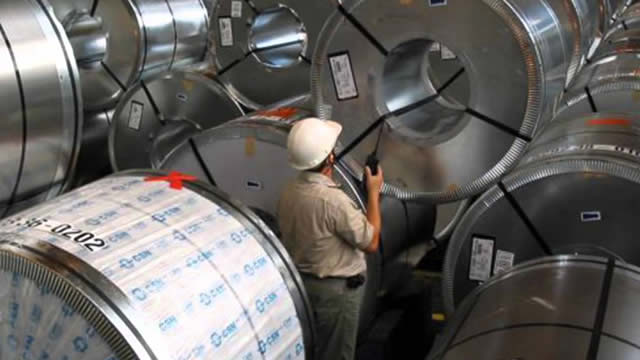
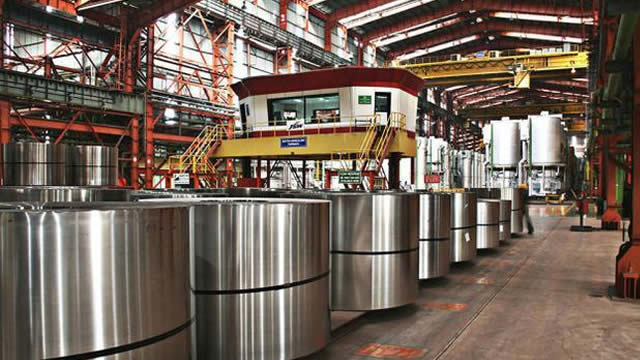
  • Product-driven sales: revenue primarily from silicon-based and manganese-based alloys used in aluminum and steel production.
  • Volume and utilization effects: output and furnace/plant utilization materially affect fixed-cost absorption.
  • Cost-pass-through limitations: electricity and carbon costs are often not fully pass-through; therefore, margin is sensitive to changes in input costs and regulatory burdens.

Given the industry structure, the primary margin drivers are (1) energy cost position, (2) conversion efficiency/yield, (3) raw-material availability and pricing, and (4) product mix between silicon and manganese alloys depending on market conditions.

🧠 Competitive Advantages & Market Positioning

The core moat is primarily cost and logistics competitiveness, supported by operational know-how and long-standing customer relationships in metallurgical supply chains.

  • Geographic cost advantage (energy-intensive production): ferroalloy production is constrained by power costs and plant siting. Producers with access to lower-cost electricity and stable industrial power arrangements sustain a better cost curve than higher-cost peers.
  • Logistical infrastructure and delivered cost: proximity to major consuming regions and established distribution routes reduce delivered cost and delivery friction—important when customers optimize procurement across multiple alloy sources.
  • Operational execution and qualification: maintaining consistent chemistry and reliability supports ongoing supply into qualified refining processes, reducing the ease of displacement even in a commodity framework.

COMPETITIVE BENCHMARKING: Key competitors include Elkem, Eramet (ferroalloys), and major China-based ferrosilicon/silicomanganese producers.

Ferroglobe competes by emphasizing a broader alloy portfolio and by leveraging non-China production footprint(s) where delivered cost and customer qualification matter. In contrast, many China-based producers benefit from scale and integrated industrial ecosystems, while European competitors such as Elkem/Eramet often compete on product reliability and regional customer relationships but face their own constraints around power costs and decarbonization compliance.

🚀 Multi-Year Growth Drivers

Over a 5–10 year horizon, growth is most plausibly supported by structural demand for aluminum and steel chemistry support rather than by purely incremental share gains. Main drivers include:

  • Aluminum intensity of the economy: aluminum demand tied to transportation, grid infrastructure, and electrification supports ongoing use of silicon and related alloys in refining and casting.
  • Steel process optimization: manganese and silicon alloys remain embedded in steelmaking routes as manufacturers target performance improvements and impurity control.
  • Decarbonization-linked materials demand: industrial electrification and renewable buildouts increase demand for metals and thus the associated refining consumables that support higher-quality metal output.
  • Capacity discipline and industry cycle dynamics: ferroalloys remain supply-constrained at the margin when power economics and environmental compliance raise the cost base for inefficient capacity; a disciplined cost structure can support longer periods of favorable margins.

⚠ Risk Factors to Monitor

  • Energy and carbon regulation risk: production economics can be pressured by changes in electricity pricing and carbon compliance requirements, especially in energy-intensive, heavy-industry geographies.
  • Commodity price volatility: realized alloy prices and spreads can swing with global steel/aluminum output, trade flows, and inventory cycles.
  • Capex intensity and execution risk: maintaining and modernizing furnaces and environmental controls requires sustained capital discipline; disruptions can affect yields and utilization.
  • Input availability and substitution: raw-material constraints or changes in the mix of acceptable inputs can affect costs and production reliability.
  • Customer concentration and bargaining power: while qualification helps, large industrial customers can use multi-sourcing and procurement leverage during weaker market phases.

📊 Valuation & Market View

The market typically values ferroalloy producers on a cash-flow and cost-curve basis rather than on steady earnings quality, reflecting cyclicality. Common valuation approaches include:

  • EV/EBITDA and enterprise cash generation: sensitive to margin spreads, utilization, and input cost positions.
  • Net debt and liquidity: capital intensity and working-capital swings can dominate equity outcomes through the cycle.
  • Cost competitiveness metrics: investors focus on the ability to sustain a favorable delivered-cost position (power, logistics, and compliance) relative to peers.

Key drivers that move valuation are durable cost position versus peers, resilience under energy/carbon cost shocks, and evidence of maintaining stable utilization and product mix through the metal cycle.

🔍 Investment Takeaway

Ferroglobe’s long-term attractiveness rests on its ability to remain on a low-cost, logistics-supported production cost curve in an energy-intensive industry where compliance and power economics shape which producers can earn attractive margins over time. The competitive advantage is less about brand or software-like lock-in and more about geographic cost positioning, operational execution, and customer qualification, which together can support relative downside protection and cash generation through metal-cycle variability.


⚠ AI-generated — informational only. Validate using filings before investing.

📰 Market News & Coverage

15 Stories Available

Real-time institutional reporting and market updates for GSM.

seekingalpha.com2026-05-06

Ferroglobe PLC (GSM) Q1 2026 Earnings Call Transcript

Ferroglobe PLC (GSM) Q1 2026 Earnings Call Transcript

zacks.com2026-05-05

Globe Specialty Metals (GSM) Reports Q1 Loss, Tops Revenue Estimates

Globe Specialty Metals (GSM) came out with a quarterly loss of $0.07 per share in line with the Zacks Consensus Estimate. This compares to a loss of $0.2 per share a year ago.

globenewswire.com2026-05-05

Ferroglobe Reports First Quarter 2026 Financial Results

First Quarter Highlights Strong increase in ferroalloys due to trade measures and increasing steel production in the U.S. EU Trade Commissioner committed to helping the silicon metal industry Actively pursuing a potential restart of cost-competitive Venezuelan operations Expertise in critical materials unlocks new growth opportunities as the U.S. and EU policy pivots toward domestically anchored supply chains Reporting first quarter adjusted EBITDA of $3.3 million Ended the quarter with total cash of $96.4 million and net debt of $54.6 million Paid quarterly dividend of $0.015 per share on March 30; Next dividend of $0.015 payable on June 29 LONDON, May 05, 2026 (GLOBE NEWSWIRE) -- Ferroglobe PLC (NASDAQ: GSM) (“Ferroglobe”, the “Company”, or the “Parent”), a leading global producer of silicon metal, silicon-based and manganese-based specialty alloys, today announced financial results for the first quarter of 2026. Financial Highlights                                             %       % ($ in millions, except EPS)   Q1 2026   Q4 2025   Q/Q   Q1 2025   Y/Y                                 Sales   $ 347.7     $ 329.4       5.6 %   $ 307.2       13.2 % Net (loss) attributable to the parent   $ (7.1 )   $ (81.0 )     91.3 %   $ (66.5 )     89.4 % Adj.

zacks.com2026-04-28

Will Globe Specialty Metals (GSM) Report Negative Earnings Next Week? What You Should Know

Globe Specialty Metals (GSM) doesn't possess the right combination of the two key ingredients for a likely earnings beat in its upcoming report. Get prepared with the key expectations.

defenseworld.net2026-03-11

Ferroglobe (NASDAQ:GSM) Stock Crosses Above 200 Day Moving Average – Should You Sell?

Ferroglobe PLC (NASDAQ: GSM - Get Free Report)'s stock price passed above its 200-day moving average during trading on Tuesday. The stock has a 200-day moving average of $4.68 and traded as high as $4.96. Ferroglobe shares last traded at $4.84, with a volume of 1,174,033 shares. Analyst Upgrades and Downgrades Several analysts have recently

defenseworld.net2026-02-20

Ferroglobe Sees Unusually Large Options Volume (NASDAQ:GSM)

Ferroglobe PLC (NASDAQ: GSM - Get Free Report) saw some unusual options trading on Wednesday. Stock investors purchased 3,346 call options on the stock. This represents an increase of approximately 194% compared to the typical daily volume of 1,138 call options. Ferroglobe News Roundup Here are the key news stories impacting Ferroglobe this week: Positive Sentiment:

defenseworld.net2026-02-19

Ferroglobe (NASDAQ:GSM) Shares Gap Up Following Strong Earnings

Ferroglobe PLC (NASDAQ: GSM - Get Free Report) gapped up prior to trading on Wednesday after the company announced better than expected quarterly earnings. The stock had previously closed at $4.82, but opened at $5.12. Ferroglobe shares last traded at $4.9590, with a volume of 961,870 shares changing hands. The basic materials company reported ($0.06) earnings

fool.com2026-02-18

Why Ferroglobe Stock Was a Winner on Wednesday

Beset by challenges, the specialty metal company performed admirably well at the end of 2025. It beat diminished analyst expectations on both the top and bottom lines in its fourth quarter.

seekingalpha.com2026-02-18

Ferroglobe PLC (GSM) Q4 2025 Earnings Call Transcript

Ferroglobe PLC (GSM) Q4 2025 Earnings Call Transcript

zacks.com2026-02-17

Globe Specialty Metals (GSM) Reports Q4 Loss, Tops Revenue Estimates

Globe Specialty Metals (GSM) came out with a quarterly loss of $0.06 per share versus the Zacks Consensus Estimate of a loss of $0.07. This compares to earnings of $0.03 per share a year ago.

globenewswire.com2026-02-17

Ferroglobe Reports Fourth Quarter and Full Year 2025 Financial Results

Fourth Quarter and Full Year Highlights         EU ferroalloy safeguard measures implemented in November are reducing import pressure and supporting improving market conditions in Europe Positive momentum in U.S. silicon metal trade case, with encouraging preliminary antidumping and countervailing duty determinations Reporting fourth quarter adjusted EBITDA of $14.6 million New 10-year French energy contract reduces cost volatility and increases flexibility Ended the year with total cash of $123.0 million and net debt of $29.8 million, reflecting a strong balance sheet to support growth Announcing a 7% increase in the quarterly dividend to $0.015 per share, payable on March 30 LONDON, Feb. 17, 2026 (GLOBE NEWSWIRE) -- Ferroglobe PLC (NASDAQ: GSM) (“Ferroglobe”, the “Company”, or the “Parent”), a leading global producer of silicon metal, silicon-based and manganese-based specialty alloys, today announced financial results for the fourth quarter and full year 2025. Financial Highlights             %       %           % ($ in millions, except EPS)   Q4 2025   Q3 2025   Q/Q   Q4 2024   Y/Y   YTD 2025   YTD 2024   Y/Y                                                   Sales   $ 329.4     $ 311.7       5.7 %   $ 367.5       (10.4 )%   $ 1,335.1     $ 1,643.9     (18.8 )% Net (loss) income attributable to the parent   $ (81.0 )   $ (12.8 )     (531.9 )%   $ (28.1 )     (187.7 )%   $ (170.7 )   $ 23.5     (825.2 )% Adj.

globenewswire.com2026-02-02

Ferroglobe PLC Schedules Fourth Quarter and Full-Year 2025 Earnings Call for February 18, 2026

LONDON, Feb. 02, 2026 (GLOBE NEWSWIRE) -- Ferroglobe PLC (NASDAQ: GSM) announced today that it will issue fourth quarter and full-year 2025 financial results after the market closes on Tuesday, February 17, 2026, and will host the quarterly earnings call on Wednesday, February 18, 2026, at 8:30 a.m. Eastern Time.

zacks.com2026-01-09

New Strong Sell Stocks for January 9th

CBSH, GSM and GFF have been added to the Zacks Rank #5 (Strong Sell) List on January 9th, 2026.

defenseworld.net2026-01-08

Ferroglobe (NASDAQ:GSM) Share Price Crosses Above 200 Day Moving Average – Here’s What Happened

Ferroglobe PLC (NASDAQ: GSM - Get Free Report) passed above its two hundred day moving average during trading on Wednesday. The stock has a two hundred day moving average of $4.42 and traded as high as $4.92. Ferroglobe shares last traded at $4.84, with a volume of 716,290 shares trading hands. Analysts Set New Price

seekingalpha.com2026-01-05

Ferroglobe: Regulatory Moat With Battery Upside

Ferroglobe is positioned for a margin-driven recovery, leveraging cost reductions and upcoming trade barriers to expand its competitive moat. Despite a 19.4% sequential sales decline, GSM improved margins and maintained strong liquidity, with net debt nearly eliminated and continued shareholder returns. Imminent US/EU trade duties are expected to eliminate dumped imports, creating a volume void GSM is uniquely positioned to fill at higher pricing.

📊 AI Financial Analysis

Powered by StockMarketInfo
Earnings Data: Q Ending 2026-03-31

"GSM reported Q1 2026 revenue of $347.7M and net income of -$7.1M (EPS -$0.0375). Revenue increased 5.5% QoQ versus $329.4M in Q4 2025, and 13.2% YoY versus $307.2M in Q1 2025. Net income improved materially: -$7.1M in Q1 2026 versus -$81.0M in Q4 2025 (QoQ improvement of $73.9M) and versus -$66.5M in Q1 2025 (YoY improvement of $59.4M). Profitability remains inconsistent but has improved this quarter. Gross margin was 12.5% (up from -28.6% in Q4 2025, and below 16.7% in Q1 2025). Operating margin rose to -8.1% from -45.5% in Q4 2025, though it is still negative versus -18.1% in Q1 2025—suggesting ongoing cost pressure but better quarter-specific performance. Cash flow was weak: operating cash flow was -$7.3M and free cash flow -$17.7M, compared with operating cash flow -$6.2M and free cash flow -$20.0M in Q4. Balance sheet liquidity remains solid with cash & equivalents of $96.4M and total assets of $1.52B, though net debt rose to $84.3M (vs $170.2M net debt in Q4). Shareholder returns look constructive: the stock is up 29.9% over 1 year, supporting a positive total-return contribution despite ongoing losses and capital pressure."

Revenue Growth

Positive

Revenue rose 5.5% QoQ (329.4M -> 347.7M) and 13.2% YoY (307.2M -> 347.7M), indicating improving top-line momentum.

Profitability

Fair

Net income improved sharply QoQ and YoY (-7.1M vs -81.0M in Q4 and vs -66.5M in Q1). However, margins remain negative (net margin -2.0%; operating margin -8.1%) and gross margin is volatile (12.5% vs -28.6% in Q4 and 16.7% in Q1 last year).

Cash Flow Quality

Caution

Operating cash flow was negative (-7.3M) and free cash flow also negative (-17.7M). This reflects continued earnings-to-cash conversion issues despite slight sequential improvement from Q4 (FCF -20.0M -> -17.7M). Dividends are small (-$2.8M paid).

Leverage & Balance Sheet

Neutral

Balance sheet is sizable (total assets $1.52B) with stable equity ($670.5M). Liquidity is adequate (current ratio 1.43), and net debt improved versus Q4 (84.3M vs 170.2M), though leverage is not negligible (debt/equity ~0.27).

Shareholder Returns

Good

Stock performance is strong with 1-year change of +29.9% (momentum >20% boosting total return). Dividend yield is low (~0.36%), and buybacks are not evidenced (repurchases 0).

Analyst Sentiment & Valuation

Caution

No price target provided. Valuation multiples are difficult to interpret with losses (P/E negative, P/FCF negative). Current setup suggests the market is pricing an operational rebound more than current earnings power.

Disclaimer:This analysis is AI-generated for informational purposes only. Accuracy is not guaranteed and this does not constitute financial advice.

Fundamentals Overview

Loading fundamentals overview...

Q1 2026 shows volume momentum but margin pressure for Ferroglobe (GSM). Sales rose 6% to $348 million, driven by silicon-based alloys volumes up 18% to 61,000 tons and manganese alloys up 6% to 86,000 tons, both benefiting from trade safeguards. However, adjusted EBITDA fell to $3 million and free cash flow was -$16 million as working capital absorbed $13 million and costs rose in March due to Iran-related logistics, energy, and raw material inflation. Silicon metal remains the weak spot: revenue -13% and an adjusted EBITDA loss with a -3% margin, reflecting EU price declines and import aggression. Management expects pricing to strengthen in 2H 2026 as safeguard impacts deplete inventories, while noting surcharges (EUR 30/ton Europe, $40/ton U.S.) and higher costs in Q2 before a decline in later quarters. Strategically, Coreshell is progressing with pilot production and multiyear OEM sampling; meaningful silicon-metal demand is targeted around 2030–31.

AI IconGrowth Catalysts

  • Silicon-based alloys volumes +18% sequentially to highest level in nearly 5 years (61,000 tons) driven by ferrosilicon growth in Europe and North America
  • Manganese-based alloys volumes +6% to 86,000 tons supported by strengthened steel safeguards
  • EU steel safeguard measures expected to increase EU steel production by ~12–15 million tons annually (~10% growth) taking effect July 1, 2026
  • U.S. silicon metal cases final with antidumping/anti-circumvention duties and general tariff; pricing expected to improve in the second half of 2026 as excess inventory depletes

Business Development

  • Coreshell: co-led March bid round with $7 million investment; total investment $17 million; ~10% ownership stake
  • Coreshell: started production from 60 amp pilot plant and began selling to robotics and defense customers
  • Coreshell: signed multiyear sampling and qualification agreements with automotive OEM customers
  • Coreshell: signed a binding term sheet for a multiyear silicon metal supply agreement

AI IconFinancial Highlights

  • Total Q1 sales +6% to $348 million on +7% total volumes
  • Adjusted EBITDA declined to $3 million (despite volume growth); free cash flow -$16 million
  • Silicon metal revenue -13% to $84 million (6% volume decline, 7% price decline to $2,754/ton); silicon metal adjusted EBITDA loss -$2 million; -3% negative margin
  • Silicon-based alloys revenue +18% to $122 million; margins down 9 percentage points to 6% (adjusted EBITDA -$9 million sequentially) due to higher production/energy/raw material costs in Spain and the U.S.
  • Manganese-based alloys revenue +16% to $107 million; realized prices +9% to $1,250/ton and volumes +6% to 86,000 tons; adjusted EBITDA +$1 million to $10 million; 9% adjusted EBITDA margin; manganese ore inflation + logistics/energy costs offset price gains
  • Raw material and energy costs (excluding $5.5 million PP&A impact) fell to 66% of sales from 67% in Q4, but cost pressures in March increased due to conflict in Iran
  • Cash flow from operations -$6 million driven by $13 million working capital investment (inventory build and higher accounts receivable)

AI IconCapital Funding

  • Q1 dividend payout increased 7% to $3 million; paid March 30
  • Planned next dividend: $0.015 per share; payable June 29; record date June 22
  • Repurchased 5,000 shares in Q1 (modest)
  • CapEx: reduced to $11 million in Q1 (and prior quarter reduction of $3 million referenced)
  • Net debt increased to $55 million in Q1; management stated financial position remains solid to support growth
  • Coreshell strategic investment used to support near-term operating needs and long-term growth

AI IconStrategy & Ops

  • Flexible operating model: converted 3 silicon metal furnaces to ferrosilicon to capitalize on improved segments; Europe: 2 furnaces, U.S.: 1 conversion (U.S. conversion last year)
  • Additional conversions: converted 1 silicon furnace in the U.S. and 2 additional furnaces in Europe to ferrosilicon
  • Pricing discipline in Europe: decided not to participate in silicon metal at uneconomic prices; silicon metal volumes -6% sequential and EU silicon metal volumes -23%
  • Surcharges: implementing EUR 30/ton in Europe and $40/ton in the U.S. to pass through inbound/outbound logistics inflation; expects further price increases as current Europe ferrosilicon/silicon metal prices are 'unacceptable'

AI IconMarket Outlook

  • Management expectation for 2H 2026: pricing strength in silicon-based alloys as safeguards help deplete excess inventory
  • U.S. pricing expectations for ferrosilicon: more robust near-term tied to U.S. steel consumption recovery (Q1 showed U.S. steel growth)
  • Silicon metal: costs in silicon-based alloys expected to rise somewhat in Q2, then decline in 3Q and 4Q (logistics/transportation costs potentially increase due to Iran conflict)
  • Next update expected in August (per closing remarks)

AI IconRisks & Headwinds

  • Silicon metal under pressure in Europe from aggressive import pricing (China/Angola plus Malaysia, Kazakhstan, Laos); silicon metal excluded from recent EU safe protections; Norway is >50% of EU silicon metal imports
  • Ferrosilicon price consolidation inhibited by: high pre-safeguard inventories, Angola switching furnaces to ferrosilicon (dumping), and steelmakers converting low-priced silicon metal into ferrosilicon
  • Costs pressured in March by Iran conflict affecting energy, transportation, and raw materials; logistics costs expected to potentially increase in Q2 before improving later in 2H
  • EU silicon metal volume down 23% in Q1; EU index prices -6% QoQ and U.S. index prices -3% QoQ (pricing weakness despite stronger volumes)

Q&A: Analyst Interest

  • Critical minerals diversification: Management described a narrowed list from 100+ options to ~10 candidate critical materials, validated via board-level NPV work. CapEx ranges: some options require 0 CapEx (permits/raw material reliability), others single-digit millions, magnesium requiring a new plant.
  • Pricing power and cost pass-through: Management confirmed EUR 30/ton Europe surcharge and $40/ton U.S., citing freight, gas/energy, and raw material inflation. They attributed weak EU ferrosilicon pricing to inventory overhang pre-safeguards, Angola dumping (not safeguarded), and steelmakers converting silicon metal to ferrosilicon.
  • Coreshell ramp timing and economics: Management said battery volumes are not meaningful until OEMs qualify 60 amp pilot batteries between end-2027 and 2028; then business ramps toward ~70,000 tons of silicon metal for batteries by 2030–31. They cited Series B funding for a larger pilot plant to sample batteries; next-year Coreshell sales budget north of $60 million.

Sentiment: MIXED

Note: This summary was synthesized by AI from the GSM Q1 2026 earnings transcript. Financial data is complex; please verify all metrics against official SEC filings before making investment decisions.

📋 Official Regulatory 10-K / 10-Q SEC Filings

Direct authenticated documentation links to audited SEC database reports for GSM.

SEC EDGAR Live Feed
No recent 10-K available.
No recent 10-Q available.
Loading financial data and tables...
📁

SEC Filings (GSM)

© 2026 Stock Market Info — Ferroglobe PLC (GSM) Financial Profile