Global Water Resources, Inc.

Global Water Resources, Inc. (GWRS) Market Cap

Global Water Resources, Inc. has a market capitalization of $208.2M.

Price: $7.24

-0.07 (-0.96%)

Market Cap: 208.25M

NASDAQ · time unavailable

CEO: Ron L. Fleming

Sector: Utilities

Industry: Regulated Water

IPO Date: 2016-04-28

Website: https://www.gwresources.com

Global Water Resources, Inc. (GWRS) - Company Information

Market Cap: 208.25M|Sector: Utilities

Company Profile

Global Water Resources, Inc., a water resource management company, owns, operates, and manages regulated water, wastewater, and recycled water utilities primarily in metropolitan Phoenix, Arizona. As of December 31, 2020, it served approximately 74,048 people in approximately 27,630 homes. The company was founded in 2003 and is based in Phoenix, Arizona.

Analyst Sentiment

77%
Strong Buy

From 2 Active Polls

1Y Forecast: $12.50

▲ +72.7% Potential Upside

Consensus Target Metrics

Low Bound

$13

Median

$13

High Bound

$13

Average

$13

Price & Moving Averages

Loading chart...

🎯 Wall Street Analyst Intelligence Report

1-Year structural target targets, chart projections, and sentiment maps.

Average 1Y Target
$12.50
▲ +72.65% Upside
Low Target
$12.50
73% Risk
Median Target
$12.50
73% Mid
High Target
$12.50
73% Max
Consensus
Buy
2 / 4 Buys

Consensus Trend Projection

Trailing closures vs. 12-month metrics map.

Analyst Vote Distribution

Aggregate institutional coverage sentiment weights.

📊 Historical Valuation Multiples

Real-time Trailing Twelve Month (TTM) momentum side-by-side with discrete quarterly metrics.

Fiscal QuarterTTMQ1 2026Q4 2025Q3 2025Q2 2025Q1 2025Q4 2024Q3 2024Q2 2024
Period EndingTrailing 12MMar 31, 2026Dec 31, 2025Sep 30, 2025Jun 30, 2025Mar 31, 2025Dec 31, 2024Sep 30, 2024Jun 30, 2024
Market Cap ($M)208218228283280251279305294
Enterprise Value ($M)346356363400393344394413401
Price to Earnings Ratio (P/E)104.11-149.10-59.2941.2143.40106.28157.2226.0642.45
Price/Earnings-to-Growth Ratio (PEG)4.593.034.342.59
Price to Sales Ratio (P/S)3.6816.4316.8718.2419.6520.1721.0221.2921.75
Price to Book Ratio (P/B)2.472.592.643.163.653.255.856.246.17
Price to Free Cash Flow Ratio (P/FCF)-5.05-121.13-15.23-50.67-14.86-32.47-38.89-64.34-311.54
Enterprise Value to Sales (EV/Sales)26.7626.7825.7527.5827.6529.7628.8629.65
Enterprise Value to EBITDA (EV/EBITDA)14.3475.1473.6854.0055.7861.7264.9548.5856.85
Debt to Equity Ratio5.701.651.601.471.611.612.622.592.62
⚠️

Valuation Model Suspended

API Payload Error: Inverted or negative baseline Free Cash Flow margin detected (-16.5%).

Troubleshooting Notice: The upstream financial data supplier has uploaded corrupted or inverted baseline metrics for GWRS. The server sandbox cannot calculate an intrinsic value path from negative cash generation baselines.

📘 Full Research Report

ℹ️

AI-Generated Research: This report is for informational purposes only.

```html

📘 GLOBAL WATER RESOURCES INC (GWRS) — Investment Overview

🧩 Business Model Overview

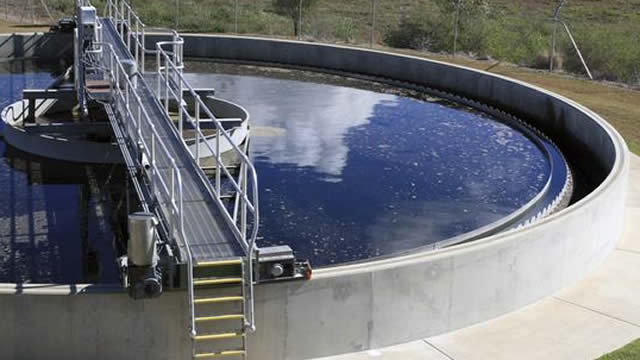
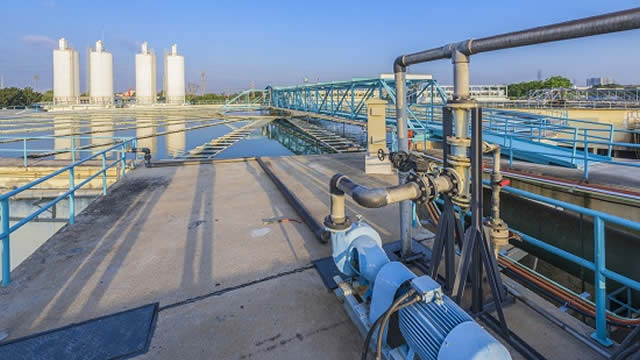
GLOBAL WATER RESOURCES INC operates as a water and wastewater utility provider serving specific service territories. The business typically earns revenue by (1) supplying treated water to residential, commercial, and municipal customers through regulated distribution assets, and (2) collecting, treating, and disposing of wastewater through treatment and conveyance systems. Because water service requires local infrastructure, the value chain is dominated by long-lived assets (pipelines, treatment capacity, lift stations, storage, and distribution mains) and by regulatory-approved tariffs that govern how revenues can be recovered.

The customer experience is inherently “supply-constrained” by geography: customers cannot practically switch providers without building redundant infrastructure. As a result, the operating model centers on maintaining service quality, meeting water quality/environmental standards, and executing capital programs to sustain and expand capacity in the approved footprint.

💰 Revenue Streams & Monetisation Model

  • Metered water service revenue: A largely recurring component driven by volumetric consumption and tariff structure.
  • Wastewater service revenue: Recurring fees tied to measured usage and/or billing determinants tied to discharge and treatment capacity.
  • Regulatory/contractual base charges and surcharges: Common in utility rate designs to recover fixed costs and specific compliance or infrastructure obligations.
  • Non-recurring items: Typically include connection-related fees and other pass-through or one-time charges that tend to be smaller relative to core service revenue.

Margin profile is primarily shaped by: (1) tariff outcomes and the ability to recover prudent operating and capital expenditures, (2) operational efficiency (chemicals, power, labor, and maintenance), and (3) system performance (water loss, treatment yield, and reliability). In this sector, “recurring + recoverability” is the dominant monetisation logic—growth often requires both infrastructure build-out and successful regulatory processing.

🧠 Competitive Advantages & Market Positioning

Moat: Regulatory franchise + geographic switching costs. In utility-like water and wastewater operations, service territories function as natural monopolies. Switching providers is not a customer decision in the ordinary sense; customers depend on the local distribution network, treatment capacity, and permitted service rights.

  • Switching costs (hard): Water and wastewater service is tied to embedded infrastructure and local piping. Customer churn is structurally low because alternative supply requires extensive, non-economical work.
  • Regulatory moats (durable): Tariffs, rate cases, and service obligations create a regulatory barrier to entry and a framework for revenue recovery, limiting direct competitive substitution.
  • Asset-specific know-how (practical barrier): Operating in a constrained service territory builds technical and compliance capabilities around treatment processes, permitted discharge limits, and system maintenance.

Competitive benchmarking (industry peers):

  • American Water Works Company (AWK) and Aqua America (WTRG): Larger, broader regulated operators with more extensive footprints and scale. Their breadth differs from GWRS’s more focused local service footprint, though the core economic model (regulated/territorial service) is similar.
  • Veolia Environnement (VE) and Suez (where active in utility concessions/services): Focus more on contracting and concessions across multiple geographies. GWRS’s advantage tends to align with ownership/operation inside defined service rights rather than concession bidding cycles alone.

Against large regulated peers, the differentiator is not scale economics alone; it is the combination of localized service rights, execution of infrastructure programs within constrained territories, and the ability to monetize growth through regulatory outcomes. Against concession-style providers, the contrast is the relative stability of a defined customer base tied to local systems versus bid-driven project flows.

🚀 Multi-Year Growth Drivers

  • Infrastructure replacement and capacity expansion: Aging pipelines, treatment upgrades, and compliance-driven work expand total capital programs and support revenue bases when tariffs allow recovery of prudent spend.
  • Growth in served demand within territories: Population growth and new development increase connections and throughput needs, supporting both volumetric revenue and related service fees.
  • Acquisition and consolidation of local systems: The fragmented nature of many regional water markets can allow disciplined roll-ups, subject to regulatory approvals and integration execution.
  • Water quality and environmental compliance tailwinds: Stricter standards and reliability requirements tend to raise capex needs across the sector; disciplined utilities with credible execution can convert compliance spend into regulated revenue recovery.
  • Operational improvements: Reductions in non-revenue water, better chemical/power efficiency, and maintenance optimization can support margin durability even when volumes fluctuate.

Over a 5–10 year horizon, the central TAM dynamic is not “addressable miles” alone; it is the steady need for treated water and wastewater services plus the capital intensity required to maintain compliance and reliability.

⚠ Risk Factors to Monitor

  • Regulatory execution risk: Rate outcomes, timing of rate approvals, and the scope of eligible costs can affect cash flow and earnings visibility.
  • Capital intensity and funding risk: Water systems require continuous capex. Cost overruns, higher financing costs, or constrained access to capital can pressure returns.
  • Operational and compliance risk: Treatment performance failures, contamination events, and permit non-compliance can trigger remediation costs and reputational/regulatory consequences.
  • Demand variability and weather impacts: Conservation measures and drought conditions can reduce usage volumes, potentially offset by tariff design but still affecting financial results.
  • Acquisition/integration risk: Integrating assets, systems, and operations across service territories requires technical consistency and successful regulatory processing.

📊 Valuation & Market View

Market valuation for water utilities and utility-like operators typically reflects the stability of regulated cash flows and the sustainability of returns on rate base rather than pure growth multiples. Common frameworks include EV/EBITDA and multiples of operating cash flow (often alongside dividend/FFO-style metrics, depending on the market participant). Key valuation drivers include:

  • Regulatory outcome quality: The likelihood that prudent capital projects translate into recoverable rate base.
  • Capex efficiency: Execution discipline that supports reliability without excessive cost drift.
  • Growth cadence: Rate-recognized growth in customers and/or throughput aligned with regulatory approvals.
  • Leverage and credit profile: Utility cash flows can be resilient, but financing conditions and covenants influence equity outcomes.

In this sector, multiple expansion tends to be less about aggressive growth expectations and more about improved confidence in regulatory recoverability, capital discipline, and dependable operating performance.

🔍 Investment Takeaway

GLOBAL WATER RESOURCES INC offers an investment case rooted in structural switching costs and regulatory franchise characteristics typical of localized water and wastewater utilities. The core durability stems from geography-driven network dependence, while long-term value creation depends on executing capital programs for reliability and compliance and converting infrastructure spend into regulated revenue recoverability. The main disagreement with the market would be whether tariff outcomes and project execution can sustain attractive risk-adjusted returns through cycles of capex and regulatory review.


⚠ AI-generated — informational only. Validate using filings before investing.

```

📰 Market News & Coverage

15 Stories Available

Real-time institutional reporting and market updates for GWRS.

seekingalpha.com2026-06-05

Dividend Champion, Contender, And Challenger Highlights: Week Of June 7

A weekly summary of dividend activity for Dividend Champions, Contenders, and Challengers. Companies which changed their dividends. Companies with upcoming ex-dividend dates.

globenewswire.com2026-05-29

Global Water Resources Declares Monthly Dividend

PHOENIX, May 29, 2026 (GLOBE NEWSWIRE) -- Global Water Resources, Inc. (NASDAQ: GWRS), a pure-play water resource management company, has declared under its dividend policy a monthly cash dividend in the amount of $0.02533 per common share (an annual dividend rate of $0.30396 per share).

globenewswire.com2026-05-29

Global Water Resources Declares Monthly Dividend

PHOENIX, May 29, 2026 (GLOBE NEWSWIRE) -- Global Water Resources, Inc. (NASDAQ: GWRS), a pure-play water resource management company, has declared under its dividend policy a monthly cash dividend in the amount of $0. 02533 per common share (an annual dividend rate of $0. 30396 per share). The dividend will be payable on June 30, 2026, to holders of record at the close of business on June 15, 2026.

globenewswire.com2026-05-18

Global Water Resources Reports Results of Director Election

PHOENIX, May 18, 2026 (GLOBE NEWSWIRE) -- Global Water Resources Inc., ("the Company"), (NASDAQ: GWRS), a pure-play water resource management company, announced that the nominees listed in the Proxy Statement, dated March 31, 2026, for the 2026 Annual Meeting of Stockholders ("the Meeting") were selected as Directors of the Company.

seekingalpha.com2026-05-14

Global Water Resources, Inc. (GWRS) Q1 2026 Earnings Call Prepared Remarks Transcript

Global Water Resources, Inc. (GWRS) Q1 2026 Earnings Call Prepared Remarks Transcript

marketbeat.com2026-05-14

Global Water Resources Q1 Earnings Call Highlights

Global Water Resources NASDAQ: GWRS reported higher first-quarter revenue but swung to a loss as increased depreciation, operating costs and interest expense weighed on results, management said on the company's May 14 earnings call.

zacks.com2026-05-13

Global Water Resources, Inc. (GWRS) Reports Q1 Loss, Tops Revenue Estimates

Global Water Resources, Inc. (GWRS) came out with a quarterly loss of $0.01 per share versus the Zacks Consensus Estimate of a loss of $0.02. This compares to earnings of $0.02 per share a year ago.

globenewswire.com2026-05-13

Global Water Resources Reports First Quarter 2026 Results

PHOENIX, May 13, 2026 (GLOBE NEWSWIRE) -- Global Water Resources, Inc. (NASDAQ: GWRS), a pure-play water resource management company, reported results for the first quarter ended March 31, 2026. Unless otherwise noted, all comparisons are to the corresponding period in the prior year. The company will hold a conference call at 1:00 p.m. Eastern time tomorrow to discuss the results (see dial-in information below).

globenewswire.com2026-04-30

Global Water Resources Declares Monthly Dividend

PHOENIX, April 30, 2026 (GLOBE NEWSWIRE) -- Global Water Resources, Inc. (NASDAQ: GWRS), a pure-play water resource management company, has declared under its dividend policy a monthly cash dividend in the amount of $0.02533 per common share (an annual dividend rate of $0.30396 per share). The dividend will be payable on May 29, 2026, to holders of record at the close of business on May 15, 2026.

globenewswire.com2026-04-29

Global Water Resources Files Settlement Agreement for GW-Santa Cruz and GW-Palo Verde Rate Cases

PHOENIX, April 29, 2026 (GLOBE NEWSWIRE) -- Global Water Resources, Inc. (NASDAQ: GWRS), a pure-play water resource management company, has filed a settlement agreement with the Arizona Corporation Commission (ACC) related to the previously filed general rate cases for Global Water - Santa Cruz Water Company, Inc.

globenewswire.com2026-04-29

Global Water Resources Files Settlement Agreement for GW-Santa Cruz and GW-Palo Verde Rate Cases

If Approved, Settlement Agreement Provides $2.3 Million in Additional Net Revenue for GW-Santa Cruz to Support Infrastructure Investment If Approved, Settlement Agreement Provides $2.3 Million in Additional Net Revenue for GW-Santa Cruz to Support Infrastructure Investment

defenseworld.net2026-04-23

Global Water Resources (NASDAQ:GWRS) Stock Price Crosses Below 50 Day Moving Average – What’s Next?

Global Water Resources, Inc. (NASDAQ: GWRS - Get Free Report)'s stock price crossed below its fifty day moving average during trading on Wednesday. The stock has a fifty day moving average of $8.03 and traded as low as $7.26. Global Water Resources shares last traded at $7.33, with a volume of 76,532 shares trading hands.

globenewswire.com2026-04-22

Global Water Resources Sets First Quarter 2026 Conference Call for Thursday, May 14, 2026 at 1:00 p.m. ET

PHOENIX, Ariz., April 22, 2026 (GLOBE NEWSWIRE) -- Global Water Resources, Inc. (NASDAQ: GWRS), a pure-play water resource management company, will hold a conference call on Thursday, May 14, 2026 at 1:00 p.m. Eastern time to discuss results for the first quarter ended March 31, 2026. The financial results will be issued in a press release prior to the call. Global Water Resources management will host the presentation, followed by a question-and-answer period.

globenewswire.com2026-03-31

Global Water Resources Declares Monthly Dividend

PHOENIX, March 31, 2026 (GLOBE NEWSWIRE) -- Global Water Resources, Inc. (NASDAQ: GWRS), a pure-play water resource management company, has declared under its dividend policy a monthly cash dividend in the amount of $0.02533 per common share (an annual dividend rate of $0.30396 per share).

defenseworld.net2026-03-30

Short Interest in Global Water Resources, Inc. (NASDAQ:GWRS) Expands By 53.6%

Global Water Resources, Inc. (NASDAQ: GWRS - Get Free Report) was the target of a significant increase in short interest in March. As of March 13th, there was short interest totaling 324,121 shares, an increase of 53.6% from the February 26th total of 211,080 shares. Currently, 2.5% of the company's stock are short sold. Based on

📊 AI Financial Analysis

Powered by StockMarketInfo
Earnings Data: Q Ending 2026-03-31

"GWRS reported Q1 2026 revenue of $13.29M and net income of -$0.37M (EPS -$0.01). Versus Q1 2025, revenue increased 6.6% ($13.29M vs. $12.46M) but net income deteriorated meaningfully from +$0.59M to -$0.37M (a swing of -$0.96M YoY). QoQ, revenue edged down -1.9% ($13.29M vs. $13.54M), while net income improved from -$0.96M to -$0.37M (+$0.60M sequentially). Profitability is highly volatile across the last four quarters: margins were strong in Q2–Q3 2025 (net margin ~11%), but in Q4 2025 and Q1 2026 the company returned to losses (net margin -7.1% in Q4 and -2.8% in Q1). Operating cash flow turned positive at $4.48M in Q1 2026, but free cash flow remained negative at -$1.80M due to heavy capex (investments in PP&E -$6.28M). Balance sheet resilience looks mixed: total assets were roughly stable QoQ (~$485M), equity declined slightly, and leverage is present (short-term debt and long-term debt elevated), while liquidity (cash) fell to $1.8M from $4.1M. Shareholder returns are weak: the stock is down -23.6% over 1 year, with modest dividend yield (~1%). Analyst consensus target ($12.50) is well above the current price ($7.72), implying upside but near-term fundamentals remain pressured."

Revenue Growth

Neutral

Revenue grew +6.6% YoY in Q1 2026 (to $13.29M) but slipped -1.9% QoQ versus Q4 2025 ($13.54M), indicating modest top-line momentum with softness sequentially.

Profitability

Neutral

Net income declined to -$0.37M in Q1 2026 from +$0.59M YoY and remained loss-making QoQ (-$0.96M to -$0.37M is an improvement, but still negative). Margins have contracted sharply from Q2–Q3 2025 (net margin ~11%) to Q1 2026 (-2.8%), showing unstable earnings power.

Cash Flow Quality

Caution

Operating cash flow rebounded to +$4.48M in Q1 2026, but free cash flow was -$1.80M due to substantial capex/investments (-$6.28M). Dividends continued (~-$2.19M in cash dividends), but with losses the payout is not supported by earnings.

Leverage & Balance Sheet

Caution

Total assets were roughly stable QoQ (~$485M), but cash dropped to $1.8M while debt rose vs Q4 (short-term + long-term; total debt ~$7.5M shown in balance snapshot and net debt ~$5.7M). Equity slightly declined to ~$84.2M, suggesting some stress but not a collapse in capital base.

Shareholder Returns

Neutral

Total shareholder return is likely negative given the -23.6% 1-year price change. Dividend yield is small (~1%), and losses reduce confidence in sustainability; no buyback support is visible in the cash flow.

Analyst Sentiment & Valuation

Neutral

Street consensus target is $12.50 vs. $7.72 current (~62% implied upside). Despite operational volatility, the valuation backdrop appears supportive, though the fundamentals in the latest quarter remain weak.

Disclaimer:This analysis is AI-generated for informational purposes only. Accuracy is not guaranteed and this does not constitute financial advice.

Fundamentals Overview

Loading fundamentals overview...

GWRS reported Q1 2026 revenue of $13.3M (+6.7% YoY), driven mainly by the July 2025 acquisition of 7 Tucson water systems, organic connection growth, and higher GW-Farmers rates. The quarter was loss-making (-$0.4M; -$0.01 diluted EPS) as operating expenses rose 15.1% to $12.9M, largely from higher depreciation/amortization/accretion (~+$0.9M) tied to 2025 capital projects and from O&M increases (~+$0.5M) including rising medical costs, purchased power, and wastewater disposal tied to startup of two new reclamation facilities. Adjusted EBITDA held flat at $5.6M, suggesting cash-earnings resilience versus GAAP distortions. The key forward lever is regulatory timing: a unanimous settlement for GW-Santa Cruz and GW-Palo Verde sets new rates effective November 1, 2026, with GW-Palo Verde’s current review withdrawn and a new wastewater filing planned for 2027/implementation in 2028. Management also expects additional rate-case updates in August 2026.

AI IconGrowth Catalysts

  • Organic active service connection growth in Phoenix area despite slower permitting; 2.6% Y/Y organic increase in active connections
  • Rate base earnings ramp from recommissioning Southwest Plant water reclamation facility and other 2025 commissioned projects
  • Regulatory settlement enabling GW-Santa Cruz to move to higher rates effective November 1, 2026

Business Development

  • Acquisition of 7 water systems from the City of Tucson (July 2025), cited as a primary driver of Q1 2026 revenue growth
  • Future rate review filings anticipated for Farmers division, Saguaro division, Ocotillo division, and Santa Cruz division (timing updates in August 2026)

AI IconFinancial Highlights

  • Revenue: $13.3M in Q1 2026, +$0.8M (+6.7%) vs Q1 2025; increase attributed to Tucson acquisition, organic connection growth, and higher rates in GW-Farmers
  • Operating expenses: $12.9M, up ~$1.7M (+15.1%) vs $11.2M prior year; depreciation/amortization/accretion up ~$0.9M driven by additional depreciable fixed assets placed in service from 2025 capital program
  • O&M up ~$0.5M primarily from rising medical expenses, higher purchased power tied to newly operational plant, and wastewater disposal costs linked to startup of 2 new wastewater reclamation facilities
  • Net loss: -$0.4M (-$0.01 diluted EPS) vs net income $0.6M ($0.02 diluted EPS) prior year
  • Adjusted EBITDA: $5.6M unchanged vs Q1 2025
  • Other expense: $0.9M vs $0.5M prior year, driven by higher interest expense, lower interest income, and reduced income associated with Buckeye growth premiums
  • No explicit bps margin change disclosed; expense changes provided in $ and % terms

AI IconCapital Funding

    AI IconStrategy & Ops

    • Reduced pace of capital investments in 2026 while still funding $6.3M of infrastructure improvements in existing utilities
    • Service connection growth: active service connections increased 5.7% to 68,885 as of March 31, 2026
    • Operational startup impacts: startup-related wastewater disposal expenses and purchased power associated with newly operational plant cited as drivers of O&M increase

    AI IconMarket Outlook

    • Rate settlement effective date: November 1, 2026 for GW-Santa Cruz and GW-Palo Verde changes
    • GW-Palo Verde: settlement withdraws the current rate review; management anticipates filing a new GW-Palo Verde wastewater rate review request in 2027 with estimated implementation in 2028

    AI IconRisks & Headwinds

    • Near-term earnings pressure from depreciation and other historical test-year expense effects tied to required rate-base investments
    • Slower single-family dwelling permits in Phoenix Greater Metro area: Q1 2026 permits 5,204, -18.8% vs Q1 2025; Maricopa permits 157, -16.5% vs Q1 2025
    • Incremental operating cost headwinds: rising medical costs, higher purchased power for newly operational assets, and wastewater disposal costs from startup of 2 new reclamation facilities
    • Financial headwind noted in interest dynamics and Buckeye growth premium income decline within other expense

    Q&A: Analyst Interest

      Sentiment: MIXED

      Note: This summary was synthesized by AI from the GWRS Q1 2026 earnings transcript. Financial data is complex; please verify all metrics against official SEC filings before making investment decisions.

      📋 Official Regulatory 10-K / 10-Q SEC Filings

      Direct authenticated documentation links to audited SEC database reports for GWRS.

      SEC EDGAR Live Feed
      Loading financial data and tables...
      📁

      SEC Filings (GWRS)

      © 2026 Stock Market Info — Global Water Resources, Inc. (GWRS) Financial Profile