Hovnanian Enterprises, Inc.

Hovnanian Enterprises, Inc. (HOV) Market Cap

Hovnanian Enterprises, Inc. has a market capitalization of $628.4M.

Price: $123.90

-5.46 (-4.22%)

Market Cap: 628.38M

NYSE · time unavailable

CEO: Ara K. Hovnanian

Sector: Consumer Cyclical

Industry: Residential Construction

IPO Date: 1983-09-07

Website: https://www.khov.com

Hovnanian Enterprises, Inc. (HOV) - Company Information

Market Cap: 628.38M|Sector: Consumer Cyclical

Company Profile

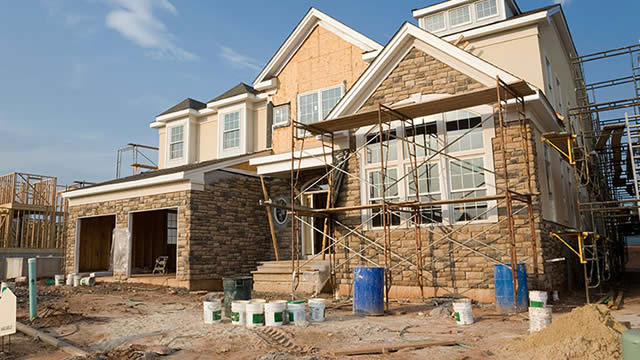
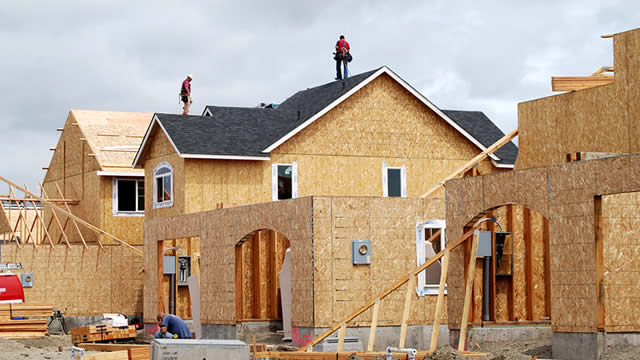
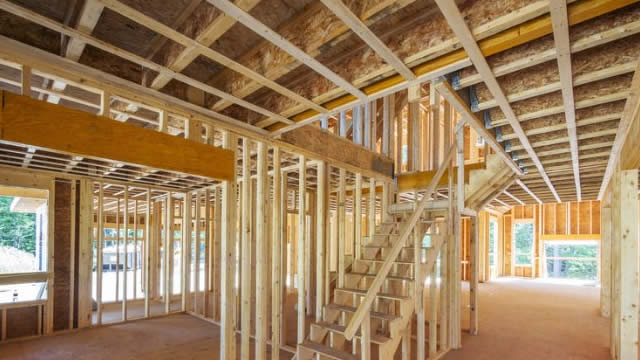
Hovnanian Enterprises, Inc. is a leading company focused on the entire process of developing residential properties across the United States. This includes everything from the initial design and construction to the marketing and eventual sale of homes. Their diverse housing portfolio encompasses traditional single-family detached houses, attached townhomes and condominiums, urban infill developments, and dedicated active adult communities. These active lifestyle communities often come equipped with various amenities such as clubhouses, swimming pools, tennis courts, children's play areas (tot lots), and ample open spaces. Hovnanian caters to a wide array of homebuyers. Their clientele includes individuals purchasing their very first home, first-time and second-time move-up buyers seeking larger residences, luxury home seekers, those desiring an active lifestyle, and empty nesters. In addition to home construction, the company also assists its customers by offering mortgage loans and title insurance services. Hovnanian Enterprises was founded in 1959 and operates from its corporate headquarters located in Matawan, New Jersey.

Analyst Sentiment

0%
Underperform

From 1 Active Polls

Consensus Target Matrix

Data feed parsing pending...

Price & Moving Averages

Loading chart...

🎯 Wall Street Analyst Intelligence Report

1-Year structural target targets, chart projections, and sentiment maps.

Average 1Y Target
$130.09
▲ +5.00% Upside
Low Target
$92.93
-25% Risk
Median Target
$126.38
2% Mid
High Target
$154.88
25% Max
Consensus
Hold
0 / 12 Buys

Consensus Trend Projection

Trailing closures vs. 12-month metrics map.

Analyst Vote Distribution

Aggregate institutional coverage sentiment weights.

📊 Historical Valuation Multiples

Real-time Trailing Twelve Month (TTM) momentum side-by-side with discrete quarterly metrics.

Fiscal QuarterTTMQ2 2026Q1 2026Q4 2025Q3 2025Q2 2025Q1 2025Q4 2024Q3 2024
Period EndingTrailing 12MApr 30, 2026Jan 31, 2026Oct 31, 2025Jul 31, 2025Apr 30, 2025Jan 31, 2025Oct 31, 2024Jul 31, 2024
Market Cap ($M)6287267317787646218631,1421,359
Enterprise Value ($M)1,2521,3491,3211,4351,5591,5121,7501,9502,278
Price to Earnings Ratio (P/E)31.93-61.1110.06-50.1013.969.178.533.254.95
Price/Earnings-to-Growth Ratio (PEG)-10.82-23.150.844.810.092.45
Price to Sales Ratio (P/S)0.221.091.160.950.950.901.281.171.88
Price to Book Ratio (P/B)0.970.880.870.940.920.761.061.431.93
Price to Free Cash Flow Ratio (P/FCF)2.32-10.305.534.7416.7038.83-14.4910.25-14.18
Enterprise Value to Sales (EV/Sales)2.022.091.751.952.202.601.993.15
Enterprise Value to EBITDA (EV/EBITDA)11.6272.5429.93132.0045.6739.0833.8615.6021.57
Debt to Equity Ratio5.791.131.111.121.131.181.211.271.48

📘 Full Research Report

ℹ️

AI-Generated Research: This report is for informational purposes only.

📘 HOVNANIAN ENTERPRISES INC CLASS A (HOV) — Investment Overview

🧩 Business Model Overview

Hovnanian Enterprises is a residential homebuilder. The value chain centers on acquiring lots (or controlling development rights), building homes, and selling primarily through closed-door and contract-driven home sales in active communities. The business converts land and construction capacity into homes, with profitability driven by (i) timing and pricing of deliveries, (ii) development and construction execution, and (iii) cost control across land, labor, materials, and overhead.

Unlike recurring-revenue models, homebuilding is inherently project-based: inventory (finished homes and work-in-process) and lot pipeline determine supply, while demand and pricing are shaped by macro conditions such as mortgage rates and household formation.

💰 Revenue Streams & Monetisation Model

Revenue is dominated by home sales and related contractual revenue at closing, with most monetisation tied to the completion and delivery of homes rather than long-duration subscription streams. Gross margin is influenced by:

  • Pricing/market environment: sale prices and the ability to maintain pricing discipline during demand shifts.
  • Cost and productivity: construction costs, labor efficiency, and material procurement.
  • Land and development economics: how well land basis, entitlements, and development overhead are absorbed over the community’s home count.
  • Inventory mix: the proportion of finished goods versus under-construction homes affects near-term margin volatility.

Because the business monetises at closing, operating leverage can be meaningful: fixed overhead and community overhead get spread over fewer or more deliveries depending on demand.

🧠 Competitive Advantages & Market Positioning

Homebuilding typically exhibits fewer traditional “moats” than software or regulated industries. The durable edge for a builder is often operational and land-cycle driven rather than structural switching costs. For Hov, the most relevant competitive advantages are execution and land pipeline quality—elements that can support cost containment and build pace when market conditions deteriorate.

  • Land-cycle competence (cost and capital discipline): Developing communities with favorable lot economics, managing land basis, and pacing starts can reduce downside during downturns.
  • Local/regional execution: Repeated operations in targeted markets can improve trade relationships, permitting familiarity, and procurement logistics—supporting construction productivity and tighter schedules.
  • Scale benefits, though not absolute: Larger competitors can access procurement leverage and spread overhead more effectively; Hov’s advantage is more often disciplined throughput and focused community selection than broad, national scale.

Competitive benchmarking:

  • D.R. Horton (DHI) and Lennar (LEN) operate with substantially larger scale, which can provide procurement and overhead advantages.
  • PulteGroup (PHM) competes with strong market presence and broad product offering.

Hov’s positioning tends to emphasize targeted market focus and cost-controlled execution rather than matching the largest builders’ scale advantage. The competitive contest is therefore often won through (i) land/lot selection and (ii) construction execution speed and cost management across cycle conditions.

🚀 Multi-Year Growth Drivers

Over a 5–10 year horizon, residential construction demand is supported by several structural drivers that shape total addressable market (TAM) for incremental housing supply:

  • Demographic household formation: Growth in the number of households expands the base demand for housing units.
  • Chronic supply constraints: Development time, land availability, permitting processes, and build-rate limits can restrict supply responsiveness, supporting long-run demand-supply balance.
  • Replacement and “move-up” dynamics: Housing stock attrition and household mobility create ongoing turnover demand even if net household formation fluctuates.
  • Affordability-driven product mix: Buyers often trade down to more affordable communities or product types during financing stress, keeping market segments investable for builders with the right lot and product locations.
  • Operational learning curve: Builders that sustain disciplined procurement, labor management, and schedule control can preserve margins through cost inflation cycles and demand variability.

For Hov, the long-term opportunity is less about expanding a recurring revenue base and more about consistently executing land-to-home conversion while managing the balance-sheet and inventory cycle so that the firm can remain active when industry pricing dynamics reset.

⚠ Risk Factors to Monitor

  • Interest-rate and mortgage affordability sensitivity: Housing demand and pricing are highly correlated with mortgage availability and rate levels.
  • Construction and material cost volatility: Labor availability and materials procurement can compress margins, especially when price adjustments lag cost inflation.
  • Inventory and land impairments: Poor land-cycle selection or overexposure to a weakening market can lead to write-downs and liquidity stress.
  • Execution risk: Construction delays, quality issues, and change orders can erode gross margin and increase carrying costs.
  • Local regulatory constraints: Permitting timelines, zoning requirements, and impact fees can delay starts and raise all-in development costs.
  • Credit and liquidity conditions: The industry’s capital intensity makes access to financing and working capital management critical across the cycle.

📊 Valuation & Market View

The market typically values homebuilders with frameworks that reflect cyclicality and balance-sheet risk rather than stable subscription cash flows. Common lenses include:

  • Price-to-book / NAV sensitivity: Because inventory and land holdings can be marked down during weak housing markets, book value quality and impairments matter.
  • EV/EBITDA (cycle-adjusted): Earnings can swing with delivery volumes and pricing; investors often focus on normalized margins and capital efficiency.
  • Balance-sheet liquidity and land pipeline composition: Overweight exposure to higher-basis land or elevated work-in-process can amplify downside risk.

Key valuation drivers typically include (i) the ability to protect margin in changing pricing environments, (ii) delivery pacing and inventory turnover, and (iii) preservation of capital discipline across the housing cycle.

🔍 Investment Takeaway

Hovnanian’s long-term investment case rests on operational execution and disciplined land-to-home conversion in a cyclical industry. The lack of durable switching costs is offset by practical advantages that matter in downturns: lot economics, construction productivity, and balance-sheet management that can help the firm remain competitive when pricing and demand reset. The primary investor focus should be evidence of margin resilience, inventory quality, and capital discipline through housing-cycle volatility.


⚠ AI-generated — informational only. Validate using filings before investing.

📰 Market News & Coverage

15 Stories Available

Real-time institutional reporting and market updates for HOV.

globenewswire.com2026-07-01

Al Tahaluf Rebrands to HOV Global as K. Hovnanian Middle East Expands its Investment in Saudi Arabia

K. Hovnanian Middle East begins its next chapter as the Saudi developer deepens its investment in the Kingdom, reinforcing its long-term commitment to Saudi Arabia and Vision 2030 K. Hovnanian Middle East begins its next chapter as the Saudi developer deepens its investment in the Kingdom, reinforcing its long-term commitment to Saudi Arabia and Vision 2030

marketbeat.com2026-05-21

Hovnanian Enterprises Q2 Earnings Call Highlights

Hovnanian Enterprises NYSE: HOV reported second-quarter fiscal 2026 results that management said reflected “solid execution” in a volatile housing market, with profitability coming in at the high end or above several internal targets despite weaker year-over-year delivery volume and elevated incentives.

wsj.com2026-05-21

Hovnanian Swings to Loss as Housing Market Remains Frozen

The home builder posted a loss of $284,000 for its second quarter ended April 30, compared with a profit of $19.7 million a year earlier.

globenewswire.com2026-05-21

Hovnanian Enterprises Reports Fiscal 2026 Second Quarter Results

Met or Exceeded Guidance on Nearly All Metrics Provided Gross Margins Improved Sequentially Following First Quarter Trough 2% Year-Over-Year Increase in Total Domestic Contracts $442 Million of Total Liquidity Well in Excess of Our Target Range

globenewswire.com2026-05-07

Hovnanian Enterprises Announces Second Quarter Fiscal 2026 Earnings Release and Conference Call

MATAWAN, N.J., May 07, 2026 (GLOBE NEWSWIRE) -- Hovnanian Enterprises, Inc. (NYSE: HOV), a leading national homebuilder, will release financial results for the second quarter ended April 30, 2026, the morning of Thursday, May 21, 2026. The Company will webcast its second quarter earnings conference call at 11:00 a.m. (ET) on Thursday, May 21, 2026.

seekingalpha.com2026-05-02

Why Hovnanian Enterprises Remains Homes For A Large Chunk Of My Assets

Hovnanian Enterprises remains a 'strong buy' despite near-term housing market headwinds, driven by long-term supply shortages and population growth. HOV's current financials reflect industry-wide weakness: Q2 revenue is forecasted below last year, with EBITDA expected to fall from $61.3M to $30–40M. Valuation remains attractive versus peers on cash flow and EV/EBITDA, while management's disciplined deleveraging and extended debt maturities reduce risk.

prnewswire.com2026-04-08

GTIS Partners and Hovnanian Enterprises Announce Closing of $200 Million Homebuilding Joint Venture Portfolio Bringing Total Portfolio To $1.5 Billion

NEW YORK, April 8, 2026 /PRNewswire/ -- GTIS Partners LP ("GTIS"), a global real estate investment firm with a focus on residential and industrial/logistics investments, and Hovnanian Enterprises, Inc. (NYSE: HOV), a leading national homebuilder, today announced the closing of a $200 million joint venture to develop, construct and sell homes across a diversified portfolio of for-sale homebuilding communities. Under the joint venture, GTIS through its investment vehicles is investing $150 million of equity capital alongside Hovnanian contributing $50 million, or 25%, of the capital requirement for total build out costs projected at approximately $545 million representing $617 million in home value, raising the total home value of the GTIS-Hovnanian homebuilding joint venture to $8 billion.

defenseworld.net2026-03-27

Hovnanian Enterprises (NYSE:HOV) & Sekisui House (OTCMKTS:SKHSY) Critical Analysis

Sekisui House (OTCMKTS:SKHSY - Get Free Report) and Hovnanian Enterprises (NYSE: HOV - Get Free Report) are both construction companies, but which is the superior investment? We will compare the two companies based on the strength of their risk, analyst recommendations, valuation, profitability, dividends, institutional ownership and earnings. Profitability This table compares Sekisui House and Hovnanian

seekingalpha.com2026-03-02

Hovnanian Enterprises, Inc. (HOV) Presents at J.P. Morgan 2026 Global Leveraged Finance Conference Transcript

Hovnanian Enterprises, Inc. (HOV) Presents at J.P. Morgan 2026 Global Leveraged Finance Conference Transcript

defenseworld.net2026-03-02

Hovnanian Enterprises Q1 Earnings Call Highlights

Hovnanian Enterprises (NYSE: HOV) reported fiscal 2026 first-quarter results that management said met or exceeded the company's previously issued guidance across all key metrics, despite what executives described as a challenging housing backdrop marked by affordability pressure and muted consumer confidence. First-quarter results versus guidance and prior year Chairman and CEO Ara Hovnanian said first-quarter total

defenseworld.net2026-02-27

Head to Head Analysis: Sekisui House (OTCMKTS:SKHSY) vs. Hovnanian Enterprises (NYSE:HOV)

Hovnanian Enterprises (NYSE: HOV - Get Free Report) and Sekisui House (OTCMKTS:SKHSY - Get Free Report) are both construction companies, but which is the superior stock? We will compare the two companies based on the strength of their profitability, valuation, earnings, analyst recommendations, dividends, institutional ownership and risk. Analyst Ratings This is a summary of recent

globenewswire.com2026-02-25

Hovnanian Enterprises to Present at J.P. Morgan's 2026 Global Leveraged Finance Conference

MATAWAN, N.J., Feb. 25, 2026 (GLOBE NEWSWIRE) -- Hovnanian Enterprises, Inc. (NYSE: HOV), a leading national homebuilder, announced that senior management will be hosting a fireside chat at J.P. Morgan's 2026 Global Leveraged Finance Conference taking place on Monday, March 2, 2026, at 11:00 am ET.

seekingalpha.com2026-02-25

Hovnanian Enterprises, Inc. (HOV) Q1 2026 Earnings Call Transcript

Hovnanian Enterprises, Inc. (HOV) Q1 2026 Earnings Call Transcript

globenewswire.com2026-02-25

Hovnanian Enterprises Reports Fiscal 2026 First Quarter Results

Met or Exceeded All Guidance Metrics Provided 5% Year-Over-Year Increase in Domestic Consolidated Communities $471 Million of Total Liquidity Domestic Contracts, Including Unconsolidated Joint Ventures, Increased 11% Year-Over-Year for January and 13% for February to Date over the Same Period Last Year

seekingalpha.com2026-02-18

Hovnanian: Lukewarm About This Small-Cap Homebuilder As It Approaches Q1 Earnings

HOV, a small-cap representative of the homebuilding market, has lagged its peers since our last coverage in August 2025 but now faces a decisive earnings event on the 25th of Feb. Investors would do well to curtail any buoyancy, as Q1 is seasonally weak, HOV has a questionable earnings track record, and gross margin and SG&A trends are expected to worsen. While Q1 is unlikely to have too many highs, guidance, especially for H2-26, has the potential to restimulate spirits.

📊 AI Financial Analysis

Powered by StockMarketInfo
Earnings Data: Q Ending 2026-04-30

"HOV reported Q2 2026 revenue of $667.6M, down -46.5% QoQ from Q1 2026 ($632.0M?); the sequential comparison indicates a sharp pullback, while on a YoY basis revenue decreased -2.8% vs Q2 2025 ($686.5M). Net income was -$0.3M (EPS -0.46) in Q2 2026 versus +$20.9M (EPS 2.80) in Q1 2026, and worse than Q2 2025 net income of +$19.7M (EPS 2.64). Margins compressed materially: gross margin fell to 14.8% from 97.0% in Q1, and net margin swung to roughly breakeven negative (-0.04%). Operating income also declined to $13.9M (operating margin 2.1%), from $562.7M (89.0% operating margin) in Q1. Cash flow weakened: operating cash flow was -$67.1M and free cash flow was -$70.5M, driven by adverse working capital (-$140.7M). The company continued shareholder payouts with dividends of -$2.7M and buybacks of -$9.5M. Balance sheet resilience remains mixed. Total assets rose to $2.83B, while equity stayed relatively stable around $0.83B. Leverage remains elevated with total debt of $934.6M and net debt of $613.7M. Total shareholder return context is supportive: the stock is up +26.7% over the last 1 year, exceeding the >20% momentum threshold. Dividend yield is modest (~0.37%), so capital appreciation is the main driver of total return. Analyst sentiment/valuation inputs are limited (no price target provided)."

Revenue Growth

Caution

Q2 2026 revenue was $667.6M, down about -2.8% YoY vs $686.5M in Q2 2025. QoQ comparison vs Q1 2026 shows a sharp sequential decline (Q1 revenue listed at $632.0M), indicating weakening demand/volume.

Profitability

Neutral

Net income fell to -$0.3M in Q2 2026 from +$20.9M in Q1 2026 and from +$19.7M in Q2 2025. Net margin swung to ~-0.04% from +2.9% (Q2 2025) and operating margin compressed sharply, signaling margin instability.

Cash Flow Quality

Neutral

Operating cash flow was -$67.1M and free cash flow -$70.5M in Q2 2026, versus strong positive CFO in Q1 2026. Working capital was a major drag (-$140.7M). Dividend and buyback activity continued despite negative FCF.

Leverage & Balance Sheet

Neutral

Total assets increased to $2.83B and equity was stable around $0.83B. However, leverage remains meaningfully high: total debt $934.6M and net debt $613.7M. Interest coverage is only ~1.12x in Q2 2026, reducing resilience.

Shareholder Returns

Good

Share price momentum is strong with +26.71% 1Y change (above the 20% threshold). Dividend yield is modest (~0.37%), and buybacks/dividends were still paid in the quarter, supporting total shareholder returns despite fundamentals weakening.

Analyst Sentiment & Valuation

Fair

No formal price target was provided. Valuation metrics show negative earnings (P/E not meaningful), so valuation confidence relies more on price momentum than on earnings power.

Disclaimer:This analysis is AI-generated for informational purposes only. Accuracy is not guaranteed and this does not constitute financial advice.

Fundamentals Overview

Loading fundamentals overview...

Hovnanian delivered a solid Q2 execution despite a choppy demand backdrop and competitive selling. Results beat/landed at the top of key guidance metrics: adjusted gross margin rebounded to 14.3% (above the forecast upper end) from 13.4% in Q1, with SG&A at 12.6% and adjusted EBITDA of $41M. The main financial lever was incentive normalization: incentives were 11.9% of ASP, down 70 bps sequentially (first decline in nearly two years), though still up 140 bps vs last year and 890 bps vs 2022. Operations supported profitability and speed—cycle times improved by 6 days to 138 days, and backlog conversion reached 85%. Liquidity remained strong at $442M despite $232M of land spend, while management expects sequential Q4 improvement as newer communities deliver, but offered limited visibility beyond Q3 due to heightened macro/geopolitical uncertainty.

AI IconGrowth Catalysts

  • Sequential gross margin rebound: adjusted gross margin improved to 14.3% from 13.4% in Q1 (management described Q1 as trough)
  • Mix shift toward newer communities with incentive environment built into land underwriting, supporting gradual gross margin improvement
  • Inventory-to-sales acceleration via quick move-in monetization and improved cycle times (single-family cycle time improved by 6 days to 138 days)
  • Higher backlog conversion efficiency: 41% of delivered homes were sold and closed in the same quarter; backlog conversion rate 85% vs 61% historical average

Business Development

  • Working constructively community-by-community with land sellers/land bankers with option agreements to share downside and avoid exits
  • Option lots with land bankers: ~19% of option lots are with land bankers (renegotiation typically occurs at take-down/approval stage)

AI IconFinancial Highlights

  • Total revenues: $668 million (close to midpoint of projected range)
  • Adjusted gross margin: 14.3% vs forecast upper end; sequential improvement from 13.4% in Q1
  • SG&A: 12.6% (at the lower end of expectations)
  • Unconsolidated joint ventures: $1 million loss (below expectations) due to typical early-stage start-up costs ahead of first deliveries
  • Adjusted EBITDA: $41 million (above projected range)
  • Adjusted pretax income: $9 million (top end of forecasted range)
  • Year-over-year: revenues down 3% driven by 12% fewer homes and a more competitive selling environment
  • Incentives as % of ASP: 11.9% in Q2; sequential incentive decline of 70 basis points (first sequential decline in nearly 2 years)
  • Incentives higher than last year by 140 basis points and higher by 890 basis points vs full-year 2022
  • Construction costs decreased 2% year over year; gross margin improved sequentially despite higher incentives

AI IconCapital Funding

  • Liquidity: $442 million at quarter end (above $400M target range even after $232 million land/land development spend and $10 million stock repurchases)
  • Stock repurchases: $10 million in the quarter (still board capacity for additional repurchases)
  • Debt profile: as of 04/30/2026 all outstanding debt unsecured except revolving credit facility
  • Net debt-to-capital: 43.1% vs 146.2% at start of fiscal 2020; positioned for 30% target
  • Deferred tax assets: $222 million; management indicated federal income tax impact not expected on ~$700 million of future pre-tax earnings

AI IconStrategy & Ops

  • Inventory management centered on sales pace via targeted mortgage rate buy downs plus quick move-in homes to clear inventory
  • Transitioning from older lower-margin lots to newer communities with incentive costs already reflected in land underwriting
  • Quick move-ins per community: 5.8 at end of Q2 (flat vs prior quarter); reduced QMI count while keeping inventory balanced
  • QMI count reduced 37% since Jan 2025: 1.16k (Jan 2025) to 731 (Apr 2026)
  • QMI contribution to sales: 68% of total sales in Q2 vs prior peak 79%; above historical average ~40%
  • Finished QMIs decreased 55% YoY: 304 (end of Q2 last year) to 137 (end of Q2 26)
  • Potential timing sensitivity noted: as more deliveries come from QMIs, results become more sensitive to closing timing and mix

AI IconMarket Outlook

  • Management provided Q3-only guidance (limited visibility beyond): assumes broadly stable market with no major increases in mortgage rates, tariffs, inflation, cancellation rates, or construction cycle times
  • Q3 FY2026 guidance: total revenues $650M–$750M; adjusted gross margin 14%–15%; SG&A 12.5%–13.5%; JV income breakeven to $10M; adjusted EBITDA $30M–$40M; adjusted pretax income breakeven to $10M
  • Management expects sequential improvement in Q4 (not year-over-year), driven by higher volume and gross margin as newer higher-margin communities deliver

AI IconRisks & Headwinds

  • Choppy demand environment and decreasing consumer confidence; management stated without incentives contracts would have declined dramatically
  • Risk of needing meaningfully higher incentives: gross margin improvement depends on avoiding larger incentive increases
  • Lower delivery volume and competitive selling environment continue to pressure year-over-year comparisons
  • Geopolitical uncertainty: Iran war noted as impacting sales pace (March weakness); macro uncertainty also affected traffic
  • Near-term visibility limited; quarterly results potentially more sensitive due to higher QMI mix and closing timing
  • Land costs/incentive environment still elevated versus normalized cycles; near-term margin pressure expected while replacing older lower-margin lots

Q&A: Analyst Interest

  • Topic: What drives the expected Q4 improvement (sequential vs YoY) and how management interprets uncertainty: Management emphasized difficulty forecasting beyond next two quarters due to volatility, then reiterated Q4 should improve sequentially via higher delivery volume and continued gross margin recovery if market stability holds, without specifying year-over-year comparisons.
  • Topic: Cash/liquidity deployment and whether excess cash signals reduced land activity: Management/Brad explained liquidity above targets is typical near year-end due to higher Q4 deliveries, and that current environment reduced land deal volume, leaving excess cash. They preferred maintaining dry powder for future land opportunities and said repurchases could occur opportunistically.
  • Topic: Land renegotiations and incentive/buydown mechanics (and whether base price is shifting): Brad quantified only ~19% of option lots are with land bankers and said renegotiation occurs when take-down/approval timing arrives. Ara said use of mortgage rate buydowns remains significant and base-price reductions are isolated; incentive % figures are not described as including base price cuts.

Sentiment: MIXED

Note: This summary was synthesized by AI from the HOV Q2 2026 earnings transcript. Financial data is complex; please verify all metrics against official SEC filings before making investment decisions.

📋 Official Regulatory 10-K / 10-Q SEC Filings

Direct authenticated documentation links to audited SEC database reports for HOV.

SEC EDGAR Live Feed
Loading financial data and tables...
📁

SEC Filings (HOV)

© 2026 Stock Market Info — Hovnanian Enterprises, Inc. (HOV) Financial Profile