Himalaya Shipping Ltd.

Himalaya Shipping Ltd. (HSHP) Market Cap

Himalaya Shipping Ltd. has a market capitalization of .

No quote data available.

CEO: Lars-Christian Svensen

Sector: Industrials

Industry: Marine Shipping

IPO Date: 2023-03-31

Website: https://himalaya-shipping.com

Himalaya Shipping Ltd. (HSHP) - Company Information

Market Cap: -|Sector: Industrials

Company Profile

Himalaya Shipping Ltd. focuses on the provision of dry bulk shipping services. The company was incorporated in 2021 and is based in Hamilton, Bermuda.

Analyst Sentiment

100%
Strong Buy

From 1 Active Polls

Consensus Target Matrix

Data feed parsing pending...

Price & Moving Averages

Loading chart...

🎯 Wall Street Analyst Intelligence Report

1-Year structural target targets, chart projections, and sentiment maps.

Average 1Y Target
$15.36
▲ +5.00% Upside
Low Target
$10.97
-25% Risk
Median Target
$14.92
2% Mid
High Target
$18.29
25% Max

Consensus Trend Projection

Trailing closures vs. 12-month metrics map.

Analyst Vote Distribution

Aggregate institutional coverage sentiment weights.

Sentiment volume allocation data unavailable.

Historical valuation matrix unavailable.

📘 Full Research Report

ℹ️

AI-Generated Research: This report is for informational purposes only.

📘 HIMALAYA SHIPPING LTD (HSHP) — Investment Overview

🧩 Business Model Overview

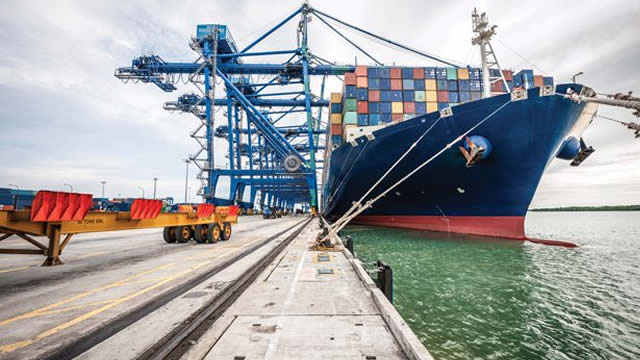
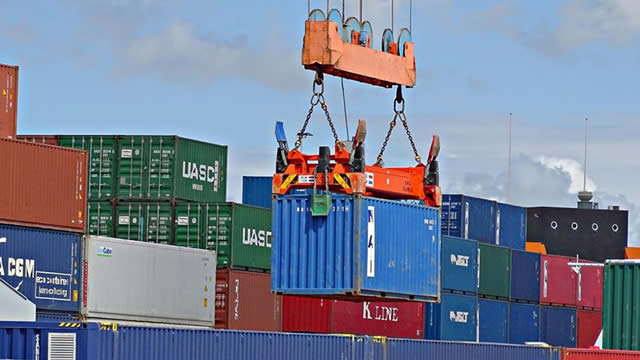
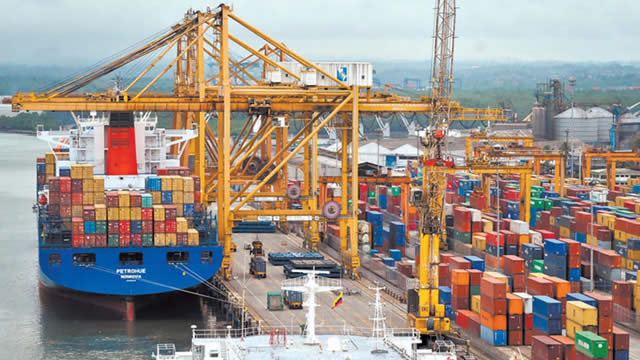
Himalaya Shipping Ltd operates as a vessel owner in the seaborne transport sector, monetising shipping capacity by contracting ships to move bulk cargoes for industrial and commodity end-markets. The value chain is straightforward: (1) fleet ownership and maintenance, (2) commercial chartering of vessels to shipowners/brokers and cargo charterers, and (3) executing voyage or time charters through operational management (crewing, route execution, and compliance).

Customer stickiness is driven less by “software-like” lock-in and more by operational and scheduling constraints: charterers value reliability of capacity, vessel suitability (tonnage class, draft, speed, suitability for specific routes), and execution discipline. Switching vessels midstream is costly in practice due to planning, documentation, and the need to align cargo schedules with available tonnage.

💰 Revenue Streams & Monetisation Model

Revenue typically comes from charter hire, generally structured as a mix of:

  • Time charters: contract-based revenue over a defined period, providing greater earnings visibility than pure spot exposure.
  • Voyage charters (and voyage elements): revenue tied to specific routes, cargo movements, and freight rate conditions.
  • Incidental commercial and operational adjustments: hire structure and contract terms can shift economics across efficiency, demurrage/despatch, and pass-through items.

Margin drivers are dominated by (1) fleet utilisation and earning rates (a function of market tightness and scheduling), and (2) unit operating cost per day (including crew, repairs/maintenance, insurance, and regulatory compliance). Financing costs and capital spending level also influence free cash flow and the ability to sustain dividends or reduce leverage across cycles.

🧠 Competitive Advantages & Market Positioning

In shipping, “moats” are often operational rather than structural. For HSHP, the most relevant advantages are:

  • Cost discipline / operational execution: strong ship management can lower downtime, improve vessel availability, and reduce the drag from dry-docking and repairs. Over a cycle, this compounds into better utilisation and better unit economics.
  • Fleet procurement and renewal discipline: maintaining an age profile compatible with regulatory requirements can reduce the risk of stranded economics and higher compliance costs.
  • Relationship-based chartering access: chartering networks and shipbroker/charterer relationships support smoother vessel placement and can improve contract terms during tightness phases.

Competitive benchmarking (dry bulk / ship owning and chartering focus):

  • Diana Shipping: diversified chartering profile and established scale, often competing through fleet size and counterparty coverage.
  • Navios Maritime Partners / Navios Group: broader platform dynamics and financial structure that can influence resilience through cycles.
  • Scorpio Bulkers: an operating scale and chartering capability that can tighten the bid-ask on vessel placement and contract structuring.

HSHP’s competitive positioning is best evaluated on fleet efficiency, cost base, and the ability to place tonnage profitably across freight regimes, rather than on brand or network effects in the consumer sense. Against larger peers, the key question is whether HSHP can maintain competitive unit costs and avoid adverse contract structures when market conditions turn.

🚀 Multi-Year Growth Drivers

A 5–10 year investment horizon in shipping is typically shaped by trade growth and—critically—fleet supply discipline. Structural drivers include:

  • Long-cycle demand for bulk commodities: continued global needs for industrial inputs (e.g., metals, minerals) and agricultural products support baseline vessel demand even when rates cycle.
  • Regulatory-driven supply tightening: evolving environmental rules increase the effective cost of operating older tonnage, encouraging scrapping and reducing usable fleet supply.
  • Efficiency upgrades as a structural advantage: ships that can meet compliance with lower disruption (via operational optimisation and appropriately timed upgrades) can preserve earning power relative to non-compliant or less efficient peers.
  • Capital discipline: in a sector where ownership is capital-intensive, constrained access to financing can limit fleet growth, supporting earnings during periods of tight supply.

For HSHP, growth is less about market share via aggressive expansion and more about maintaining a vessel portfolio capable of earning through cycles—supported by operating discipline and prudent capital allocation.

⚠ Risk Factors to Monitor

  • Freight rate cyclicality: earnings and cash flow swing with global trade, fleet supply, and chartering sentiment; equity investors can face large downside during downturns.
  • Balance-sheet and refinancing risk: shipping economics are sensitive to interest rates and the availability of secured and unsecured financing.
  • Regulatory compliance cost risk: environmental and safety standards can require capex, operational adjustments, and potential trading constraints for non-compliant tonnage.
  • Operational and safety risk: incidents, downtime, or dry-docking overruns can reduce revenue days and increase insurance and repair costs.
  • Counterparty risk: charterers’ credit quality affects collectability of hire, especially when contracts transition between spot and time structures.

📊 Valuation & Market View

Markets typically value shipping operators using asset- and cycle-aware frameworks, including:

  • EV/EBITDA (cycle-adjusted): freight markets can cause EBITDA volatility; valuation must account for earning normalisation and utilisation assumptions.
  • Net asset value (NAV) / implied fleet value: investors often compare enterprise value to the replacement value or market value of the fleet net of debt.
  • Payout capacity and cash conversion: valuation becomes more favorable when earnings translate into durable free cash flow and when the balance sheet remains resilient across downturns.

Key valuation movers are fleet age and efficiency, chartering strategy (time vs voyage mix), cost per day trajectory, leverage, and the durability of cash generation through the commodity/trade cycle.

🔍 Investment Takeaway

HSHP’s long-term case rests on operational execution and cost discipline in a structurally cyclical industry, paired with fleet management that can navigate regulatory tightening and preserve earning capacity. The most important investment work is assessing whether unit costs, vessel availability, and contract placement remain competitive versus larger peers—so cash generation can withstand freight downturns and fund compliance and maintenance without distress.


⚠ AI-generated — informational only. Validate using filings before investing.

📊 AI Financial Analysis

Powered by StockMarketInfo
Earnings Data: Q Ending 2026-03-31

"HSHP reported Q1’26 revenue of $33.6M and net income of $5.0M (EPS $0.11). Revenue rose 53.0% YoY (vs. $21.97M in Q1’25) and was down 20.2% QoQ (vs. $42.10M in Q4’25). Net income swung from a loss in Q1’25 ($-6.37M) to profit of $5.0M (+178.5% YoY on an absolute basis) and was down 62.9% QoQ (vs. $13.5M in Q4’25). Profitability improved meaningfully year-over-year but normalized sequentially. Gross margin expanded to 54.8% in Q1’26 from 67.8% in Q1’25, while net margin was 14.9% in Q1’26 versus -29.0% in Q1’25 (and below Q4’25’s 32.1%). Interest expense remains heavy (Q1’26 interest expense $12.4M), but operating income was $17.2M, supporting a positive net result. Cash flow quality is mixed: operating cash flow was $9.8M in Q1’26, but dividends were $11.7M, driving net cash down $7.9M. Balance sheet leverage remains elevated with total assets of $849.6M and total debt of $23.7M (net debt remains negative at -$0.8M), while equity declined slightly to $155.8M. Shareholder returns appear strong: the stock is up 215.0% over 1Y (capital appreciation), and the dividend yield is ~1.9%, though recent payouts pressured near-term cash. Total return is therefore more momentum-led than cashflow-led."

Revenue Growth

Neutral

Q1’26 revenue $33.6M: +53.0% YoY but -20.2% QoQ, indicating growth off a weak prior year quarter but some sequential demand normalization.

Profitability

Positive

Net margin improved to 14.9% in Q1’26 from -29.0% in Q1’25, but contracted vs. Q4’25 (32.1%). Operating profitability is positive, though interest burden remains significant.

Cash Flow Quality

Caution

Operating cash flow was $9.8M, but dividends paid were $11.7M in Q1’26, resulting in a $7.9M cash decline. Cash coverage of shareholder payments looks tight near-term.

Leverage & Balance Sheet

Positive

Total assets were $849.6M; equity $155.8M. Despite high gross liabilities historically, net debt is negative (-$0.8M), and cash balances are substantial ($24.5M).

Shareholder Returns

Strong

Strong total return drivers: price is up 215.0% over 1Y with a ~1.9% dividend yield. Momentum outweighs the cashflow strain from dividends.

Analyst Sentiment & Valuation

Fair

No formal price target provided. Valuation metrics in the dataset imply rich expectations (e.g., high price-to-sales and elevated P/E), which can limit upside if profitability normalizes.

Disclaimer:This analysis is AI-generated for informational purposes only. Accuracy is not guaranteed and this does not constitute financial advice.

Fundamentals Overview

Loading fundamentals overview...

HSHP delivered a strong Q1 2026 rebound: net profit of $5M and EPS of $0.11 versus a prior-year loss, supported by TCE rising to $32,300/day (from $21,100/day) and operating revenue growing to $33.6M. Operating leverage is visible with EBITDA up to $24.5M. Costs increased mainly from crew spares, service fees, and insurance, pushing OpEx per day to $6,800. Financial footing remains solid: $24.5M cash against a $12.3M minimum under sale-leaseback, with sale-leaseback debt down to ~$694M. On strategy, management keeps 11/12 ships spot-exposed and favors index-linked charters to capture upside. The core outlook argument is that Atlantic tightness and ton-mile structural drivers (Guinea bauxite, Simandou ramp, and a structurally short Atlantic with more Pacific-to-Atlantic backhaul) are not fully priced in Q3/Q4 FFA. Main near-term execution risk is dry dock off-hire, modeled at 1.7% in 2026 (plus potential congestion).

AI IconGrowth Catalysts

  • Higher time charter equivalent earnings rising from $21,100/day (Q1 2025) to $32,300/day (Q1 2026), driving Operating revenue to $33.6M
  • Strong Guinea bauxite volumes: Guinea bauxite up 23% YoY, contributing to higher ton-mile demand
  • Structural ton-mile tailwind: Capesize/Newcastlemax tonne-mile up 4.3% YoY in Q1, supported by bauxite share reaching ~20% of total cargo on the segment
  • Simandou ramp: first iron ore volumes commenced in Nov 2025; management cites improving mine-to-vessel logistics and expectations for further growth

Business Development

  • Entered new index time charter agreements: Mount Ita (11–14 months) and Mount Matterhorn (12–14 months) at significant premiums to prevailing indices
  • Entered new time charter agreement for Mount Emai (12–14 months) at an index-linked rate at a significant premium to the Baltic Capesize Index
  • Contract to acquire an additional 4,200 shares in 2020 Bulkers Management AS from 2020 Bulkers Limited for NOK 1.1M, effective Apr 1, 2026; ownership increases from 40% to 54%
  • April 2026 subsequents: TCE achieved about $41,600/day and declared cash distribution $0.15 for April

AI IconFinancial Highlights

  • EPS $0.11 in Q1 2026 vs loss of $0.14 in Q1 2025; net profit $5.0M vs net loss $6.4M
  • EBITDA $24.5M vs $13.8M prior year; operating profit $17.2M vs $6.5M
  • Operating revenues $33.6M vs $22.0M, primarily from TCE increase to $32,300/day
  • OpEx $7.4M vs $6.9M; average OpEx per day up to $6,800 from $6,400 (driven by higher crew spares, service fees, insurance)
  • Interest expense $12.4M, down $0.7M YoY due to lower average loan principal from repayments
  • Cash distributions declared: $0.18/share for Jan–Mar 2026; additional declared distribution $0.15 for Apr 2026
  • bps margin changes: not disclosed in transcript
  • Tax/tariff impacts: not disclosed in transcript

AI IconCapital Funding

  • Cash and cash equivalents: $24.5M at quarter end; minimum cash requirement under sale-leaseback financing: $12.3M
  • Sale-leaseback financing outstanding: ~$694M at Q1 end (down from ~$701M at 2025 year-end via scheduled repayments)
  • No buyback explicitly stated; equity increase via acquisition of additional 4,200 shares (NOK 1.1M) effective Apr 1, 2026
  • Cash flow from operations: $9.8M in Q1 2026 vs $0.3M in Q1 2025

AI IconStrategy & Ops

  • Commercial strategy: charter out majority of vessels on index-linked charters to capture upside and retain conversion flexibility to fixed rates when forward FFA curve offers value
  • Fleet exposure: 11 out of 12 ships exposed to spot market to capture a continued strong year ahead
  • Fleet profile: 12 modern Newcastlemaxes with dual-fuel LNG; management states fleet is in top 1% emission rating for large bulk carriers and cites long-term fixed-out contracts with conversion options
  • No automation/store closures/supply-chain reconfiguration mentioned in transcript

AI IconMarket Outlook

  • Management frames the market as starting a 'super cycle' (terminology used in Q&A context)
  • FFA curve vs management view: Q3/Q4 FFA remained stable over months but management believes Atlantic tightness is not fully priced forward
  • Directional expectation: structurally short Atlantic, improved mine-to-vessel logistics (Simandou), and strong bauxite volumes should lift rates beyond current consensus/FFA assumptions
  • No explicit future guidance number for rates/earnings beyond April 2026 TCE and declared distribution

AI IconRisks & Headwinds

  • Dry dock/special survey off-hire: management estimates 1.7% additional off-hire in 2026 due to dry docks alone (not including potential congestion/waiting time)
  • Congestion and waiting time risk acknowledged qualitatively (may add beyond modeled 1.7%)
  • Supply-side constraints exist but do not eliminate shocks: management notes order book remains slow-moving (14% order book of total fleet) and shipyard capacity is down ~60% from 2008 peak
  • No explicit discussion of yield/competition/macro shock beyond market tightness valuation; implied sensitivity to Atlantic tightness pricing

Q&A: Analyst Interest

  • Market mispricing vs FFA curve: Management argued Q3/Q4 FFA has stayed stable yet Atlantic tightness driving current spot levels is not fully priced forward; they cited strong bauxite volumes, Simandou volumes coming on stream, and a structurally short Atlantic versus 3–4 years ago as the main rate-up drivers.
  • Drivers that could lift rates from today: Management highlighted structural ton-mile and cross-regional flow changes, including more backhaul business from the Pacific into the Atlantic (described as less visible recently). They connected this to fleet spot exposure (11/12 ships) as evidence of conviction in continued tightness and upside.
  • Potential for fleet expansion/acquisitions: Analyst asked if trading above NAV creates acquisition currency; management said they pursue accretive shareholder growth generally, but emphasized the stock’s NAV premium reflects transparency, solid counterparties, and low G&A—so they remain 'on the lookout' rather than committing to expansion.

Sentiment: POSITIVE

Note: This summary was synthesized by AI from the HSHP Q1 2026 earnings transcript. Financial data is complex; please verify all metrics against official SEC filings before making investment decisions.

Loading financial data and tables...
© 2026 Stock Market Info — Himalaya Shipping Ltd. (HSHP) Financial Profile