Insteel Industries, Inc.

Insteel Industries, Inc. (IIIN) Market Cap

Insteel Industries, Inc. has a market capitalization of $593.3M.

Price: $30.65

β–² 0.03 (0.10%)

Market Cap: 593.33M

NYSE Β· time unavailable

CEO: Howard Osler Woltz

Sector: Industrials

Industry: Manufacturing - Metal Fabrication

IPO Date: 1992-03-17

Website: https://www.insteel.com

Insteel Industries, Inc. (IIIN) - Company Information

Market Cap: 593.33M|Sector: Industrials

Company Profile

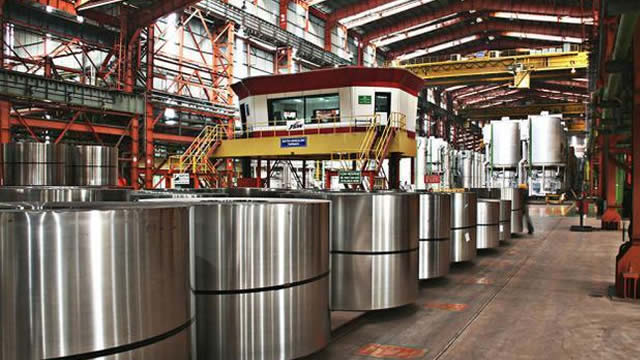
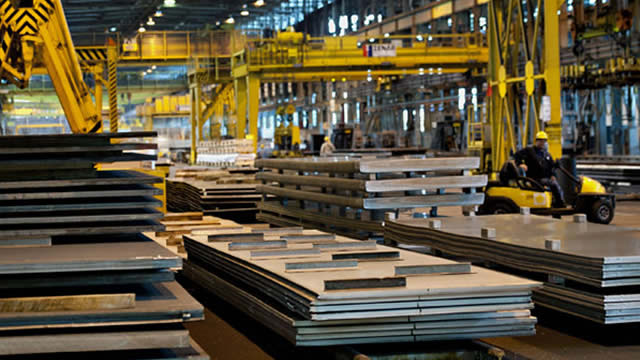
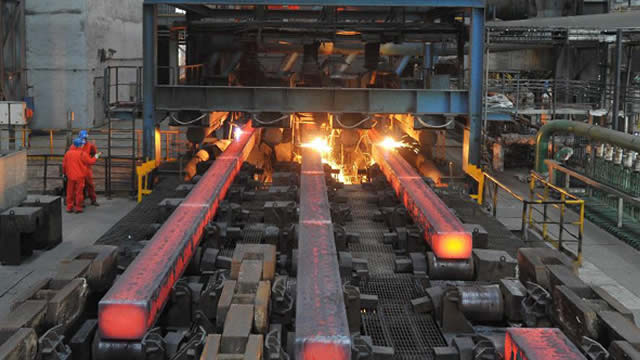
Insteel Industries, Inc., along with its various subsidiaries, focuses on the manufacturing and commercialization of steel wire reinforcement products specifically for concrete construction applications. The company's primary offerings include prestressed concrete strand (PC strand) and welded wire reinforcement (WWR). Its PC strand is a distinctive seven-wire product designed to introduce compression into precast concrete elements and structures. This strengthens various constructions, such as bridges, parking garages, commercial buildings, and other concrete infrastructure. Additionally, Insteel supplies an engineered welded wire reinforcement (WWR) product utilized in both non-residential and residential construction endeavors. This WWR product line encompasses several types: Engineered structural mesh: A custom-made solution that functions as the main reinforcement for concrete elements and structures, often serving as an alternative to conventional hot-rolled rebar. Concrete pipe reinforcement: Another tailored product, engineered for primary reinforcement in concrete pipes, box culverts, and precast manholes, vital for drainage and sewage systems, water treatment facilities, and related utility applications. Standard welded wire reinforcement: A secondary reinforcement material aimed at preventing cracks in residential and light commercial settings, including driveways, sidewalks, and various slab-on-grade applications. Insteel distributes its products through a network of sales representatives to a diverse customer base, including concrete product manufacturers, rebar fabricators, distributors, and contractors. Its principal markets are located across the United States, Canada, Mexico, and extending into Central and South America. Founded in 1953, Insteel Industries, Inc. is headquartered in Mount Airy, North Carolina.

Analyst Sentiment

50%
Hold

From 1 Active Polls

Consensus Target Matrix

Data feed parsing pending...

Price & Moving Averages

Loading chart...

🎯 Wall Street Analyst Intelligence Report

1-Year structural target targets, chart projections, and sentiment maps.

Average 1Y Target
$32.18
β–² +5.00% Upside
Low Target
$22.99
-25% Risk
Median Target
$31.26
2% Mid
High Target
$38.31
25% Max
Consensus
Buy
3 / 4 Buys

Consensus Trend Projection

Trailing closures vs. 12-month metrics map.

Analyst Vote Distribution

Aggregate institutional coverage sentiment weights.

πŸ“Š Historical Valuation Multiples

Real-time Trailing Twelve Month (TTM) momentum side-by-side with discrete quarterly metrics.

Fiscal QuarterTTMQ2 2026Q1 2026Q4 2025Q3 2025Q2 2025Q1 2025Q4 2024Q3 2024
Period EndingTrailing 12MJun 27, 2026Mar 28, 2026Dec 27, 2025Sep 27, 2025Jun 28, 2025Mar 29, 2025Dec 28, 2024Sep 30, 2024
Market Cap ($M)593594643632750735513537606
Enterprise Value ($M)573574631620715686488504496
Price to Earnings Ratio (P/E)16.3916.5930.5520.8112.8312.1012.42124.3232.39
Price/Earnings-to-Growth Ratio (PEG)β€”1.153.84β€”β€”1.010.52β€”β€”
Price to Sales Ratio (P/S)0.843.003.723.954.234.093.194.144.51
Price to Book Ratio (P/B)1.611.601.761.762.022.061.501.621.73
Price to Free Cash Flow Ratio (P/FCF)-49.8671.08957.84-287.95-40.0327.32-92.5632.9241.70
Enterprise Value to Sales (EV/Sales)β€”2.903.653.884.033.813.043.883.70
Enterprise Value to EBITDA (EV/EBITDA)9.3949.0356.1543.7229.8928.0127.21306.6449.27
Debt to Equity Ratio-0.330.010.010.010.010.010.010.010.00

πŸ“˜ Full Research Report

ℹ️

AI-Generated Research: This report is for informational purposes only.

πŸ“˜ INSTEEL INDUSTRIES INC (IIIN) β€” Investment Overview

🧩 Business Model Overview

INSTEEL INDUSTRIES INC manufactures engineered products used in civil infrastructure and environmental projects, combining proprietary engineering know-how with steel-based reinforcement and geosynthetic applications. The value chain typically begins with upstream steel wire and polymer inputs (sourced and processed into specialized reinforcement components), followed by fabrication into customer-specified systems. Sales are driven by project-based demand through contractors, specifiers/engineers, and distributors, with product qualification and specification cycles creating customer stickiness.

The economic profile is shaped by (1) the ability to produce compliant, performance-engineered products at competitive yields and (2) the extent to which customers adopt INSTEEL solutions in recurring infrastructure categories (erosion control, soil reinforcement/stabilization, drainage, and related civil works).

πŸ’° Revenue Streams & Monetisation Model

Revenue is primarily transactional and project-linked, but the monetisation model benefits from repeatability in approved designs. Where projects recur by geography and agency (and where specifications repeat across similar jobs), INSTEEL can convert engineering pull-through into more consistent order flow.

  • Engineered product sales: Higher relative margins versus commodity-like steel inputs, supported by performance requirements, documented installation guidance, and design support.
  • Fabrication and system integration: Revenue reflects both materials and value-added transformation (processing, reinforcement integration, and packaging to project needs).
  • Mix effects as a key margin driver: Operating margins are influenced by the spread between input costs (steel wire and polymer materials) and the company’s pricing discipline, as well as by manufacturing efficiency and product mix toward more engineered solutions.

🧠 Competitive Advantages & Market Positioning

INSTEEL’s moat is primarily based on switching costs and process/quality barriers rather than on network effects. Civil infrastructure and environmental products require compliance, performance data, and installation predictability; once a product is specified and qualified for a project class, replacements are costly in engineering time, re-approval, and risk management for contractors and agencies.

This structural stickiness is reinforced by manufacturing know-how and product qualification: competitors must match not only price but also performance documentation, installation guidance, and reliability of supply. In practice, qualification and design-specification cycles create inertia.

  • Competitive benchmarking (primary competitors):
    • TenCate (geosynthetics): Competes in soil reinforcement, separation, and drainage systems, emphasizing engineered spec compliance and long project qualification histories.
    • Tensar (Huesker/Tensar infrastructure systems): Competes on engineered stabilization and specification-driven adoption across transportation and civil markets.
    • Maccaferri (reinforcement & erosion control systems): Competes in erosion control and reinforcement solutions, including geosystems where engineering documentation and installation performance matter.

Contrast in positioning: INSTEEL focuses on delivering engineered, steel-reinforced and civil-environment solutions that fit into customer specifications and project qualification workflows. Versus broader geosynthetics leaders (TenCate, Tensar), the key differentiation is the ability to provide performance-engineered products while maintaining manufacturing execution and supply consistency. Versus system specialists (Maccaferri), the competitive arena hinges on product qualification, installation predictability, and the economics of fabrication and input sourcing rather than solely on catalog breadth.

πŸš€ Multi-Year Growth Drivers

Over a 5–10 year horizon, the addressable market expands with macro needs that are not dependent on short-cycle commodity cycles:

  • Infrastructure resilience spending: Ongoing demand for erosion control, soil stabilization, drainage, and durable civil systems driven by climate variability and aging assets.
  • Water and environmental compliance: Regulatory and permitting frameworks support growth in engineered environmental containment and ground-control applications.
  • Replacement of older, less durable systems: Many civil works require staged upgrades and rehabilitation where performance specifications drive adoption of qualified suppliers.
  • Specification-driven adoption: As design communities standardize solution approaches, qualified product vendors can capture share through documentation, installation support, and long-term reliability.

⚠ Risk Factors to Monitor

  • Input-cost volatility and pricing lag: Steel and polymer input costs can swing, and margin outcomes depend on the speed and ability to pass through costs and manage contract terms.
  • Cyclicality in construction and infrastructure budgets: Demand can be sensitive to public and private capital availability, especially for non-essential or delayed projects.
  • Execution and capacity utilization: Manufacturing leverage can amplify earnings swings if volumes fall below planned run-rates.
  • Competitive specification dynamics: Qualified status does not guarantee lifetime adoption; competitors can win projects by meeting documentation, pricing, and delivery requirements.
  • Working capital and logistics: Project timing, billing, and inventory levels affect cash conversion and can pressure liquidity in downcycles.

πŸ“Š Valuation & Market View

The market typically values industrial manufacturers using EV/EBITDA and P/E (when earnings quality is stable), while P/S can be used when earnings are muted by cycle effects. For INSTEEL specifically, valuation sensitivity is usually tied to:

  • Durability of margins: Whether engineered mix and pricing discipline can offset input inflation and utilization swings.
  • Cash conversion quality: Working capital discipline and project billing efficiency.
  • Evidence of share retention in specification-driven categories: Stability of order intake and repeat project classes.

A sustained rerating typically requires credible margin stability and an improved view of supply consistency and engineered product contribution, rather than a pure volume rebound.

πŸ” Investment Takeaway

INSTEEL INDUSTRIES INC is best viewed as a specification-driven civil engineering supplier where switching costs and qualification inertia support defensible share in qualified project classes. The core investment question is whether the company can maintain manufacturing execution and pricing discipline to protect margins through input volatility, while continuing to expand engineered product adoption across resilience, water, and environmental infrastructure end-markets.


⚠ AI-generated β€” informational only. Validate using filings before investing.
πŸ“° Market News & Coverage

15 Stories Available

Real-time institutional reporting and market updates for IIIN.

seekingalpha.comβ€’2026-07-17

Insteel Industries: Re-Rating Supported By Improving Earnings Outlook

Insteel Industries upgraded from Hold to Buy, reflecting attractive risk-reward and peer-relative discount. IIIN is poised for FY2026 revenue growth from higher average selling prices and robust non-residential construction demand, particularly data centers. Margins should stabilize as price hikes and volume leverage offset elevated raw material and freight costs, though cost pressures persist.

seekingalpha.comβ€’2026-07-16

Insteel Industries Inc. (IIIN) Q3 2026 Earnings Call Transcript

Insteel Industries Inc. (IIIN) Q3 2026 Earnings Call Transcript

marketbeat.comβ€’2026-07-16

Insteel Industries Q3 Earnings Call Highlights

Insteel Industries NYSE: IIIN reported lower fiscal third-quarter earnings as higher selling prices and modestly improved shipments were outweighed by rising raw material, freight and manufacturing costs, executives said on the company's earnings call.

zacks.comβ€’2026-07-16

Insteel Industries (IIIN) Q3 Earnings and Revenues Surpass Estimates

Insteel Industries (IIIN) came out with quarterly earnings of $0.46 per share, beating the Zacks Consensus Estimate of $0.45 per share. This compares to earnings of $0.78 per share a year ago.

businesswire.comβ€’2026-07-16

Insteel Industries Reports Third Quarter 2026 Results

MOUNT AIRY, N.C.--(BUSINESS WIRE)--Insteel Industries Inc. (NYSE: IIIN) (β€œInsteel” or the β€œCompany”), the largest manufacturer of steel wire reinforcing products for concrete construction applications in the United States, today announced financial results for its third quarter of fiscal 2026 ended June 27, 2026. Third Quarter 2026 Highlights Net earnings of $9.0 million, or $0.46 per share Net sales of $197.7 million Gross profit of $20.1 million, or 10.2% of net sales Increased share repurcha.

seekingalpha.comβ€’2026-07-13

Insteel Industries' Plunge Finally Justifies An Upgrade

Insteel Industries is upgraded to a soft "Buy" as valuation becomes compelling despite recent profitability declines and macro uncertainty. IIIN's revenue continues to grow, driven by higher selling prices, but margins are pressured by rising costs and shipment declines. The company boasts a debt-free balance sheet with $15.1 million in cash, providing flexibility amid economic headwinds and ongoing investments in growth initiatives.

fool.comβ€’2026-07-03

4 Top Growth Stocks Worth Buying Under $100 Today

These four under-the-radar stocks are built to benefit from powerful secular trends that could reward patient, long-term investors.

gurufocus.comβ€’2026-06-16

Insteel Industries Announces Third Quarter 2026 Conference Call

Insteel Industries Inc. (NYSE: IIIN) today announced that its third quarter 2026 earnings conference call will be webcast live over the internet on Thursday, J

businesswire.comβ€’2026-06-16

Insteel Industries Announces Third Quarter 2026 Conference Call

MOUNT AIRY, N.C.--(BUSINESS WIRE)--Insteel Industries Inc. (NYSE: IIIN) today announced that its third quarter 2026 earnings conference call will be webcast live over the internet on Thursday, July 16, 2026, at 10:00 a.m. ET following the release of the Company's third quarter financial results at 6:30 a.m. ET on that same day. The conference call can be accessed on the Company's website at https://investor.insteel.com and will be archived for replay. About Insteel Insteel is the nation's large.

businesswire.comβ€’2026-06-04

Insteel Industries Announces Second Consecutive NCDOL Safety Achievement Award for Mount Airy Facility

MOUNT AIRY, N.C.--(BUSINESS WIRE)--Insteel Industries Inc. (NYSE: IIIN) (β€œInsteel”) the largest manufacturer of steel wire reinforcing products for concrete construction applications in the United States, announced that its Mount Airy, N.C. facility, operated by its wholly owned subsidiary Insteel Wire Products, has received the Certificate of Safety Achievement – Second Consecutive Year Gold from the North Carolina Department of Labor (β€œNCDOL”). The award recognizes the facility's outstanding.

businesswire.comβ€’2026-05-12

Insteel Industries Declares Quarterly Cash Dividend

MOUNT AIRY, N.C.--(BUSINESS WIRE)--Insteel Industries Inc. (NYSE: IIIN) today announced that its board of directors declared a regular quarterly cash dividend of $0.03 per share of common stock payable on June 26, 2026, to shareholders of record as of June 12, 2026. About Insteel Insteel is the nation's largest manufacturer of steel wire reinforcing products for concrete construction applications. Insteel manufactures and markets prestressed concrete strand and welded wire reinforcement, includ.

gurufocus.comβ€’2026-04-20

Insteel Industries Inc (IIIN) Shares Fall 4.8% -- What GF Score of 75 Tells Investors

On April 20, 2026, Insteel Industries Inc (IIIN) shares fell 4.8% to a current price of $24.95. This decline comes amid a challenging price performance, with th

fool.comβ€’2026-04-17

Tariffs Are Reshaping Retail. These 4 Stocks Are Positioned to Win.

Companies like Insteel Industries and Lifetime Brands benefit because they're less exposed to imports. Acushnet Holdings and Duluth Trading Company show that pricing power, sourcing control, and brand strength can offset even heavy cost pressure.

seekingalpha.comβ€’2026-04-17

Insteel Industries: Operational Volatility Hits Hard In Fiscal Q2

Insteel Industries faces persistent operational volatility due to unpredictable demand, input costs, and high operating leverage, despite sound management. Fiscal Q2 saw an 8% revenue rise but a 6% volume drop and gross margin contraction to 9.6%, driving a 50% decline in operating income. IIIN's near-term margin risk is elevated as wire rod supply constraints and rising costs temporarily outpace price increases, but infrastructure demand and a non-residential construction recovery offer some support.

fool.comβ€’2026-04-16

Here's Why Insteel Stock Crashed 20% Today

Rising raw material and freight costs are squeezing margins despite price hikes. Management anticipates a recovery in volumes in subsequent quarters, providing some optimism.

πŸ“Š AI Financial Analysis

Powered by StockMarketInfo
Earnings Data: Q Ending 2026-06-27

"IIIN reported Q3 2026 revenue of $197.7M and net income of $9.0M (EPS $0.46). QoQ, revenue rose to $197.7M from $172.7M (+14.5%), and net income increased from $5.2M (+72.8%). YoY, Q3 revenue grew slightly from $179.9M to $197.7M (+9.9%), while net income rose from $15.2M to $9.0M (-40.5%), indicating profitability compression despite higher sales. Over the last four quarters, margins have been volatile: gross margin declined to ~10.2% in Q3 2026 from ~17.1% in Q3 2025, and net margin fell to ~4.6% from ~8.4%. Cash flow remains positive but quality is uneven. Operating cash flow was $11.5M in Q3 2026 with free cash flow of $8.4M, improving from Q2’s $0.7M operating cash flow. Balance sheet resilience is solid with $371.4M equity and no long-term debt; net debt remains negative (net cash) at about -$23M. Total shareholder returns: the stock price is $26.22 with a -1.87% 1-year change and no dividend yield materialization (~0.10%). Buybacks were modest (repurchased ~$2.0M in Q3 2026). Overall, the near-term earnings rebound QoQ is positive, but the YoY earnings decline and margin compression keep the outlook mixed."

Revenue Growth

Neutral

QoQ revenue +14.5% (172.7M to 197.7M). YoY revenue +9.9% (179.9M to 197.7M), but growth is not translating into YoY earnings strength.

Profitability

Neutral

QoQ net income +72.8% (5.2M to 9.0M), but YoY net income -40.5% (15.2M to 9.0M). Margins are contracting: gross margin ~10.2% vs ~17.1% in Q3 2025; net margin ~4.6% vs ~8.4%.

Cash Flow Quality

Neutral

Q3 2026 operating cash flow $11.5M and free cash flow $8.4M are positive and improved vs Q2 (OCF $5.1M). Cash flows are supportive, though working-capital volatility is evident across quarters.

Leverage & Balance Sheet

Good

Equity is stable and substantial ($371.4M). No long-term debt; net debt is negative (net cash ~-$23M). Liquidity is strong with current ratio ~3.57.

Shareholder Returns

Caution

1-year price change is -1.87% and dividend yield is ~0.10%; buybacks are present but not large relative to the equity base.

Analyst Sentiment & Valuation

Fair

No price target provided. Valuation multiples look reasonable on EPS ($0.46) with P/E ~16.6 in the latest quarter, but earnings quality vs YoY trend tempers confidence.

Disclaimer:This analysis is AI-generated for informational purposes only. Accuracy is not guaranteed and this does not constitute financial advice.

Fundamentals Overview

Loading fundamentals overview...

IIIN delivered sharply weaker profitability in Q3’26 despite constructive demand indicators. Net earnings fell to $9.0M ($0.46 EPS) from $15.2M ($0.78 EPS), driven by margin compression: gross margin contracted 690 bps to 10.2% as higher costs (raw material, freight, manufacturing) outpaced realized price spreads, and lower production volumes raised unit conversion costs. Management also faced timing friction: wet weather and data center scheduling/delivery delays moderated shipments, though it characterized delays as non-cancelled and expectations remain for Q4 acceleration through year-end. The core investment-and-liquidity story is intactβ€”cash $22.9M with no revolver borrowings and continued buybacks (75k shares/$1.9M). Outlook is guarded: Q4 gross margins expected near current levels with only modest improvement unless additional pricing offsets persistent inflation. Tariff dynamics (Section 32 and related trade disputes) remain a key volatility source.

AI IconGrowth Catalysts

  • Infrastructure activity supported shipments; private non-residential (excluding data centers) characterized as β€œquite weak,” but management expects acceleration into Q4 and through the end of the calendar year
  • Pricing actions implemented over the past year lifted average selling prices; management highlighted continued ability to pass through rising costs (most recent price increase effective July 13)
  • Engineered structural mesh growth supported by planned CapEx and information systems/infrastructure investments

Business Development

  • No specific customer/partner names disclosed; discussions framed around data center developer/contractor/end user prospects and broader private non-residential applications

AI IconFinancial Highlights

  • Net earnings $9.0M or $0.46 EPS vs $15.2M or $0.78 EPS prior year quarter (below expectations; management attributed decline to higher costs offsetting pricing and shipments)
  • Shipments increased 1.7% YoY; wet weather plus project scheduling/delivery delays (including data center-related projects) moderated shipment pace
  • Average selling prices +8.1% YoY and +2.3% sequentially; gross margin contracted 690 bps YoY to 10.2% from 17.1%
  • Gross margin sequentially improved: +60 bps with higher volumes and improved spreads
  • Gross margin near current levels in Q4 with potential modest improvement; β€œsignificant” expansion depends on realizing additional pricing sufficient to offset ongoing raw material, freight, and operating inflation
  • SG&A declined to $8.5M or 4.3% of net sales vs $10.6M or 5.9% prior year, largely due to lower compensation incentive plan expense pace
  • Effective tax rate 22.8% vs 23.3% prior year; expects ~23% for remainder of fiscal year
  • Inventory ended at ~3.5 months of shipments (forward-looking off Q4 forecast), up from 3.4 months at end of Q2, reflecting continued elevated wire rod purchasing and elevated unit costs

AI IconCapital Funding

  • Capital expenditures: $3.2M in the quarter; $9.1M in first 9 months of fiscal 26; updated full-year CapEx forecast ~$15M down from prior ~$20M
  • Share repurchase: 75,000 shares for $1.9M during the quarter under existing authorization
  • Balance sheet/liquidity: $22.9M cash; no borrowings outstanding on a $100M revolving credit facility

AI IconStrategy & Ops

  • Continues supplementing domestic wire rod purchases with offshore material to mitigate supply risk and support customer demand, driving working capital needs
  • Inventory expected to decline modestly during Q4 as shipments progress through the seasonal busy period
  • CapEx described as supporting engineered structural mesh growth, reducing cash production costs, and enhancing information systems infrastructure

AI IconMarket Outlook

  • Q4 gross margins: expected near current levels with potential modest improvement
  • Shipment outlook: management expects private non-residential (including data center projects) shipments to accelerate during the current quarter and remain strong through the end of the calendar year
  • Tax outlook: effective rate to run close to 23% for the balance of fiscal 26

AI IconRisks & Headwinds

  • Margin pressure from narrow spread between selling prices and raw material costs plus higher freight/manufacturing costs; unit conversion costs pressured by lower production volumes
  • Data center delivery delays cited as timing-related (no cancellations), but visibility day-to-day; acceleration depends on project start schedules
  • Cost inflation across inputs (raw material, freight, other operating expenses) and difficulty collecting pricing in a β€œreasonably okay” but not β€œbullishly strong” market
  • Section 32 tariff regime: 50% tariff on hot rolled wire rod imports; management stated domestic economics are affected by foreign circumvention and later derivative coverage
  • Offshore sourcing creates net working capital implications; domestic wire rod capacity/investment is uncertain
  • Tariff refund/IPA-trade matters remain legally unresolved; management does not expect prompt repayments given appeal status

Q&A: Analyst Interest

  • Data center shipment timing/acceleration: Management confirmed the data center delays are real, but would not provide detailed project-duration guidance. They reiterated a Q4 pickup expectation through the end of the calendar year, while noting it is β€œday-to-day” and depends on when contractors are ready for material at the site.
  • SG&A incentive comp mechanics and other P&L drivers: Analyst asked whether the $2.1M SG&A change reflected incentive comp timing versus a clawback. CFO clarified it was purely lower approval pacing tied to reduced financial results, with no clawback. CFO also cited a ~$300K pickup in life-insurance cash surrender value from market returns.
  • Tariff/IPA refund accounting stance and recovery probability: Analyst questioned whether management changed its prior approach to not recording receivables related to IPA tariffs. Management responded they record when received and noted limited exposure because others were importer of record on most tariffs. They highlighted the Court of International Trade repayment scheme and the administration’s appeal, implying a long adjudication runway.

Sentiment: MIXED

Note: This summary was synthesized by AI from the IIIN Q3 2026 earnings transcript. Financial data is complex; please verify all metrics against official SEC filings before making investment decisions.

πŸ“‹ Official Regulatory 10-K / 10-Q SEC Filings

Direct authenticated documentation links to audited SEC database reports for IIIN.

SEC EDGAR Live Feed
Loading financial data and tables...
πŸ“

SEC Filings (IIIN)

Β© 2026 Stock Market Info β€” Insteel Industries, Inc. (IIIN) Financial Profile