Intel Corporation

Intel Corporation (INTC) Market Cap

Intel Corporation has a market capitalization of .

No quote data available.

CEO: Lip-Bu Tan

Sector: Technology

Industry: Semiconductors

IPO Date: 1980-03-17

Website: https://www.intel.com

Intel Corporation (INTC) - Company Information

Market Cap: -|Sector: Technology

Company Profile

Intel Corporation engages in the design, manufacture, and sale of computer products and technologies worldwide. The company operates through CCG, DCG, IOTG, Mobileye, NSG, PSG, and All Other segments. It offers platform products, such as central processing units and chipsets, and system-on-chip and multichip packages; and non-platform or adjacent products, including accelerators, boards and systems, connectivity products, graphics, and memory and storage products. The company also provides high-performance compute solutions for targeted verticals and embedded applications for retail, industrial, and healthcare markets; and solutions for assisted and autonomous driving comprising compute platforms, computer vision and machine learning-based sensing, mapping and localization, driving policy, and active sensors. In addition, it offers workload-optimized platforms and related products for cloud service providers, enterprise and government, and communications service providers. The company serves original equipment manufacturers, original design manufacturers, and cloud service providers. Intel Corporation has a strategic partnership with MILA to develop and apply advances in artificial intelligence methods for enhancing the search in the space of drugs. The company was incorporated in 1968 and is headquartered in Santa Clara, California.

Analyst Sentiment

54%
Hold

From 49 Active Polls

1Y Forecast: $87.42

▲ +0.0% Potential Upside

Consensus Target Metrics

Low Bound

$45

Median

$82

High Bound

$150

Average

$87

Price & Moving Averages

Loading chart...

🎯 Wall Street Analyst Intelligence Report

1-Year structural target targets, chart projections, and sentiment maps.

Average 1Y Target
$87.42
▼ -11.85% Upside
Low Target
$45.00
-55% Risk
Median Target
$82.00
-17% Mid
High Target
$150.00
51% Max

Consensus Trend Projection

Trailing closures vs. 12-month metrics map.

Analyst Vote Distribution

Aggregate institutional coverage sentiment weights.

Sentiment volume allocation data unavailable.

Historical valuation matrix unavailable.

INTC Growth Runway Model

Standard long term linear growth fade

Multi-Stage Discounted Cash Flow Sandbox

Market Price$99.17
Intrinsic Value$8.61
Market Alignment
Overvalued by 91.3%relative to calculated intrinsic value
9.00%
Exp: -5%-5%
i

Growth runway slowdown

This value provides a time window for the growth rate to decline beyond Stage 1 toward the terminal rate. Longer windows are most useful for companies with high growth starting conditions or strong competitive advantages. This option stretches out the growth rate slowdown across 5, 10, or 15-year steps. A high-growth starting condition (exceeding a 25% initial growth rate) automatically applies a curve decay to simulate realistic, rapid market saturation.
i

Terminal growth rate

With long-term inflation between 3-5%, revenue must grow by that baseline to maintain flat real-world market share. This value sets the permanent terminal growth rate to factor into the valuation beyond the growth slowdown runway toward maturity.

3-Stage Financial Runway Horizon

🧠 Perpetuity Horizon Engine (Stage 3: Post-2035)

Terminal FCF Base$5.06B
Perpetuity TV Value$95.22B
Discounted TV (PV)$40.22B
TV Weighting %54.3%
⚠️
Financial Model Disclaimer & Risk Disclosure: This interactive scenario simulator is an educational sandbox provided strictly for informational and analytical research purposes. Core historical financial statements and consensus estimates are sourced directly via Financial Modeling Prep (FMP). All downstream outputs are entirely deterministic, hypothetical projections generated by combining automated mathematical formulas (including linear interpolation and Gaussian bell-curve decay models) with user-selected variables and third-party financial data inputs. Users assume all liability for trading decisions executed based on these sandbox calculations.

📘 Full Research Report

ℹ️

AI-Generated Research: This report is for informational purposes only.

📘 INTEL CORPORATION CORP (INTC) — Investment Overview

🧩 Business Model Overview

Intel is an integrated semiconductor company that designs and manufactures microprocessors and related computing components. Value is created across three steps: (1) architecture and platform design (CPUs, chipsets, system components), (2) wafer fabrication and packaging at scale (turning advanced process technology into sellable silicon), and (3) enabling ecosystems through tooling, developer libraries, firmware/BIOS support, and long validation cycles with OEMs and system integrators. Customer stickiness tends to emerge not from “brand” but from the engineering and qualification burden of replacing platforms in PCs, servers, networking gear, and embedded systems—an environment where reliability, performance consistency, and supply assurance matter.

💰 Revenue Streams & Monetisation Model

Intel monetises primarily through transactional sales of semiconductor products (CPUs and related components) to OEMs, distributors, and enterprise hardware suppliers. The monetisation profile is cyclical, driven by end-market demand for PCs, servers, and networking/edge compute. Key margin drivers include:
  • Product mix: data center and higher-value compute components typically carry better economics than legacy or lower-end segments.
  • Manufacturing yields and process maturity: gross margin is heavily influenced by wafer yields, defect density, and scaling costs.
  • Cost structure and fixed-cost absorption: utilization rates across fabrication capacity materially impact profitability in the semiconductor cycle.
  • Platform/software compatibility: while not a large standalone revenue line, compatibility supports pricing power and reduces customer switching friction.
Intel also monetises through IP-related arrangements and participation in ecosystem value chains, but the dominant business remains hardware sales with operating leverage tied to utilization and yield improvements.

🧠 Competitive Advantages & Market Positioning

Intel’s durability is tied to manufacturing scale and platform ecosystem rather than any single product line. The most important moat elements are:
  • Switching/Qualification Costs (Platform Stickiness): Server and enterprise environments require extensive validation (firmware/BIOS, driver stacks, performance testing, and security certification). That creates practical switching friction even when alternatives offer headline performance.
  • Cost Advantages via Scale and Supply Assurance: Large fabrication and packaging operations can enable competitive unit economics when process execution supports yields and utilization.
  • Intangible Assets (Developer Tooling + OEM/ODM Integration): Intel’s engineering workflow, libraries, and compatibility layers reduce integration risk for customers and integrators.
Competitive benchmarking (industry context):
  • AMD: Strong competition in server and client CPUs; AMD is largely a “design” competitor reliant on external leading-edge foundry capabilities.
  • NVIDIA: Dominant in accelerated computing and AI training/inference platforms, applying pressure at the compute layer where budgets shift toward GPUs and specialized accelerators.
  • TSMC (foundry ecosystem): A critical benchmark for leading-edge manufacturing execution. Intel’s manufacturing strategy competes on process performance, yields, and customer confidence in foundry roadmaps.
Positioning contrast: Intel competes not only on chip design, but also on the ability to deliver reliable, high-volume, leading-edge manufacturing. AMD and other fabless or design-focused peers compete primarily through architectures and design cadence, while TSMC competes through manufacturing execution—making Intel’s competitive center of gravity materially tied to manufacturing execution and ecosystem validation.

🚀 Multi-Year Growth Drivers

Over a 5–10 year horizon, Intel’s opportunity set is best understood through platform demand growth and TAM expansion in compute-intensive workloads:
  • AI-accelerated data center buildout: Enterprise AI adoption increases overall server counts, networking and infrastructure needs, and system heterogeneity. CPUs remain integral for host compute, memory orchestration, and platform control in many deployments.
  • Edge and industrial computing: Growth in factory automation, telecom edge, and ruggedized computing supports sustained demand for dependable architectures with long lifecycle support.
  • Onshoring and supply-chain resilience: Government and enterprise procurement policies increasingly value secure, regionally diversified semiconductor supply. This supports demand for manufacturing capacity and long-term supply contracts.
  • Foundry-enabled TAM: If Intel Foundry attracts design partners, the model shifts from purely product sales to a broader technology services opportunity—expanding the addressable market beyond Intel-branded chips.
The magnitude of value creation depends on execution: consistent process improvements, competitive platform performance, and customer confidence to qualify and standardize Intel-based platforms.

⚠ Risk Factors to Monitor

Structural threats that can impair Intel’s economics include:
  • Technology roadmap execution risk: Semiconductor competitiveness depends on consistent process and platform cadence. Process delays or yield shortfalls can compress margins and slow customer transitions.
  • Capital intensity and operating leverage: Fabrication is capital heavy. When utilization or mix underperforms, fixed-cost absorption can pressure profitability for extended periods.
  • Competitive substitution: Architectural competition (including alternative CPU ecosystems and accelerator-centric architectures) can reduce share within certain workloads.
  • Customer qualification cycles: Platform transitions are slow by design; if performance or supply confidence lags, switching may move away from Intel platforms and take multiple design cycles to reverse.
  • Geopolitical and regulatory exposure: Export controls, industrial policy, and supply-chain restrictions can alter demand composition, costs, and partner relationships.

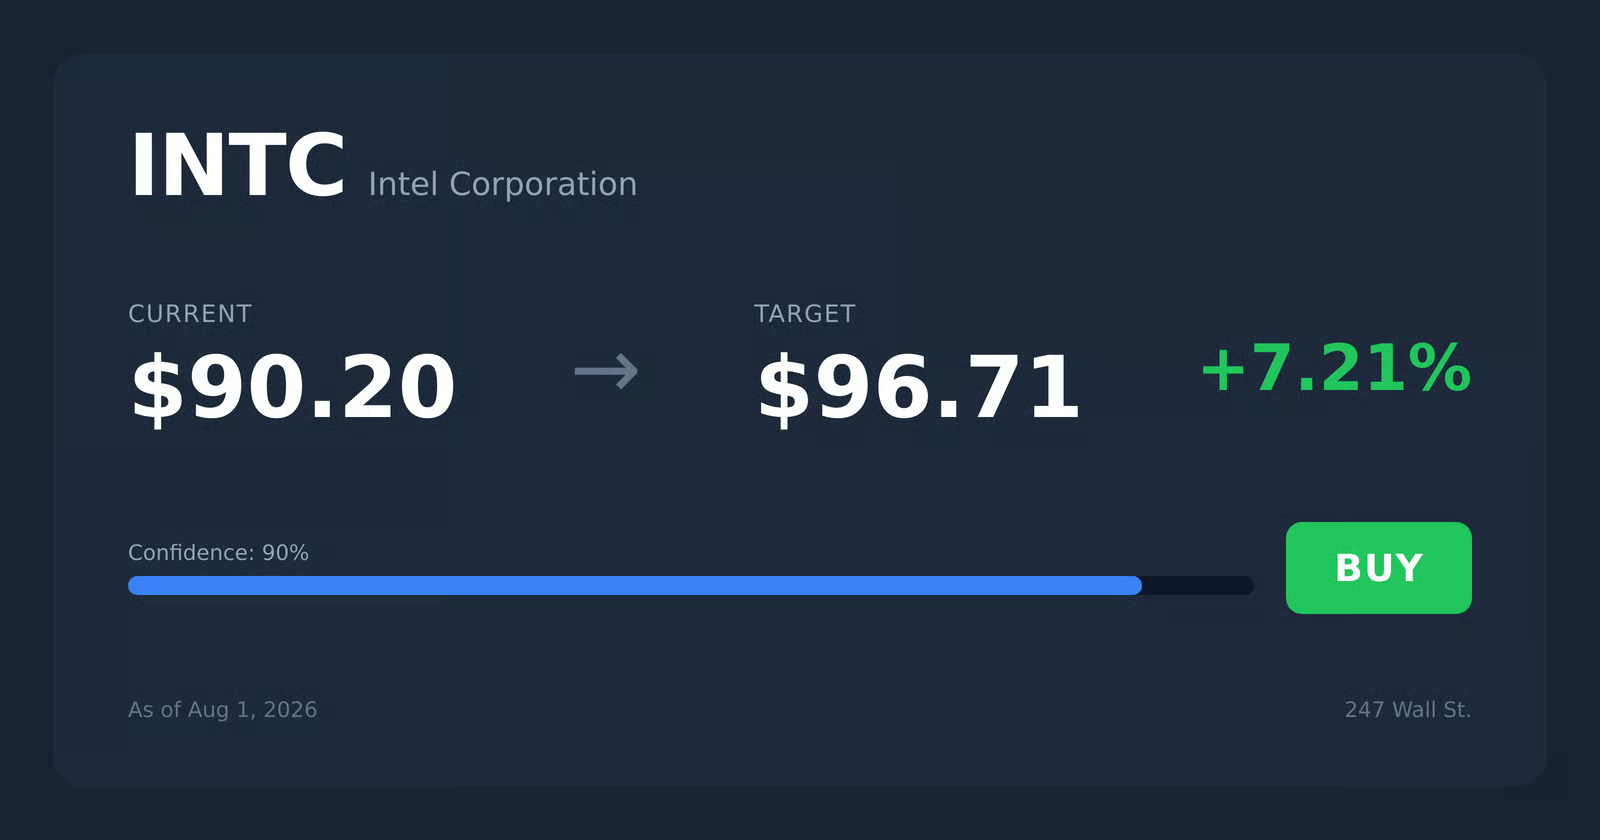
📊 Valuation & Market View

The market typically values semiconductors using EV/EBITDA, earnings power, and cash flow durability, with interpretation tied closely to gross margin trajectory and capex intensity. For Intel specifically, valuation sensitivity is driven by:
  • Gross margin and yield progress: improvements can expand EBITDA through utilization and cost absorption.
  • Operating leverage: utilization rates and fixed-cost absorption significantly influence earnings cyclicality.
  • Capex-to-sales outlook: a market reassessment occurs when capacity deployment and foundry economics move from “investment phase” toward steady returns.
  • Share-of-platform outcomes: sustained wins in enterprise and data center platforms can shift the market’s view of long-term earnings power.

🔍 Investment Takeaway

Intel is a high-quality franchise at the intersection of semiconductor manufacturing scale and enterprise platform stickiness. The core investment case rests on whether Intel can translate manufacturing execution into competitive platforms, strengthening qualification-driven switching friction and improving unit economics. Upside is tied to data center/edge compute expansion, AI infrastructure buildout, and potential foundry TAM expansion—while the principal risks are technology execution, capital intensity, and competitive substitution at the compute layer.

⚠ AI-generated — informational only. Validate using filings before investing.

📊 AI Financial Analysis

Powered by StockMarketInfo
Earnings Data: Q Ending 2026-03-28

"Headline (2026-03-28, Q1): Revenue $13.58B; EPS -$0.73; Net Income -$3.73B (net margin -27.5%). QoQ: Revenue edged down -0.7% vs Q4 2025 ($13.67B). Profitability weakened meaningfully: gross margin rose to 39.4% (from 36.1%), but the company swung from near-breakeven net income in Q4 2025 (-$0.59B) to a much larger loss in Q1 2026 (-$3.73B). Operating income fell to -$3.14B (from +$0.55B), with EBITDA turning negative (-$0.57B vs +$3.65B). YoY: Revenue was nearly flat (-0.6% vs Q1 2025 $13.53B). Net income deteriorated from a loss of -$2.92B in Q2 2025 to -$3.73B in the latest quarter (notably worse than the prior-year profitable quarter pattern seen in Q3 2025). Cash flow: Operating cash flow was +$1.10B, but free cash flow turned negative at -$2.54B due to heavy capex. Dividends remain $0, and share buybacks were $0 in the quarter. Shareholder returns: INTC’s stock shows very strong momentum (+256% 1Y), supporting total return even amid operating losses. Balance sheet resilience looks intact with large cash/investments ($32.8B) and substantial equity ($125.0B), though leverage remains meaningful (net debt ~$27.8B). Analyst sentiment is mixed given wide target range ($45–$110 vs ~$68.50 current), but the strong price trend is a clear positive."

Revenue Growth

Neutral

Revenue was roughly flat YoY (-0.6% vs the prior-year comparable quarter level in the dataset) and slightly down QoQ (-0.7% vs Q4 2025). No clear top-line acceleration.

Profitability

Neutral

Margins are volatile and currently contracting: net margin -27.5% in Q1 2026 vs -4.3% in Q4 2025, and operating income swung to -$3.14B from +$0.55B.

Cash Flow Quality

Caution

Operating cash flow remained positive (+$1.10B) but free cash flow turned negative (-$2.54B) due to large capex. No dividends and no buybacks in the quarter limit shareholder cash return.

Leverage & Balance Sheet

Neutral

Balance sheet supports liquidity with cash & short-term investments of ~$32.8B and equity of ~$125.0B. Leverage is still meaningful (net debt ~$27.8B; total debt ~$45.0B), but equity and assets remain stable.

Shareholder Returns

Strong

Total return tailwind is strong: stock gained +256.2% over 1Y (well above the >20% momentum threshold). Dividend yield is 0% and buybacks are absent, so returns are price-driven.

Analyst Sentiment & Valuation

Fair

Current price ~$68.50 sits near the consensus target ($74.82), with a wide range ($45–$110). Valuation looks uncertain given negative earnings (P/E not meaningful).

Disclaimer:This analysis is AI-generated for informational purposes only. Accuracy is not guaranteed and this does not constitute financial advice.

Fundamentals Overview

Loading fundamentals overview...

INTC’s Q1 2026 results beat guidance across revenue, gross margin, and EPS, driven by volume (including previously reserved inventory), pricing/mix actions, and notably better yields—especially on Intel 18A. AI-driven businesses now represent 60% of revenue and grew 40% YoY, with CCG launches (Core Ultra Series 3, Core Series 3) described as the strongest in five years. On the data center side, management stresses AI inference is pulling CPU back into the orchestration/control plane, with CPU:GPU usage moving from 1:8 toward 1:4. Despite strong server demand and improving foundry execution, the company guides Q2 gross margin down to 39% (from Q1’s 41%) due to heavier Intel 18A ramp mix and fading Q1 inventory benefits. Back-half risks center on rising substrates and memory costs offsetting yield gains, while PC demand is expected to weaken with full-year PC TAM down low double digits. Foundry losses remain elevated as 14A investments step up, even as capacity and packaging backlog expand for 2027 conversion.

AI IconGrowth Catalysts

  • Xeon server CPU demand outpacing supply; Intel 3-based Xeon 6 and Intel 18A-based Core Series 3 now in full-volume production ramp
  • Intel 3/18A advanced-node ramp plus better yields offset early-ramp costs, supporting gross margin expansion
  • AI-driven businesses (client + data center/AI) represent 60% of revenue and grew 40% YoY
  • Client launch momentum: Core Ultra Series 3 and Intel Core Series 3 mainstream-first rollout; strongest Core launch in five years
  • Intel 18A and Intel 14A foundry progress: 18A wafers running ahead of internal projections; Intel 14A yield/performance outpacing 18A at similar points

Business Development

  • Google: Xeon in production plus a multi-year long-term agreement (LTA) supporting Xeon/ASIC momentum for AI infrastructure buildout
  • NVIDIA: Xeon 6 selected as the host CPU for NVIDIA’s DGX Rubin NVL8 systems
  • SambaNova Systems: multiyear collaboration to design next-generation heterogeneous AI inference architecture combining SambaNova RDUs and Intel Xeon 6
  • SpaceX, xAI, and Tesla: partnership announced to support TeraFab (process and manufacturing efficiency exploration for semiconductor supply scaling)
  • Advanced packaging: added to backlog of advanced packaging services; multiyear expansion of back-end facilities in Malaysia (capacity to convert demand to revenue in 2027)

AI IconFinancial Highlights

  • Q1 revenue: $13.6B, $1.4B above the midpoint of guidance
  • Non-GAAP gross margin: 41%, ~650 bps ahead of guidance (drivers: higher volume including previously reserved inventory, mix, pricing; better yields on Intel 18A offset higher early-ramp costs)
  • Q1 non-GAAP EPS: $0.29 vs guidance of breakeven; includes ~$0.06 one-time gain in interest and other
  • Operating cash flow: $1.1B; gross CapEx: $5B; adjusted free cash flow: -$2B
  • CCG: revenue $7.7B, down 6% sequentially; operating profit $2.5B (33% of revenue), up ~$300M QoQ from mix/product margins, sales of previously reserved inventory, better 18A yields, and lower OpEx
  • DCAI: revenue $5.1B (+7% sequential, +22% YoY) above expectations; operating profit $1.5B (31% of revenue), up ~$292M QoQ from improved margins, cycle times and yields (notably Intel 3), and lower OpEx; ASIC revenue >+30% sequential and nearly doubled YoY
  • Intel Foundry: revenue $5.4B (+20% sequential); operating loss -$2.4B, improved $72M QoQ (better yields across Intel 4/3/18A) offset by increased 14A investment OpEx
  • Q2 guidance (midpoint $14.3B): gross margin 39%, tax rate 11%, non-GAAP EPS $0.20; Q2 GM down modestly vs Q1 from higher Intel 18A ramp mix and lack of Q1 inventory benefits
  • Full-year PC TAM: down low double-digit % in 2H (management expects PC demand to weaken); server CPU demand outlook improved over the last 90 days with expectation for strong double-digit unit growth in 2026 and momentum into 2027

AI IconCapital Funding

  • Q1 CapEx: $5B; 2026 CapEx forecast: flat YoY (vs prior flat-to-down); management expects space spend reduced materially while tool spend up YoY ~25%
  • Fab 34 Ireland transaction: repurchased 49% equity interest (deal closed) to capture full economic benefits; expected NCI net of ~$250M each in Q2/Q3/Q4 2026 and ~$1.1B in 2027 and 2028 (GAAP)
  • Funding for Fab 34 buyout: ~$7.7B cash and ~$6.5B new debt
  • Debt maturities: committed to retire $2.5B maturities this year and $3.8B in 2027
  • Cash flow: excluding Fab 34 buyout, still expects positive adjusted free cash flow for full-year

AI IconStrategy & Ops

  • Factory output optimization to close demand/supply gap: demand continues to run ahead of supply across businesses, especially Xeon server CPUs
  • Customer collaboration shortened timelines: teams worked with customers to reach outcomes in weeks, not months
  • Foundry execution: 18A wafers running ahead of internal projections; steady progress on Intel 4/Intel 3 and advanced packaging; 14A external engagements show yield/maturity/performance ahead vs 18A at similar stage
  • Packaging/wafer throughput emphasis: Intel Foundry output above expectations and steady yield improvements; 14A milestone completion noted
  • CapEx mix shift: space spend down while tool spend increases to catch up supply front
  • Roadmap execution: under-promise/over-deliver stance on customer announcements; no plan to announce foundry customers without customer opt-in

AI IconMarket Outlook

  • Q2 revenue guidance range: $13.8B to $14.8B (+2% to +9% sequential); at midpoint $14.3B
  • Q2 gross margin guidance: 39% at midpoint; tax rate 11%; non-GAAP EPS $0.20
  • Q2 revenue mix expectation: sequential revenue growth in both CCG and DCAI with improved supply and a full quarter of pricing actions; DCAI up double digits
  • Full-year PC unit TAM: down low double-digit % (consistent with industry peers/experts), with PC weakening in 2H
  • Server CPU demand: strong year of double-digit unit growth for industry and for Intel, momentum extending into 2027
  • Foundry: earlier design commitments expected to emerge beginning 2026 and expanding into 2027

AI IconRisks & Headwinds

  • Gross margin pressure in 2H: Intel 18A early-ramp mix is a headwind; Q2 GM down from Q1
  • Materials cost increases: substrates (glass substrates) and memory rising; explicitly cited as offsetting improvements in the back half of the year
  • Intel 18A ramp costs: rising input costs, especially memory, create growing headwinds in 2H
  • PC demand risk: management expects PC demand to weaken in 2H; full-year PC unit TAM down low double digits
  • Macro/geopolitical and policy uncertainty impacting customer behavior/investment decisions

Q&A: Analyst Interest

  • Topic: Q2 gross-margin drivers amid stronger server growth: Management outlined pricing benefit in Q2, noted mix effects are “plus or minus” but emphasized that 18A/ Panther Lake mix drags vs corporate average. Also flagged materials cost inflation (substrates and memory) as a key 2H offset despite yield progress.
  • Topic: Capacity scaling vs CapEx intensity: Management framed the shift from “efficiency and flattening layers” to customer/engineering execution focus. On foundry, they cited 18A yield improvements and 14A roadmap targets (0.5 PDK to 0.9 PDK) plus cycle-time work; avoided changing spend thesis based solely on demand.
  • Topic: Server CPU competitiveness and TAM growth mechanics: Management attributed improved CPU outlook to AI inference orchestration efficiency, shifting CPU:GPU ratio from 1:8 toward 1:4 (potentially parity). They positioned differentiated roadmap execution (Granite→Diamond→Coral Rapids) and highlighted unit-driven market model, with core-count expansion lifting revenue more than ASP.

Sentiment: MIXED

Note: This summary was synthesized by AI from the INTC Q1 2026 earnings transcript. Financial data is complex; please verify all metrics against official SEC filings before making investment decisions.

📋 Official Regulatory 10-K / 10-Q SEC Filings

Direct authenticated documentation links to audited SEC database reports for INTC.

SEC EDGAR Live Feed
No recent 10-K available.
No recent 10-Q available.
Loading financial data and tables...
📁

SEC Filings (INTC)

© 2026 Stock Market Info — Intel Corporation (INTC) Financial Profile