📘 IRADIMED CORP (IRMD) — Investment Overview
🧩 Business Model Overview
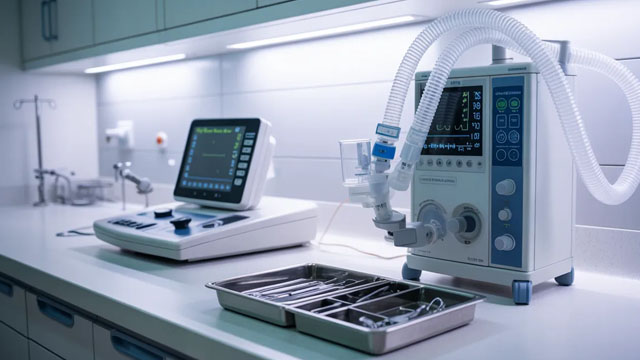
IRadimed develops and sells medical imaging power injectors and related solutions used to administer contrast media for diagnostic imaging workflows (e.g., CT, MRI, and angiography). The company’s value chain typically spans device manufacturing, installation support, training, and ongoing servicing of an installed base.
Once equipment is deployed, hospitals and imaging centers tend to source compatible replacement parts, consumables, and service—creating stickiness around both the physical system and the operating procedures staff rely on.
💰 Revenue Streams & Monetisation Model
Revenue is commonly driven by a mix of:
- Device sales (injectors/systems) tied to new imaging site builds and replacement cycles.
- Service and maintenance revenues derived from the installed base, often supported by recurring service contracts and spare-part demand.
- Related accessories/consumables that support ongoing operation and workflow integration.
Margin structure typically improves as the installed base grows, because service and parts generally exhibit more recurring characteristics than one-time device purchases. Over time, the primary monetisation lever is expanding serviceability and consumables usage around existing deployments rather than relying solely on new unit growth.
🧠 Competitive Advantages & Market Positioning
IRadimed’s competitive position is best understood through switching costs and installed-base economics. Hospitals integrate injectors into imaging workflows, radiology protocols, and staff training. Compatibility, maintenance familiarity, downtime risk, and procurement friction make re-platforming meaningfully costly.
These dynamics create a moat that becomes stronger with scale of deployments, because service, parts, and workflow adoption reinforce continued customer preference.
- Competitive benchmarking: Key competitors include ACIST Medical Systems and Bayer (Medrad) (both active in medical imaging injection systems). Additional competition can also arise from regional device vendors offering overlapping injection hardware.
- Positioning vs. rivals: Compared with larger global brands that compete across broad imaging capital categories, IRadimed’s industry focus is centered on injector solutions and the operational ecosystem around contrast administration—areas where installed-base service and workflow compatibility can tilt purchasing behavior.
🚀 Multi-Year Growth Drivers
- Secular imaging demand: Ongoing procedure growth in CT/MRI/angiography supports incremental injector placements and replacement cycles.
- Shift toward contrast-enhanced imaging: Wider adoption of contrast protocols increases demand for reliable injection systems designed for precision and safety.
- Installed-base expansion: New equipment deployments expand the future service and parts opportunity, supporting a durable revenue base across cycles.
- Workflow standardisation and safety expectations: As radiology departments standardize protocols, injector reliability, operational control, and support responsiveness become procurement differentiators.
- Geographic and modality penetration: Growth in imaging infrastructure—particularly in outpatient and ambulatory settings—expands total addressable demand for injection systems and supporting services.
⚠ Risk Factors to Monitor
- Regulatory and quality systems: Medical device manufacturing requires sustained compliance and product quality controls; adverse findings or recalls can impair supply and revenue.
- Capital expenditure sensitivity: Demand for new injector systems depends on hospital and imaging center budget cycles and replacement timing.
- Competitive pressure: Larger competitors and regional vendors may pressure pricing or increase marketing/contract bundling, particularly in conversion opportunities.
- Technology and product lifecycle risk: Customers may favor next-generation automation or integration features; failure to maintain product competitiveness can slow adoption.
- Supply chain and input cost volatility: Dependence on manufactured components can affect margin performance if component availability and costs shift.
📊 Valuation & Market View
Market participants typically value medical device and healthcare equipment providers using a combination of revenue-based multiples (e.g., EV/Sales) and earnings power metrics where service intensity and gross margin trends are visible. For IRadimed-like models, the key valuation drivers generally include:
- Installed-base growth (future service/parts visibility)
- Service mix and service profitability (recurring cash-flow characteristics)
- Device unit growth durability (new placements vs. replacement cycles)
- Gross margin and operating leverage as manufacturing scales and service penetration increases
Investors generally underwrite a longer-duration thesis around durability of customer relationships and the ability to convert installed equipment into recurring service and parts demand.
🔍 Investment Takeaway
IRadimed’s investment case rests on a structurally resilient installed-base moat driven by switching costs, workflow integration, and service/parts economics. Over a multi-year horizon, imaging procedure growth and the expansion of installed deployments can support continued conversion of one-time device sales into more recurring service-related revenue, while ongoing compliance and product competitiveness remain the principal determinants of outcomes.
⚠ AI-generated — informational only. Validate using filings before investing.