KB Home

KB Home (KBH) Market Cap

KB Home has a market capitalization of $3.37B.

Price: $54.97

-1.38 (-2.45%)

Market Cap: 3.37B

NYSE · time unavailable

CEO: Robert V. McGibney

Sector: Consumer Cyclical

Industry: Residential Construction

IPO Date: 1986-08-01

Website: https://www.kbhome.com

KB Home (KBH) - Company Information

Market Cap: 3.37B|Sector: Consumer Cyclical

Company Profile

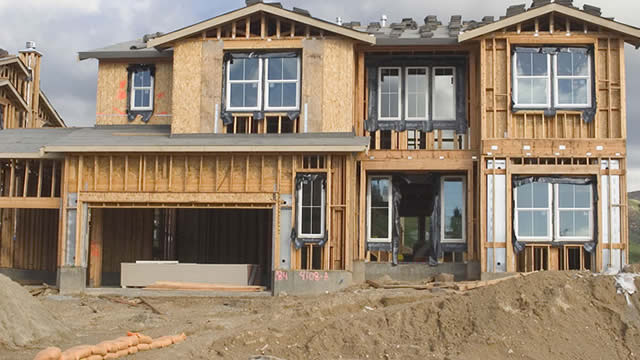
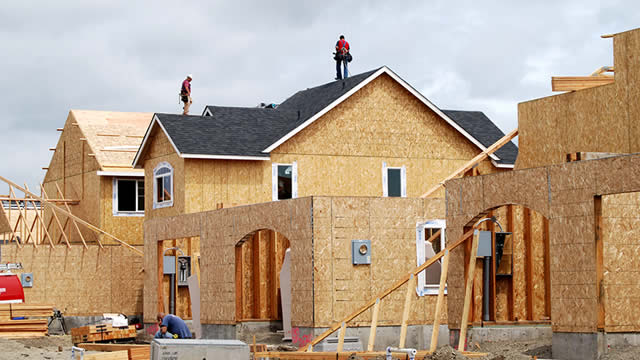
KB Home functions as a prominent residential construction enterprise across the United States. Its operations are strategically divided into four key geographical areas: the West Coast, Southwest, Central, and Southeast regions. The company is engaged in both constructing and selling a wide range of housing types, from attached and detached single-family dwellings to multi-family options like townhouses and condominiums. It serves a diverse clientele, including individuals purchasing their first home, those seeking their first or second upgrade, and active adult homebuyers. Beyond its core building activities, KB Home also extends financial services, offering products such as insurance and title processing. Its operational reach spans numerous states, including Arizona, California, Colorado, Florida, Nevada, North Carolina, Texas, and Washington. Founded in 1957, the company was initially known as Kaufman and Broad Home Corporation before officially adopting the name KB Home in January 2001, with its corporate headquarters located in Los Angeles, California.

Analyst Sentiment

52%
Hold

From 15 Active Polls

1Y Forecast: $61.00

▲ +11.0% Potential Upside

Consensus Target Metrics

Low Bound

$56

Median

$61

High Bound

$66

Average

$61

Price & Moving Averages

Loading chart...

🎯 Wall Street Analyst Intelligence Report

1-Year structural target targets, chart projections, and sentiment maps.

Average 1Y Target
$61.00
▲ +10.97% Upside
Low Target
$56.00
2% Risk
Median Target
$61.00
11% Mid
High Target
$66.00
20% Max
Consensus
Hold
10 / 44 Buys

Consensus Trend Projection

Trailing closures vs. 12-month metrics map.

Analyst Vote Distribution

Aggregate institutional coverage sentiment weights.

📊 Historical Valuation Multiples

Real-time Trailing Twelve Month (TTM) momentum side-by-side with discrete quarterly metrics.

Fiscal QuarterTTMQ2 2026Q1 2026Q4 2025Q3 2025Q2 2025Q1 2025Q4 2024Q3 2024
Period EndingTrailing 12MMay 31, 2026Feb 28, 2026Nov 30, 2025Aug 31, 2025May 31, 2025Feb 28, 2025Nov 30, 2024Aug 31, 2024
Market Cap ($M)3,3703,1803,9844,0884,2183,6494,3646,0396,234
Enterprise Value ($M)5,1694,9795,7055,5905,8505,2545,9097,1527,571
Price to Earnings Ratio (P/E)13.0929.0429.9910.089.698.4310.037.999.97
Price/Earnings-to-Growth Ratio (PEG)8.832.211.630.850.573.98
Price to Sales Ratio (P/S)0.612.863.702.412.602.393.143.023.56
Price to Book Ratio (P/B)0.900.841.031.051.080.911.071.491.56
Price to Free Cash Flow Ratio (P/FCF)9.30143.03-28.7513.9522.6923.25-12.6317.13-62.73
Enterprise Value to Sales (EV/Sales)4.485.303.303.613.444.253.584.32
Enterprise Value to EBITDA (EV/EBITDA)13.41114.61113.1140.1938.3334.6639.8827.8637.23
Debt to Equity Ratio4.670.530.500.440.500.480.440.420.43

📘 Full Research Report

ℹ️

AI-Generated Research: This report is for informational purposes only.

📘 KB HOME (KBH) — Investment Overview

🧩 Business Model Overview

KB Home is a U.S. residential homebuilder that develops and builds for sale detached and attached homes across selected metropolitan markets. The economic engine is a repeatable development-to-build-to-deliver workflow: acquire/position land (often with entitlements and infrastructure progress), plan product design and construction schedules, execute contracting and labor/material sourcing, and sell completed homes to end buyers (with potential incentives based on market conditions). Profitability depends on converting land and development cost into homes at a margin that holds through the construction cycle, while managing working-capital needs typical of homebuilding.

Customer “stickiness” is limited—buyers can choose any builder at purchase—so the durable source of advantage is primarily operational and cost-related rather than long-term contractual revenue.

💰 Revenue Streams & Monetisation Model

Revenue is predominantly transactional: home sale revenues recognized when homes close (deliver). Secondary streams may arise from related activities that can include land/lot development participation and other ancillary services, but the core monetisation remains the gross profit on home deliveries.

Key margin drivers are:

  • Home gross margin driven by pricing power versus incentives, construction cost discipline, and mix of products and communities.
  • Land and development economics (purchase basis, entitlement/impact fees, infrastructure progress, and the pace of absorption).
  • Operating leverage from maintaining production efficiency across cycles (labor productivity, subcontractor management, and procurement).
  • Working-capital dynamics that affect the ability to fund land and construction without overextending balance sheet risk.

🧠 Competitive Advantages & Market Positioning

KB Home competes in a commodity-like end market with differentiation coming from execution, land positioning, and cost control rather than brand-driven loyalty. The most defensible moat is a combination of cost advantage, development/land capabilities, and operational know-how that reduces the probability of margin compression during price swings.

  • Cost advantage (procurement + execution): builders that run efficient procurement and construction schedules can convert industry demand into better margins than peers when pricing normalizes.
  • Land and community pipeline: a portfolio of sites with sensible basis, entitlement readiness, and infrastructure planning can lower effective cost of producing homes and smooth the delivery schedule.
  • Local operating focus: consistent execution in selected markets supports subcontractor relationships, permitting familiarity, and logistical efficiency—reducing cycle-time and rework risk.

Competitive benchmarking:

  • Lennar (LEN): broad-based homebuilding with a strategy that can include strong production scale and varied community types; competes aggressively on delivery cadence and community selection.
  • D.R. Horton (DHI): among the largest U.S. builders, often leveraging scale in purchasing and lot development; competes through volume and operational throughput.
  • PulteGroup (PHM): mix of products spanning entry to move-up segments, with competition centered on product positioning and market presence.

KB Home’s competitive focus tends to emphasize disciplined execution and market selection rather than chasing every geography or product category. That choice can support steadier community-level economics when demand softens, though it remains exposed to the same macro drivers as peers (interest rates, housing affordability, and employment).

🚀 Multi-Year Growth Drivers

Over a 5–10 year horizon, KB Home’s opportunity is shaped less by share gains from a “winner-take-most” dynamic and more by the ability to monetize the housing demand-supply gap. Structural drivers include:

  • Household formation and demographic demand: net new households drive a baseline need for single-family housing over time.
  • Supply constraints: land availability, entitlement friction, infrastructure cost growth, and labor constraints limit rapid scaling by the entire industry, supporting normalized demand for builders that can develop communities efficiently.
  • Affordability-driven product mix: entry and workforce housing demand persists through the cycle; builders that manage incentives and construction cost in the right price band can better match buyer purchasing power.
  • Community lifecycle economics: once land is developed into sellable inventory, a disciplined delivery plan can convert capacity into cash flow across multiple seasons.

The long-term value proposition for investors depends on whether KB Home can sustain disciplined land selection and construction productivity so that it captures industry demand while avoiding excessive margin dilution during downturns.

⚠ Risk Factors to Monitor

  • Interest-rate and affordability sensitivity: homebuyer financing costs can change quickly, affecting demand and the level of incentives required to maintain absorption rates.
  • Construction and input cost inflation: labor productivity, material volatility, and supply chain disruptions can pressure margins if pass-through is limited.
  • Land cycle and inventory risk: overpaying for land, poor timing, or slow absorption can lead to impaired community economics.
  • Competitive pricing behavior: homebuilding often becomes promotional in weaker demand environments; sustained pricing pressure can compress returns.
  • Regulatory and permitting risk: local planning, building code requirements, impact fees, and infrastructure obligations can alter development economics.

📊 Valuation & Market View

Markets typically value homebuilders on a cyclical earnings and cash-flow framework, with emphasis on:

  • Earnings power through the cycle: investors track gross margin durability, SG&A leverage, and the ability to maintain operating efficiency.
  • Balance-sheet and liquidity: capital intensity and working-capital needs elevate the importance of leverage discipline and land financing terms.
  • Asset value considerations: book/tangible equity and land-related balance sheet dynamics can matter when earnings visibility is limited.
  • Macro sensitivity: housing starts, affordability metrics (driven by mortgage rates and income dynamics), and credit conditions can influence valuation multiples.

Catalysts that tend to move valuation include improved community economics, steadier absorption without heavy incentive reliance, and evidence that cost inflation is being managed faster than pricing declines.

🔍 Investment Takeaway

KB Home’s investment appeal rests on its ability to translate land development and construction execution into resilient community-level economics. The most meaningful “moat” is not switching costs or network effects, but rather the combination of cost discipline, land/community pipeline quality, and operational know-how that can protect margins relative to peers across housing cycles. The primary determinant of long-term outcomes is disciplined capital allocation in land and construction so the company can benefit from structural housing demand while limiting downside during affordability-driven slowdowns.


⚠ AI-generated — informational only. Validate using filings before investing.

📰 Market News & Coverage

15 Stories Available

Real-time institutional reporting and market updates for KBH.

prnewswire.com2026-07-31

KB HOME OPENS AURORA, A NEW COMMUNITY WITHIN ONE LAKE, A DESIRABLE MASTER PLAN IN FAIRFIELD, CALIFORNIA

New community, priced from the $590Ks and featuring resort-style amenities, is now open for tours. FAIRFIELD, Calif.

prnewswire.com2026-07-31

KB HOME OPENS POPPY AND QUINN WITHIN VALENCIA, A PREMIER LOS ANGELES COUNTY MASTER PLAN

Two new communities with resort-style amenities and close to award-winning schools are now open for tours. VALENCIA, Calif.

prnewswire.com2026-07-31

KB HOME OPENS ELOWEN: NEW TOWNHOMES FROM THE $390Ks IN LAS VEGAS

/PRNewswire/ -- KB Home (NYSE: KBH), one of the largest and most trusted homebuilders in the U.S., today announced the opening of Elowen, a new gated community

zacks.com2026-07-30

KB Home (KBH) Stock Falls Amid Market Uptick: What Investors Need to Know

KB Home (KBH) reached $56.35 at the closing of the latest trading day, reflecting a -1.21% change compared to its last close.

defenseworld.net2026-07-28

Dimensional Fund Advisors LP Sells 47,994 Shares of KB Home $KBH

Dimensional Fund Advisors LP lessened its stake in KB Home (NYSE: KBH) by 2.0% in the undefined quarter, according to the company in its most recent 13F filing with the Securities and Exchange Commission (SEC). The fund owned 2,310,462 shares of the construction company's stock after selling 47,994 shares during the quarter. Dimensional

zacks.com2026-07-27

Investors Heavily Search KB Home (KBH): Here is What You Need to Know

Zacks.com users have recently been watching KB Home (KBH) quite a bit. Thus, it is worth knowing the facts that could determine the stock's prospects.

prnewswire.com2026-07-24

KB HOME OPENS TOWNSEND: NEW PAIRED HOMES FROM THE MID $700s IN SANTEE, CALIFORNIA

New community in San Diego County within walking distance of local schools, parks and outdoor recreation is now open for tours. SANTEE, Calif.

zacks.com2026-07-23

KB Home (KBH) Down 8.2% Since Last Earnings Report: Can It Rebound?

KB Home (KBH) reported earnings 30 days ago. What's next for the stock?

defenseworld.net2026-07-23

KB Home (NYSE:KBH) Stock Crosses Above Two Hundred Day Moving Average – What’s Next?

KB Home (NYSE: KBH - Get Free Report)'s stock price passed above its 200-day moving average during trading on Wednesday. The stock has a 200-day moving average of $55.72 and traded as high as $56.82. KB Home shares last traded at $56.3710, with a volume of 1,103,333 shares changing hands. Analyst Upgrades and Downgrades A

zacks.com2026-07-14

Here is What to Know Beyond Why KB Home (KBH) is a Trending Stock

KB Home (KBH) has received quite a bit of attention from Zacks.com users lately. Therefore, it is wise to be aware of the facts that can impact the stock's prospects.

prnewswire.com2026-07-10

KB HOME OPENS MEADOWBROOK: NEW TOWNHOMES IN CAMPBELL, CALIFORNIA

CAMPBELL, Calif., July 10, 2026 /PRNewswire/ -- KB Home (NYSE: KBH), one of the largest and most trusted homebuilders in the U.S., today announced the opening of Meadowbrook, which offers a rare opportunity to own a new townhome in Campbell, California.

prnewswire.com2026-07-10

KB HOME OPENS TOBIANO: NEW HOMES FROM THE MID $400Ks IN SOUTHWEST LAS VEGAS

New community close to local schools, parks and outdoor recreation is now open for tours. LAS VEGAS, July 10, 2026 /PRNewswire/ -- KB Home (NYSE: KBH), one of the largest and most trusted homebuilders in the U.S., today announced the opening of Tobiano, a new community offering personalized homes in southwest Las Vegas.

prnewswire.com2026-07-10

KB HOME OPENS GREYHAWK AND SPARROW AT DUTTON MEADOWS IN SANTA ROSA, CALIFORNIA

Two new communities in the heart of Sonoma County, with homes from the mid $600Ks and within walking distance of local schools, are now open for tours. SANTA ROSA, Calif.

prnewswire.com2026-07-10

KB HOME NAMED ONE OF AMERICA'S BEST COMPANIES BY TIME

LOS ANGELES, July 10, 2026 /PRNewswire/ -- KB Home (NYSE: KBH), one of the largest and most trusted homebuilders in the U.S., has been named to TIME's America's Best Companies 2026 list. Presented by TIME and Statista, a leading provider of market and consumer data, the annual ranking recognizes top-performing U.S. companies that define modern business leadership.

prnewswire.com2026-07-09

KB HOME DECLARES THIRD QUARTER 2026 DIVIDEND

LOS ANGELES, July 9, 2026 /PRNewswire/ -- The board of directors of KB Home (NYSE: KBH) has declared a quarterly cash dividend of $.25 per share on the Company's common stock, payable on August 20, 2026 to stockholders of record on August 6, 2026. About KB Home KB Home is one of the largest and most trusted homebuilders in the U.S. We operate in 50 markets, have built over 700,000 quality homes in our nearly 70-year history, and are honored to be one of the top customer-ranked national homebuilders based on third-party buyer surveys.

📊 AI Financial Analysis

Powered by StockMarketInfo
Earnings Data: Q Ending 2026-05-31

"KB Home (KBH) reported Q2’26 revenue of $1.11B and net income of $27.3M (EPS $0.44). QoQ, revenue rose +3.24% ($1.08B in Q1’26) while net income declined -18.16% ($33.4M in Q1’26). YoY, revenue fell -34.25% versus Q2’25 ($1.53B), and net income also dropped -74.66% versus Q2’25 ($107.9M), indicating a significant earnings reset. Profitability contracted materially across the latest year: net margin decreased to 2.46% in Q2’26 from 7.05% in Q2’25 and 3.10% in Q1’26. Gross margin also slipped slightly QoQ (15.55% from 15.55% roughly flat) but the income statement deterioration stems from lower operating performance (operating margin 2.88% vs 3.38% in Q1’26) and higher expense pressure relative to revenue. Cash flow quality appears mixed/limited in the dataset: operating cash flow is shown as 0 in Q2’26 (data inconsistency), while prior quarters showed stronger operating cash generation (e.g., Q4’25). Balance sheet resilience: total assets were $6.78B with equity at $3.80B, while net debt remained high at $1.77B. Total shareholder return is modest on price momentum: the stock is up +8.24% over 1Y (below +20% threshold) and the dividend yield is ~0.49%, implying value is driven more by fundamentals than yield. Analyst consensus targets ($62) sit below the current price ($54.28), suggesting limited upside versus street."

Revenue Growth

Neutral

QoQ revenue improved +3.24% (Q1’26 to Q2’26), but YoY revenue declined -34.25% (Q2’25 to Q2’26), showing a clear downshift.

Profitability

Neutral

Net margin contracted to 2.46% in Q2’26 from 3.10% QoQ and 7.05% YoY; net income fell -18.16% QoQ and -74.66% YoY, with operating margin at 2.88% vs 8.81% in Q2’25.

Cash Flow Quality

Caution

Q2’26 operating cash flow is reported as 0 in the provided data, limiting confidence. Prior quarters showed positive operating cash flow (e.g., Q4’25 $306.8M; Q3’25 $197.7M), but the latest quarter’s cash conversion can’t be validated here.

Leverage & Balance Sheet

Neutral

Equity is stable at $3.80B and total assets are ~ $6.78B. However, leverage remains meaningful with net debt of $1.77B (down from $1.50B in Q4’25 but still elevated).

Shareholder Returns

Fair

1Y price change is +8.24% (no strong momentum), and dividend yield is ~0.49%. Buybacks are not evidenced in Q2’26 per provided cash flow, so total return is likely modest.

Analyst Sentiment & Valuation

Fair

Consensus target $62 vs price $54.28 implies some upside (~14%), but it is not enough to offset sharply weaker YoY earnings and margin compression.

Disclaimer:This analysis is AI-generated for informational purposes only. Accuracy is not guaranteed and this does not constitute financial advice.

Fundamentals Overview

Loading fundamentals overview...

KB Home’s Q2 2026 performance showed early stabilization from its strategic return to a predominantly built-to-order (BTO) model. The company reported $1.1B revenue and $0.43 diluted EPS, with housing gross margin at 15.2% GAAP and 15.7% excluding inventory charges. Sequential momentum matters: management highlighted sequential improvement in adjusted housing gross profit margin alongside a major operational win—BTO build times fell 8 days to 100 days—and inventory discipline improved finished unsold inventory to 11% from 25% in Q1. Demand remains challenged by affordability and mortgage-rate-driven consumer confidence, reflected in a softer traffic-to-sales conversion (absorption ~4 net orders/month), but cancellation rate stayed stable. The company refined 2026 guidance with Q3 deliveries of 2.6k–2.8k and Q3 gross margin of 16.0%–16.6%. Sequential margin math is explicit: +60 bps 2Q->3Q and ~+100 bps 3Q->4Q at the midpoints, supported by operating leverage, higher BTO mix, and favorable West Coast (Northern California/Bay Area) contribution.

AI IconGrowth Catalysts

  • Return to predominantly built-to-order (BTO): 73% of Q2 net orders were BTO (exceeded expected BTO net-order mix), supporting sequential backlog and more predictable deliveries
  • Build-time reduction: BTO home build times down 8 days sequentially to 100 days (lowest levels in more than a decade), enabling later-year selling for year-end delivery
  • Sequential operating and margin progression: management guided sequential improvements in gross margin across Q3 and Q4 as BTO mix and West Coast deliveries scale
  • Backlog momentum: backlog grew 26% sequentially to 4.53k homes; backlog up 45% since the beginning of the year and expected to return to YoY growth in Q3

Business Development

  • KBHS Home Loan joint venture: 83% capture rate of Q2 buyers using KBHS; average cash down payment ~15%; average customer profile cited (income ~$136k, FICO 741)
  • Community openings/expansions: Meridian (Henderson, NV) opened with 5 product lines; Sandstone (North Las Vegas, NV) scheduled to open later in 2026 with 4 product lines
  • Atlanta market re-entry: acquired first Atlanta land parcel; projected community opening in early 2027; targeting high-demand/top-10 housing market dynamics

AI IconFinancial Highlights

  • Q2 results: total revenue $1.1B and diluted EPS $0.43; revenues just above midpoint and met/exceeded midpoint of key guidance ranges
  • Revenue decline: Q2 housing revenues declined 27% YoY (from $1.52B prior year quarter) driven by 23% fewer homes delivered and 5% lower average selling price (ASP)
  • Gross margin trajectory: adjusted housing gross profit margin improved sequentially; GAAP housing gross profit margin was 15.2% in Q2 (vs 15.3% in Q1 and 19.3% in prior-year Q2)
  • Excluding inventory-related charges: housing gross profit margin was 15.7% in Q2, modestly above Q2 guidance range; sequential improvement from 15.5% in Q1
  • Inventory charges: Q2 included $5.6M total inventory charges, including $3.1M inventory impairment tied to a single community (not attributed to market factors)
  • Margin guidance: Q3 housing gross profit margin forecast 16.0% to 16.6%; full-year forecast 16.1% to 16.5% (assuming no inventory-related charges)
  • Sequential bps walk (management): midpoint Q3 margin 16.3% implies +60 bps sequential; midpoint Q4 step-up about +100 bps sequential
  • Operating leverage explicitly cited: ~+30 bps 2Q->3Q and ~+60 bps 3Q->4Q from operating leverage, plus mix/better BTO contribution and favorable West Coast mix
  • Tax: Q2 effective tax rate 26.6% vs 24.2% prior-year quarter; higher due to fewer stock-option exercises than expected; Q3 effective tax rate guided 19% to 21% (assuming exercise of all options) and full-year ~22% to 24%
  • Energy tax credits: impact expected to diminish in the second half due to elimination for homes delivered after June 30, 2026

AI IconCapital Funding

  • Share repurchase: repurchased 1.4M shares in Q2 for $75M (average price below current book value per share); YTD free-share repurchases 2.2M shares for $125M
  • Board authorization remaining: $775M remaining under current authorization
  • Dividends: paid ~$15M in Q2 (annualized yield ~2%)
  • Liquidity/financing: total liquidity $1.12B (including $200M cash and $923M available under revolver) with $275M revolver borrowings outstanding
  • Leverage: debt to capital ratio 34.1% at quarter-end vs 30.3% at year-end 2025; no debt maturities until June 2027
  • Third-quarter repurchase intent: plan for $50M to $100M of repurchases in Q3

AI IconStrategy & Ops

  • Back-to-BTO operating identity: emphasize sold backlog before foundations; Q2 net orders 3.32k with 73% BTO; cited benefits include lower margin risk, partner leverage, and improved margin quality
  • Inventory discipline: reduced finished unsold inventory to 11% of total production vs 25% in Q1
  • Production cadence: balanced construction pipeline; 3.99k homes in process with 77% sold; emphasis on even-flow weekly starts per community
  • Direct cost and lumber mitigation: lumber pressure offset via diversified wood species, lock periods, re-bidding and contract renegotiation, plus value engineering and studio simplification
  • SG&A: Q2 SG&A ratio 12.7% at midpoint; included $1.5M of corporate HQ relocation costs (Tempe, AZ) in 2027, with additional relocation expenses expected each quarter until completion

AI IconMarket Outlook

  • Q3 delivery guidance: 2.6k to 2.8k homes delivered
  • Q3 revenue guidance: $1.2B to $1.35B
  • Full-year 2026 delivery guidance: maintain midpoint; narrowed range to 10.5k to 11.0k homes delivered
  • Full-year 2026 revenue guidance: narrowed to $4.9B to $5.3B
  • Community count: Q2 ended with 280 active communities (+11% YoY); guided Q3 ending community count between 270 and 280 with expected step-down in 2H depending on sellout pace
  • Margin outlook: Q3 gross margin 16.0% to 16.6%; full-year 16.1% to 16.5% (excluding inventory charges); sequential improvement expected to continue through year-end

AI IconRisks & Headwinds

  • Consumer affordability remains pressured: management cited low consumer confidence tied to elevated mortgage rates, affordability pressures, rising inflation, and geopolitical uncertainties
  • Traffic-to-sales conversion softness: community absorption rate ~4 net orders per month; conversion challenged particularly in March/May amid mortgage rate movements and macro volatility
  • Material cost risk: lumber volatility noted; managed via diversified supply/lock periods and re-bidding, but remains a near-term risk
  • Margin sensitivity: gross margin erosion and reduced operating leverage cited as key drivers YoY decline in Q2; also dependent on mix (BTO vs spec coverage, regional West Coast mix)
  • Potential delivery trough effects from strategic repositioning: acknowledged a prior “temporary trough” in deliveries from returning to BTO; delivery pace and conversion remain sensitive to selling conditions

Q&A: Analyst Interest

  • Topic: Gross margin sequential leverage “normal year” vs unusual dynamics; Management’s detailed response: Management characterized the 30 bps 2Q->3Q and 60 bps 3Q->4Q operating leverage as a pretty normal trend, noting KB Home typically delivers more in the second half, and Q2 leverage was muted by the delivery trough from the prior repositioning.
  • Topic: Q4 ASP step-up drivers—BTO vs Bay Area; Management’s detailed response: Management confirmed the key drivers are scale leverage, BTO shift, and a favorable mix change expected in Q4, including higher-priced Bay Area/Northern California deliveries tied to West Coast regional mix. They did not isolate numeric contributions beyond stating all three factors matter for ASP and margin together.
  • Topic: Q4 BTO mix run-rate and how it affects 2027 carryover; Management’s detailed response: Management said they would not expect BTO to be fully at a single level, targeting BTO deliveries roughly in a plus-or-minus 70% range for Q4, while expecting some remaining spec coverage. For Northern California/Bay Area, they described it as structural, not merely a Q3/Q4 event.

Sentiment: MIXED

Note: This summary was synthesized by AI from the KBH Q2 2026 earnings transcript. Financial data is complex; please verify all metrics against official SEC filings before making investment decisions.

📋 Official Regulatory 10-K / 10-Q SEC Filings

Direct authenticated documentation links to audited SEC database reports for KBH.

SEC EDGAR Live Feed
Loading financial data and tables...
📁

SEC Filings (KBH)

© 2026 Stock Market Info — KB Home (KBH) Financial Profile