Knife River Corporation

Knife River Corporation (KNF) Market Cap

Knife River Corporation has a market capitalization of $4.21B.

Price: $74.16

-2.47 (-3.22%)

Market Cap: 4.21B

NYSE · time unavailable

CEO: Brian R. Gray

Sector: Basic Materials

Industry: Construction Materials

IPO Date: 2023-06-06

Website: https://www.kniferiver.com

Knife River Corporation (KNF) - Company Information

Market Cap: 4.21B|Sector: Basic Materials

Company Profile

Knife River Corporation provides aggregates-based construction materials and contracting services in the United States. It operates through six segments: Pacific, Northwest, Mountain, North Central, South, and Energy Services. The company mines, processes, and sells construction aggregates, including crushed stone and sand, and gravel; and produces and sells asphalt and ready-mix concrete, as well as provides contracting services to support the aggregate-based product lines, including heavy-civil construction, asphalt and concrete paving, and site development and grading. It serves federal, state, and municipal governments for various projects, such as highways, bridges, airports, schools, public buildings, and other public-infrastructure projects. The company was founded in 1917 and is based in Bismarck, North Dakota.

Analyst Sentiment

80%
Strong Buy

From 9 Active Polls

1Y Forecast: $99.75

▲ +34.5% Potential Upside

Consensus Target Metrics

Low Bound

$80

Median

$105

High Bound

$109

Average

$100

Price & Moving Averages

Loading chart...

🎯 Wall Street Analyst Intelligence Report

1-Year structural target targets, chart projections, and sentiment maps.

Average 1Y Target
$99.75
▲ +34.51% Upside
Low Target
$80.00
8% Risk
Median Target
$105.00
42% Mid
High Target
$109.00
47% Max
Consensus
Buy
5 / 7 Buys

Consensus Trend Projection

Trailing closures vs. 12-month metrics map.

Analyst Vote Distribution

Aggregate institutional coverage sentiment weights.

📊 Historical Valuation Multiples

Real-time Trailing Twelve Month (TTM) momentum side-by-side with discrete quarterly metrics.

Fiscal QuarterTTMQ1 2026Q4 2025Q3 2025Q2 2025Q1 2025Q4 2024Q3 2024Q2 2024
Period EndingTrailing 12MMar 31, 2026Dec 31, 2025Sep 30, 2025Jun 30, 2025Mar 31, 2025Dec 31, 2024Sep 30, 2024Jun 30, 2024
Market Cap ($M)4,2094,6303,9894,3674,6295,1065,7535,0593,883
Enterprise Value ($M)5,6166,0375,1205,5236,0046,2386,1985,5184,595
Price to Earnings Ratio (P/E)28.69-14.6131.167.6322.87-18.5861.808.5412.46
Price/Earnings-to-Growth Ratio (PEG)0.170.170.230.09
Price to Sales Ratio (P/S)1.3111.295.283.635.5514.448.754.584.81
Price to Book Ratio (P/B)2.702.972.432.723.173.633.903.492.99
Price to Free Cash Flow Ratio (P/FCF)-799.40-34.0728.8723.14-23.59-25.5045.2423.41-36.46
Enterprise Value to Sales (EV/Sales)14.726.784.597.2017.659.434.995.69
Enterprise Value to EBITDA (EV/EBITDA)11.32-188.1743.4720.4742.74-158.6475.6922.3930.12
Debt to Equity Ratio2.840.950.760.770.960.870.490.500.56

KNF Growth Runway Model

Standard long term linear growth fade

Multi-Stage Discounted Cash Flow Sandbox

Market Price$74.16
Intrinsic Value$46.68
Market Alignment
Overvalued by 37.1%relative to calculated intrinsic value
9.00%
Exp: 3%3%
i

Growth runway slowdown

This value provides a time window for the growth rate to decline beyond Stage 1 toward the terminal rate. Longer windows are most useful for companies with high growth starting conditions or strong competitive advantages. This option stretches out the growth rate slowdown across 5, 10, or 15-year steps. A high-growth starting condition (exceeding a 25% initial growth rate) automatically applies a curve decay to simulate realistic, rapid market saturation.
i

Terminal growth rate

With long-term inflation between 3-5%, revenue must grow by that baseline to maintain flat real-world market share. This value sets the permanent terminal growth rate to factor into the valuation beyond the growth slowdown runway toward maturity.

3-Stage Financial Runway Horizon

🧠 Perpetuity Horizon Engine (Stage 3: Post-2035)

Terminal FCF Base$0.34B
Perpetuity TV Value$6.31B
Discounted TV (PV)$2.67B
TV Weighting %59.5%
⚠️
Financial Model Disclaimer & Risk Disclosure: This interactive scenario simulator is an educational sandbox provided strictly for informational and analytical research purposes. Core historical financial statements and consensus estimates are sourced directly via Financial Modeling Prep (FMP). All downstream outputs are entirely deterministic, hypothetical projections generated by combining automated mathematical formulas (including linear interpolation and Gaussian bell-curve decay models) with user-selected variables and third-party financial data inputs. Users assume all liability for trading decisions executed based on these sandbox calculations.

📘 Full Research Report

ℹ️

AI-Generated Research: This report is for informational purposes only.

📘 KNIFE RIVER CORP (KNF) — Investment Overview

🧩 Business Model Overview

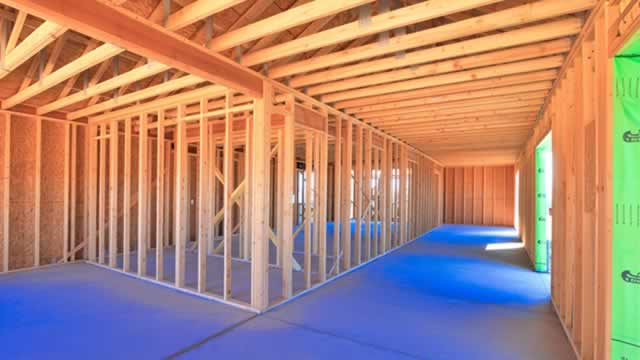
Knife River operates as a vertically integrated provider of construction services and construction materials. The company’s value chain starts with procuring and processing raw inputs (aggregates and related materials) through owned or controlled production sites, then converting those inputs into asphalt and concrete products (where applicable), and ultimately delivering finished roadwork services (paving and related heavy construction).

This end-to-end model matters because construction customers value reliable materials supply, predictable scheduling, and quality control—especially on time-constrained infrastructure projects. Knife River’s contracting capabilities also provide an additional demand channel for internally produced materials, reducing dependence on spot procurement during construction cycles.

💰 Revenue Streams & Monetisation Model

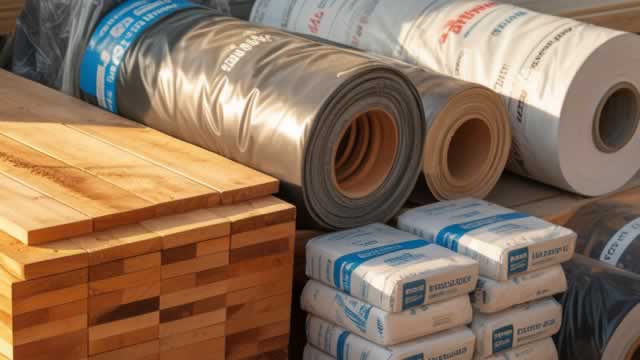
Revenue is primarily driven by construction contracting and related service activities (majority of economic exposure to project volume, mix, and pricing) alongside sales of construction materials (aggregates and asphalt/concrete-related products, depending on the operating segment and market).

Monetisation is largely transactional rather than recurring; however, margins are influenced by a set of repeatable operating levers:

  • Bid discipline and project mix: pricing execution on paving and heavy civil work versus lower-margin commodity-oriented activities.
  • Cost position in materials: the differential between delivered input costs and what the market can competitively supply.
  • Pass-through mechanisms: contractual indexation or pricing structures that mitigate asphalt binder and other input volatility.
  • Utilization and scale: higher equipment and plant utilization typically supports better unit economics.

🧠 Competitive Advantages & Market Positioning

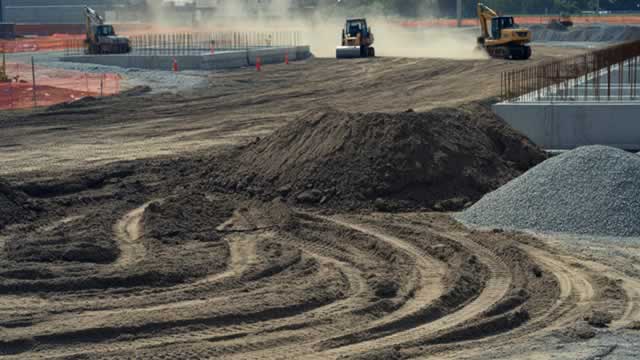
Knife River’s structural advantages primarily stem from geographic cost advantage and logistical infrastructure, supported by operational know-how and relationships formed through repeated project execution. Construction materials are inherently local: hauling distances and permitting constraints can dominate delivered cost. Knife River’s production footprint and proximity to job sites help compress logistics costs and improve schedule certainty.

In addition to cost advantages, Knife River benefits from customer stickiness typical of construction contracting: once a contractor demonstrates performance on specifications, safety, and delivery timelines, winning follow-on projects can become easier. While this is not a software-like “network effect,” it is a practical switching-cost dynamic driven by qualification processes, project risk, and the time required to mobilize competitive capacity.

Competitive benchmarking (primary peers):

  • Vulcan Materials and Martin Marietta — Large-scale construction aggregates producers with substantial regional resources. Their core emphasis is materials and quarry-linked supply; Knife River’s differentiation is the combination of materials access with contracting execution across specific markets.
  • Granite Construction — A heavy civil contractor with broader national project exposure. Granite is positioned more around contracting and project wins; Knife River’s positioning leans more heavily on localized integration of production and delivery to support margins in paving and related work.

Overall, Knife River competes on localized delivery and integration advantages rather than pursuing a purely national contracting model or purely commodity materials exposure.

🚀 Multi-Year Growth Drivers

The long-term opportunity is tied to the size and durability of the U.S. infrastructure maintenance backlog and the need for ongoing replacement and rehabilitation of roads, bridges, and related public works. Over a 5–10 year horizon, key drivers include:

  • Infrastructure maintenance and modernization: resurfacing, pavement rehabilitation, and bridge/road systems upgrades remain persistent demand categories.
  • Freight and mobility requirements: industrial throughput and route reliability support continued heavy construction spend.
  • Material and construction practice evolution: productivity improvements (planning, mix design optimization, and construction methods) can translate into better unit economics when paired with disciplined bidding.
  • Geographic “capacity matching”: local production access and dispatch reliability often determine who can execute efficiently within specific states and municipalities, supporting market share stability for well-situated operators.

TAM expansion is less about brand-new infrastructure creation and more about the sustained, recurring need to maintain and rebuild transportation assets. In this context, Knife River’s asset base and regional footprint can be leveraged across cycles through competitive execution.

⚠ Risk Factors to Monitor

  • Commodity and input volatility: asphalt binder and other key inputs can pressure margins if contractual pass-through is incomplete or timing mismatches occur.
  • Labor availability and wage inflation: construction execution is labor-intensive; shortages can affect productivity and unit costs.
  • Capital intensity and asset lead times: maintaining plant output, aggregates access, and equipment capacity requires sustained investment.
  • Environmental and permitting constraints: quarry expansion, plant emissions, stormwater rules, and reclamation requirements can raise costs and constrain supply.
  • Competitive pricing cycles: when industry capacity expands faster than demand, pricing pressure can reduce margins, particularly in bid-heavy markets.
  • Weather and seasonality: freeze-thaw conditions and construction season windows can affect utilization and working capital needs.

📊 Valuation & Market View

Equity valuation for construction and construction-materials operators typically reflects a mix of cyclical earning power and asset-based operating leverage. Market participants often emphasize:

  • EV/EBITDA and earnings-based multiples suited to cyclically exposed operating cash flows.
  • Operating margin durability driven by cost position, bid discipline, and mix.
  • Return on invested capital (ROIC) given the capital intensity and maintenance capex needs.
  • Balance sheet and leverage trends because working capital swings can be meaningful across project cycles.

“Multiple expansion” generally correlates with evidence of resilient cost advantage, disciplined bidding, and demonstrated ability to manage input volatility and utilization through cycles—rather than with a purely growth narrative.

🔍 Investment Takeaway

Knife River’s long-term value proposition rests on localized cost and logistics advantages from its materials footprint and its ability to translate that advantage into contracting execution. The company’s moat is primarily geographic (delivered-cost economics), reinforced by practical switching frictions in contractor qualification and project execution. The core investment question is whether Knife River sustains bid discipline and plant/equipment utilization while navigating input volatility and permitting constraints—supporting credible, cycle-resistant cash generation over time.


⚠ AI-generated — informational only. Validate using filings before investing.

📰 Market News & Coverage

15 Stories Available

Real-time institutional reporting and market updates for KNF.

marketbeat.com2026-05-11

Knife River Q1 Earnings Call Highlights

Knife River NYSE: KNF reported a stronger first quarter as higher activity across its markets lifted volumes, revenue and adjusted EBITDA, while management reaffirmed full-year guidance and said results are currently tracking toward the upper half of its outlook ranges.

seekingalpha.com2026-05-05

Knife River Corporation (KNF) Q1 2026 Earnings Call Transcript

Knife River Corporation (KNF) Q1 2026 Earnings Call Transcript

zacks.com2026-05-05

Compared to Estimates, Knife River (KNF) Q1 Earnings: A Look at Key Metrics

The headline numbers for Knife River (KNF) give insight into how the company performed in the quarter ended March 2026, but it may be worthwhile to compare some of its key metrics to Wall Street estimates and the year-ago actuals.

zacks.com2026-05-05

Knife River (KNF) Reports Q1 Loss, Beats Revenue Estimates

Knife River (KNF) came out with a quarterly loss of $1.4 per share versus the Zacks Consensus Estimate of a loss of $1.42. This compares to a loss of $1.21 per share a year ago.

businesswire.com2026-05-05

Knife River Corporation Reports First Quarter 2026 Financial Results

BISMARCK, N.D.--(BUSINESS WIRE)--Knife River Corporation (NYSE: KNF), an aggregates-based, vertically integrated construction materials and contracting services company, today announced financial results for the first quarter ended March 31, 2026. PERFORMANCE SUMMARY   Three Months Ended March 31,   (In millions, except per share) 2026 2025 % Change   Revenue $ 410.1   $ 353.5   16 %   Net loss $ (79.2 ) $ (68.7 ) (15 )%   Net loss margin   (19.3 )%   (19.4 )%               Adjusted EBITDA $ (3.

zacks.com2026-04-29

Owens Corning (OC) Expected to Beat Earnings Estimates: Can the Stock Move Higher?

Owens Corning (OC) possesses the right combination of the two key ingredients for a likely earnings beat in its upcoming report. Get prepared with the key expectations.

zacks.com2026-04-28

Will Knife River (KNF) Report Negative Earnings Next Week? What You Should Know

Knife River (KNF) doesn't possess the right combination of the two key ingredients for a likely earnings beat in its upcoming report. Get prepared with the key expectations.

zacks.com2026-04-28

Are Construction Stocks Lagging EMCOR Group (EME) This Year?

Here is how Emcor Group (EME) and Knife River (KNF) have performed compared to their sector so far this year.

defenseworld.net2026-04-27

Holcim (OTCMKTS:HCMLY) & Knife River (NYSE:KNF) Financial Survey

Holcim (OTCMKTS:HCMLY - Get Free Report) and Knife River (NYSE: KNF - Get Free Report) are both construction companies, but which is the superior stock? We will compare the two companies based on the strength of their risk, profitability, earnings, analyst recommendations, institutional ownership, dividends and valuation. Profitability This table compares Holcim and Knife River's net

businesswire.com2026-04-20

Knife River Corporation Announces First Quarter 2026 Results Conference Call

BISMARCK, N.D.--(BUSINESS WIRE)--Knife River Corporation (NYSE: KNF), an aggregates-based, vertically integrated construction materials and contracting services company, will host its first quarter 2026 earnings conference call at 11 a.m. EDT Tuesday, May 5, 2026. Financial results for the quarter will be released that morning before the NYSE market opens. A live webcast of the call, along with presentation slides, will be available in the Investors section of the Knife River website at investo.

seekingalpha.com2026-04-13

Knife River Remains Compelling As Focus On Growth Achieves Solid Growth

Knife River Corporation is outperforming the S&P 500 and remains a compelling 'Buy' due to robust growth and attractive valuation. KNF delivered strong Q4 2025 results, with revenue up 14.9% and significant gains in aggregates and ready-mix concrete volumes and pricing. An aggressive acquisition strategy, including the $454 million Strata purchase, is driving backlog growth and expanding geographic and operational scale.

defenseworld.net2026-03-24

Congress Asset Management Co. Cuts Stock Holdings in Knife River Corporation $KNF

Congress Asset Management Co. lessened its holdings in Knife River Corporation (NYSE: KNF) by 8.6% during the fourth quarter, according to its most recent filing with the Securities and Exchange Commission. The institutional investor owned 700,780 shares of the company's stock after selling 65,623 shares during the quarter. Congress Asset Management Co. owned

businesswire.com2026-03-23

Knife River Acquires Aggregates and Ready-Mix Business in Montana

BISMARCK, N.D.--(BUSINESS WIRE)--Knife River Corporation (NYSE: KNF) announced today that it has acquired the assets of Donaldson Brothers Ready Mix Inc., an aggregates-based ready-mix supplier in western Montana. This is Knife River's third acquisition in its Mountain Segment in 2026. Donaldson is a leading supplier of aggregates and ready-mix in the growing Bitterroot Valley, south of Missoula. In addition to three aggregates sources that provide the business with over 30 years of supply, Don.

defenseworld.net2026-03-21

Knife River Corporation (NYSE:KNF) Receives $97.43 Consensus Target Price from Brokerages

Shares of Knife River Corporation (NYSE: KNF - Get Free Report) have earned an average recommendation of "Moderate Buy" from the ten brokerages that are currently covering the stock, MarketBeat reports. One investment analyst has rated the stock with a sell recommendation, three have given a hold recommendation and six have given a buy recommendation to

defenseworld.net2026-03-04

Contrasting Knife River (NYSE:KNF) and James Hardie Industries (NYSE:JHX)

James Hardie Industries (NYSE: JHX - Get Free Report) and Knife River (NYSE: KNF - Get Free Report) are both construction companies, but which is the better investment? We will compare the two businesses based on the strength of their earnings, risk, profitability, dividends, analyst recommendations, valuation and institutional ownership. Risk and Volatility James Hardie Industries has

📊 AI Financial Analysis

Powered by StockMarketInfo
Earnings Data: Q Ending 2026-03-31

"KNF reported Q1 2026 revenue of $410.1M and net loss of $79.2M (EPS -$1.40). On a YoY basis, revenue rose from $353.5M in Q1 2025 to $410.1M (+16.1% YoY), but net income deteriorated from a loss of $68.7M to a larger loss of $79.2M (net income down by ~$10.5M, i.e., loss widened by ~15.3% YoY). QoQ, revenue fell from $755.1M in Q4 2025 to $410.1M (-45.7% QoQ) and net income swung from +$32.0M profit in Q4 to a -$79.2M loss in Q1. Profitability sharply contracted over the quarter: gross margin declined to -0.7% from +19.2% in Q4, and operating margin dropped to -21.0% (from +8.6% in Q4). Cash flow also weakened materially—operating cash flow was -$58.6M and free cash flow was -$135.9M in Q1, versus positive operating cash flow of +$195.9M and free cash flow of +$138.1M in Q4. Balance sheet leverage increased: total equity declined to $1.56B from $1.64B, while net debt rose to ~$1.41B. Total shareholder return is mixed in the provided market data: the stock is up YTD (+22.5%) and up 6M (+36.1%) but down 1Y (-4.2%); no strong 1-year momentum tailwind (>20%) is evident. Dividend/buybacks appear absent (dividends paid = 0; buybacks = 0 in the quarter)."

Revenue Growth

Neutral

Revenue increased +16.1% YoY ($353.5M to $410.1M) but declined -45.7% QoQ ($755.1M to $410.1M), indicating volatile demand/seasonality.

Profitability

Neutral

Margins collapsed: gross margin turned to -0.7% in Q1 2026 from +19.2% in Q4 2025; operating margin fell to -21.0%. Net loss of -$79.2M vs +$32.0M in the prior quarter.

Cash Flow Quality

Neutral

Operating cash flow was -$58.6M and free cash flow -$135.9M in Q1 versus +$195.9M OCF and +$138.1M FCF in Q4, showing deteriorating cash conversion.

Leverage & Balance Sheet

Caution

Equity declined to ~$1.56B (from ~$1.64B). Net debt rose to ~$1.41B from ~$1.13B in Q4, increasing leverage/risk, though liquidity remains adequate (current ratio ~2.67).

Shareholder Returns

Caution

Provided performance data shows YTD +22.5% and 6M +36.1%, but 1Y is -4.2%. No dividend and no buybacks reflected in the quarter’s cash flow.

Analyst Sentiment & Valuation

Caution

Consensus target ~$99.75 vs current price $89.12 implies modest upside (~12%). High/low range ($80–$109) suggests uncertainty, consistent with recent profitability volatility.

Disclaimer:This analysis is AI-generated for informational purposes only. Accuracy is not guaranteed and this does not constitute financial advice.

Fundamentals Overview

Loading fundamentals overview...

Knife River delivered a strong Q1 2026 start: revenue +16% and adjusted EBITDA +16% with a 290 bps margin expansion. The clearest performance engine was aggregates (26% volume growth) alongside disciplined cost controls, including >10% lower per-unit production costs and 390 bps gross margin improvement in the quarter. Pricing walked up modestly as-reported (+1%), but normalized mix lifted pricing to 4.1%, with Mountain’s significantly higher volumes benefiting from lower cost structures and reserve pull-through. Management reiterated full-year 2026 targets of mid-single-digit aggregates pricing improvement (as-reported) and at least +200 bps aggregate margin expansion despite diesel headwinds emerging in March; they quantified ~80% diesel exposure mitigation via surcharges, escalation clauses, forward contracting, and daily dynamic pricing. Backlog reached $1.2B with ~75% expected completed in 2026. Three aggregates-based acquisitions closed in Q1, with expected full-year contribution toward the upper half of guidance and vertical-integration synergy upside.

AI IconGrowth Catalysts

  • Record quarter contracting services backlog of $1.2 billion (about 75% expected to be completed in 2026), supporting 2026 construction activity
  • Aggregates volume expansion (up 26% YoY) driven by higher market activity and pull-through from backlog
  • Vertical integration profit “multiplier” from increased internal pull-through of upstream aggregates to downstream ready-mix/asphalt and self-performed asphalt paving
  • Process improvements and cost controls reducing per-unit aggregates production costs by more than 10%

Business Development

  • Completed 3 aggregates-based acquisitions in Q1 2026: Morgan Asphalt (Salt Lake City, Utah), Sparrow Enterprises (Montana), Donaldson Brothers Ready-Mix (Montana)
  • Salt Lake City expansion via Morgan Asphalt; continued operating footprint strengthening in Montana via Sparrow and Donaldson Brothers
  • Texcrete (mentioned as acquired late last year) supporting Central segment ready-mix volume nearly doubling in the quarter

AI IconFinancial Highlights

  • Revenue up 16% YoY; adjusted EBITDA up 16% YoY; adjusted EBITDA margin expanded by 290 basis points
  • Aggregates: 26% volume growth; pricing up 1% as-reported; normalized for geographic/product mix pricing up 4.1%; aggregate margin expansion goal of at least 200 bps for full year 2026
  • Aggregates gross profit margins up 390 basis points for the quarter; management noted diesel headwinds emerged later in March
  • Ready-mix: volumes up 33% YoY; Texcrete largest contributor with Texas volumes more than doubling; management expects full-year ready-mix volumes up mid-teens YoY
  • Asphalt: volumes up 42% YoY; management maintains mid-single-digit volume growth guidance for 2026
  • Contracting services: higher revenues across all segments; Central led gains (Texas and North Dakota). Margins down in Q1 attributed to seasonal/project timing effects (Q1 historically small portion of annual revenue)

AI IconCapital Funding

  • Maintenance & improvement CapEx: $42 million in Q1 2026
  • Growth initiatives CapEx: $209 million in Q1 2026, including $174 million for the 3 acquisitions and $35 million for aggregate expansions/greenfield projects
  • Reaffirmed expectation of no borrowing on revolving credit facility of $500 million by year-end 2026; management expects cash on hand and anticipated net leverage near long-term target of 2.5x
  • Management noted Q2 will reach the peak of annual borrowing needs due to working capital build for the construction season

AI IconStrategy & Ops

  • Dynamic pricing described as largely fully implemented across legacy operations; recently acquired companies still in training/transition but honored on existing quotes
  • Energy/diesel mitigation: prepurchase of diesel, energy escalation clauses in construction contracts, fuel surcharge clauses in material deliveries, fixed forward diesel contracts, and daily dynamic pricing for current cost structures
  • Energy exposure management: diesel use estimated at 20–25 million gallons annually; about 80% of diesel exposure mitigated through existing practices (per management)
  • Operations/actions: merging West Coast operations; Energy Services ended quarter with 40% improvement in EBITDA

AI IconMarket Outlook

  • 2026 guidance reaffirmed (no revisions until construction season fully underway): management expects 2026 to trend toward upper half of revenue and adjusted EBITDA ranges
  • Full-year aggregates guidance: mid-single-digit pricing improvement on an as-reported basis; at least 200 bps aggregate margin expansion
  • Backlog visibility: $1.2 billion backlog with ~75% expected completed in 2026

AI IconRisks & Headwinds

  • Diesel/oil price inflation risk (management stated headwinds began later in March; mitigation relies on surcharges, escalation clauses, forward contracts, and dynamic pricing)
  • Contracting services margin pressure in Q1 due to seasonal losses (Strata expected 2 additional months of seasonal losses in January and February) and mix/timing effects
  • First-quarter contracting services margins can be disproportionally impacted by project timing/type/geographic mix due to historically small portion of annual revenue

Q&A: Analyst Interest

  • Aggregates pricing/mix drivers: Management explained Q1 aggregates pricing was up ~1% as-reported, with 4.1% after normalizing geographic mix. They highlighted Mountain revenue up ~69% and a lower-cost structure/reserve pull-through, including more unprocessed pit run/bar run usage shaping product mix.
  • Diesel and margin confidence: Management linked aggregate margin outperformance to PIT Crews process work and existing mitigation practices that largely shield diesel exposure. They quantified diesel volume (20–25 million gallons/year) and stated ~80% mitigated, using surcharges, escalation clauses, fixed forward contracts, and daily dynamic diesel pricing into current bids.
  • M&A contribution, cadence, and synergies: Management said the three Q1 acquisitions (Morgan Asphalt, Sparrow Enterprises, Donaldson Brothers Ready-Mix) are similar to past deals and were negotiated at high single-digit multiples. They characterized full-year contribution as toward the upper half of guidance and emphasized vertical integration profit multiplier and PIT Crew/SG&A synergies.

Sentiment: POSITIVE

Note: This summary was synthesized by AI from the KNF Q1 2026 earnings transcript. Financial data is complex; please verify all metrics against official SEC filings before making investment decisions.

📋 Official Regulatory 10-K / 10-Q SEC Filings

Direct authenticated documentation links to audited SEC database reports for KNF.

SEC EDGAR Live Feed
Loading financial data and tables...
📁

SEC Filings (KNF)

© 2026 Stock Market Info — Knife River Corporation (KNF) Financial Profile