Liberty Broadband Corporation

Liberty Broadband Corporation (LBRDK) Market Cap

Liberty Broadband Corporation has a market capitalization of $4.89B.

Price: $34.04

0.68 (2.04%)

Market Cap: 4.89B

NASDAQ · time unavailable

CEO: Martin Edward Patterson

Sector: Communication Services

Industry: Telecommunications Services

IPO Date: 2014-11-05

Website: https://www.libertybroadband.com

Liberty Broadband Corporation (LBRDK) - Company Information

Market Cap: 4.89B|Sector: Communication Services

Company Profile

Liberty Broadband Corporation is a telecommunications holding company primarily engaged in providing communication services through its two main divisions: GCI Holdings and Charter. The GCI Holdings segment, operating predominantly in Alaska under the GCI brand, delivers a comprehensive suite of communication solutions. These include wireless, data, video, voice, and managed services, catering to a diverse clientele such as households, commercial enterprises, governmental bodies, and institutions in the education and medical sectors. The Charter segment offers a broad spectrum of services. For consumers, this encompasses subscription television services like Spectrum TV, which provides features such as video on demand, high-definition broadcasts, and digital video recording. It also delivers extensive voice services, including domestic and international calling, complemented by standard telephone features like voicemail, call waiting, caller ID, and call forwarding. Furthermore, Charter provides high-speed internet, offering managed in-home Wi-Fi solutions (complete with high-performance routers), public Wi-Fi access, mobile internet, and a cybersecurity suite designed to protect against computer viruses and spyware. Beyond residential services, this segment also extends its offerings to businesses. These include internet access, data networking, fiber optic connectivity for cellular towers and commercial buildings, specialized video entertainment, and business telephone systems. Additionally, Charter manages advertising sales across its cable television networks and digital platforms, and it operates its own regional sports and news networks. Liberty Broadband Corporation was established in 2014 and maintains its corporate headquarters in Englewood, Colorado.

Analyst Sentiment

77%
Strong Buy

From 2 Active Polls

1Y Forecast: $108.33

▲ +218.2% Potential Upside

Consensus Target Metrics

Low Bound

$89

Median

$91

High Bound

$145

Average

$108

Price & Moving Averages

Loading chart...

🎯 Wall Street Analyst Intelligence Report

1-Year structural target targets, chart projections, and sentiment maps.

Average 1Y Target
$108.33
▲ +218.24% Upside
Low Target
$89.00
161% Risk
Median Target
$91.00
167% Mid
High Target
$145.00
326% Max
Consensus
Buy
9 / 11 Buys

Consensus Trend Projection

Trailing closures vs. 12-month metrics map.

Analyst Vote Distribution

Aggregate institutional coverage sentiment weights.

📊 Historical Valuation Multiples

Real-time Trailing Twelve Month (TTM) momentum side-by-side with discrete quarterly metrics.

Fiscal QuarterTTMQ2 2026Q1 2026Q4 2025Q3 2025Q2 2025Q1 2025Q4 2024Q3 2024
Period EndingTrailing 12MJun 30, 2026Mar 31, 2026Dec 31, 2025Sep 30, 2025Jun 30, 2025Mar 31, 2025Dec 31, 2024Sep 30, 2024
Market Cap ($M)4,8934,7597,1816,9289,05613,10512,15510,63310,985
Enterprise Value ($M)5,7145,5809,6958,61710,77516,06415,81314,29814,608
Price to Earnings Ratio (P/E)-0.93-0.568.84-0.55-14.668.5511.369.1619.40
Price/Earnings-to-Growth Ratio (PEG)9.9623.992.98
Price to Sales Ratio (P/S)50.2145.7040.4341.93
Price to Book Ratio (P/B)1.231.211.221.221.021.261.211.091.15
Price to Free Cash Flow Ratio (P/FCF)-19.73-108.16-97.05-29.9989.67354.18935.00-168.79-305.15
Enterprise Value to Sales (EV/Sales)61.5559.4554.3755.76
Enterprise Value to EBITDA (EV/EBITDA)-1.60-1395.0141.97-2.1138.0731.7544.2932.9551.80
Debt to Equity Ratio-0.230.220.430.310.200.300.390.390.40

📘 Full Research Report

ℹ️

AI-Generated Research: This report is for informational purposes only.

📘 LIBERTY BROADBAND CORP SERIES C (LBRDK) — Investment Overview

🧩 Business Model Overview

Liberty Broadband Corp Series C is best understood as an equity investment vehicle with meaningful exposure to the U.S. cable broadband ecosystem, primarily through its controlling/major investments in Charter Communications (and related interests). The economic engine of the underlying businesses is the provision of fixed-line connectivity—delivering high-speed internet (and related services) through a physically built last-mile network.

In the cable value chain, capital is required to deploy and maintain coaxial/fiber plant and headend/distribution infrastructure. Once deployed, the business monetizes recurring residential and small-business subscriptions, supplemented by usage-driven upgrades and ancillary services. Customer stickiness is supported by (i) the technical and logistical difficulty of switching home/enterprise internet providers and (ii) the operational scale required to serve densely located footprint areas efficiently.

💰 Revenue Streams & Monetisation Model

Monetisation is dominated by recurring subscription revenue: broadband internet is the anchor, with additional revenue streams typically including pay-TV/streaming bundles (where applicable), voice, and other connectivity-related offerings. Revenue growth tends to come from a combination of:

  • ARPU expansion via tier upgrades, promotional renewals, and multi-product bundling.
  • Subscriber mix and retention as customers migrate to higher-speed service levels.
  • Enterprise/small-business monetisation where the network footprint supports scalable service delivery.

Margin structure is primarily driven by: (1) incremental network capacity and cost per unit of throughput at scale, (2) content/programming and customer acquisition costs where subscription TV exists, and (3) leverage of fixed operating cost bases over a large, retained subscriber base. Capital spending is a continuing requirement to refresh and upgrade network capability (e.g., modernization of cable plant and continued fiber-related densification where it improves performance and long-run cost).

🧠 Competitive Advantages & Market Positioning

Cable broadband’s competitive set is shaped less by technology novelty and more by deployment scale, last-mile footprint, and customer switching frictions. Liberty’s exposure to this ecosystem tends to benefit from structural incumbency advantages.

  • Switching Costs (High): Residential broadband is deeply embedded in daily life and often bundled with other services. Switching typically involves installation scheduling, equipment changes, and potential service disruption—creating practical inertia even when competitors offer promotional pricing.
  • Infrastructure Barriers / Cost Advantages (Structural): Replicating a dense last-mile network is capital-intensive and constrained by right-of-way access, permitting, and engineering complexity. Existing operators can spread overhead and maintenance costs across large subscriber bases.
  • Operational Scale (Economies of Density): Dense footprint areas allow better utilization of network segments and field operations, lowering cost per subscriber served relative to less scaled peers or fragmented entrants.

Competitive benchmarking:

  • Comcast: Another large U.S. cable operator with comparable infrastructure economics and competitive emphasis on broadband reliability and bundling.
  • AT&T and Verizon: Telco-focused competitors (fiber and fixed wireless mix). Their economics are driven by access to fiber buildout and spectrum/coverage strategy, which can shift upgrade paths but face different deployment constraints than cable operators.
  • Altice USA: A cable operator with different scale and footprint density, which can affect cost structure and the ability to finance upgrades on comparable terms.

Liberty’s industry focus (through Charter exposure) aligns with the cable broadband incumbency model—where network footprint scale and customer stickiness are the primary sources of durable market positioning, rather than differentiation through network effects or proprietary platforms.

🚀 Multi-Year Growth Drivers

  • Long-duration demand for higher-capacity broadband: Consumer and enterprise usage expansion supports periodic plan upgrades and sustained revenue per user improvement.
  • Network modernization and utilization: Ongoing upgrades increase usable capacity and improve performance, enabling higher tiers and better retention without commensurate proportional cost increases.
  • Bundle economics: Bundling (where offered) supports churn reduction and improves lifetime value by increasing the number of services tied to one provider.
  • Underpenetrated enterprise connectivity: Small business and higher-requirement residential segments can be served with packaging that typically yields better monetisation than basic plans, where network capability allows.

Over a 5–10 year horizon, the TAM expansion is less about introducing a new category of broadband and more about absorbing incremental capacity needs, maintaining service affordability through cost discipline, and selectively improving network economics through technology and operational execution.

⚠ Risk Factors to Monitor

  • Capital intensity and upgrade cadence risk: Broadband economics rely on sustained network investment. If upgrade costs rise faster than revenue and efficiency gains, free cash flow durability can be pressured.
  • Competitive pricing and promotions: Competition from telcos (fiber) and fixed wireless can intensify promotional pressure and raise churn, particularly in areas where alternative coverage is strong.
  • Regulatory and operational constraints: Right-of-way access, franchise obligations, and consumer protection rules can affect deployment timelines and operating costs.
  • Technology substitution risk: Fixed wireless improvements and capacity growth could shift share in specific geographies if service experience and price parity improve.
  • Holding-company structural risk: As an investment vehicle, Liberty’s per-share economics depend on the performance, capital needs, and distributions of underlying investments; corporate actions and market sentiment can influence outcomes independent of operating fundamentals.

📊 Valuation & Market View

Cable broadband and related telecom equities are typically valued using enterprise-value based metrics (e.g., EV/EBITDA) alongside cash flow durability considerations. For equity holders exposed through Liberty’s structure, investors often focus on:

  • Free cash flow conversion after network maintenance and modernization capex.
  • Distribution/disciplined capital allocation and the credibility of long-run payout capacity.
  • Competitive moat signals such as retention trends, ARPU trajectory, and the ability to limit churn through service quality and bundling.

Valuation sensitivity generally increases when markets anticipate either accelerated capex needs (reducing near-term cash flow) or intensifying competition (compressing margins through promotional activity).

🔍 Investment Takeaway

LBRDK offers exposure to the U.S. cable broadband incumbency model, where durable economics are supported by high practical switching costs, infrastructure and scale barriers, and ongoing capacity upgrades that enable monetisation through customer plan upgrades. The long-term thesis rests on maintaining network investment efficiency, defending retention through service quality and bundling, and limiting competitive erosion from fiber and fixed wireless across the footprint.


⚠ AI-generated — informational only. Validate using filings before investing.

📰 Market News & Coverage

15 Stories Available

Real-time institutional reporting and market updates for LBRDK.

seekingalpha.com2026-07-31

Madison Mid Cap Fund Q2 2026 Portfolio Activity

The top five contributors for the quarter were MKS, Amphenol, Arista Networks, Bio-Techne, and Waters. The bottom five detractors for the quarter were Ross Stores, Arch Capital, Copart, Gartner, and Brown & Brown. We purchased shares in Verisk Analytics, the dominant provider of data and analytics to property and casualty insurers in the U.S.

defenseworld.net2026-07-29

Liberty Broadband Corporation $LBRDK Shares Sold by Dimensional Fund Advisors LP

Dimensional Fund Advisors LP reduced its stake in shares of Liberty Broadband Corporation (NASDAQ: LBRDK) by 11.0% during the first quarter, according to the company in its most recent disclosure with the Securities and Exchange Commission. The institutional investor owned 2,360,674 shares of the company's stock after selling 291,072 shares during the quarter.

defenseworld.net2026-07-26

Liberty Broadband (NASDAQ:LBRDK) Hits New 12-Month Low – Here’s What Happened

Liberty Broadband Corporation (NASDAQ: LBRDK - Get Free Report) shares reached a new 52-week low during mid-day trading on Friday. The stock traded as low as $28.94 and last traded at $29.71, with a volume of 5806426 shares traded. The stock had previously closed at $30.40. Analysts Set New Price Targets LBRDK has been the

seekingalpha.com2026-06-05

A Gift From A Confusing Situation: Liberty Broadband Preferreds, The To-Be Charter Preferreds

Liberty Broadband preferreds present a compelling opportunity, trading at $22 versus a $25 par with mandatory 2039 redemption. LBRDP offers an 8%+ annual yield at the current trading price, a guaranteed capital gain at par, and a seamless transition to Charter Communications preferreds post-merger. Recent agreements ensure Liberty Broadband's liquidity and dividend safety, with Charter's $100M monthly buybacks and term loan facility reducing balance sheet risk.

forbes.com2026-05-10

What The Latest Media Earnings Blitz Reveals About Hollywood's Future

If there was a common message to be found in the flood of entertainment media company earnings reports over the last several days, one could argue it's that Hollywood appears to finally be done chasing streaming growth at all costs.

seekingalpha.com2026-05-08

Liberty Broadband Corporation (LBRDK) Q1 2026 Earnings Call Transcript

Liberty Broadband Corporation (LBRDK) Q1 2026 Earnings Call Transcript

defenseworld.net2026-04-01

31,650 Shares in Liberty Broadband Corporation $LBRDK Bought by Elser Financial Planning Inc

Elser Financial Planning Inc bought a new stake in shares of Liberty Broadband Corporation (NASDAQ: LBRDK) in the fourth quarter, according to its most recent 13F filing with the Securities and Exchange Commission. The fund bought 31,650 shares of the company's stock, valued at approximately $1,538,000. Liberty Broadband accounts for about 1.1% of

defenseworld.net2026-03-09

DLD Asset Management LP Makes New $4.64 Million Investment in Liberty Broadband Corporation $LBRDK

DLD Asset Management LP acquired a new position in shares of Liberty Broadband Corporation (NASDAQ: LBRDK) during the third quarter, according to the company in its most recent Form 13F filing with the Securities and Exchange Commission. The institutional investor acquired 72,957 shares of the company's stock, valued at approximately $4,636,000. DLD Asset

seekingalpha.com2026-02-15

Baron Discovery Fund Q4 2025: Winners, Laggards, Buys & Sells

In the fourth quarter of 2025, the Baron Discovery Fund returned 0.19% (Institutional Shares), trailing the Russell 2000 Growth Index by 1.03%. In these periods, low quality (high debt and poor profitability) and short-term price momentum-oriented stocks outperformed. Exact Sciences Corporation received a buyout offer in the fourth quarter by Abbott Laboratories (ABT) for a price of $105 in cash.

gurufocus.com2026-02-12

Wallace Weitz Exits CarMax Inc, Impacting Portfolio by -1.58%

Insight into Wallace Weitz (Trades, Portfolio)'s Strategic Moves in Q4 2025 Wallace Weitz (Trades, Portfolio) recently submitted the 13F filing for the fourth

seekingalpha.com2026-02-11

Liberty Broadband Corporation (LBRDK) Q4 2025 Earnings Call Transcript

Liberty Broadband Corporation (LBRDK) Q4 2025 Earnings Call Transcript

defenseworld.net2025-11-29

Charles Schwab Investment Management Inc. Raises Position in Liberty Broadband Corporation $LBRDK

Charles Schwab Investment Management Inc. raised its holdings in shares of Liberty Broadband Corporation (NASDAQ: LBRDK) by 0.6% in the undefined quarter, according to the company in its most recent disclosure with the Securities and Exchange Commission. The firm owned 1,025,474 shares of the company's stock after buying an additional 5,763 shares during

gurufocus.com2025-11-14

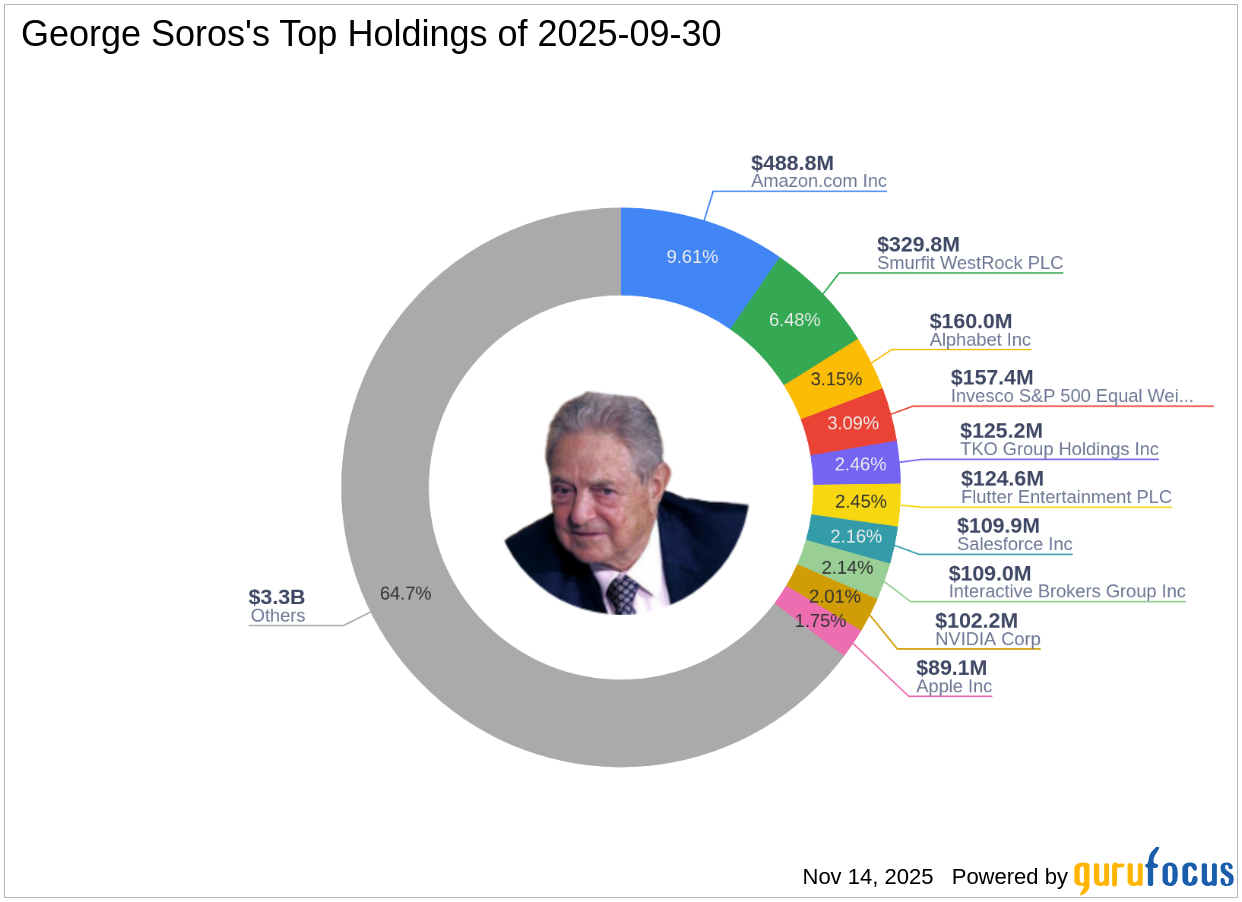
George Soros Significantly Increases Stake in Amazon.com Inc

Insight into Soros's Strategic Moves in Q3 2025 George Soros (Trades, Portfolio) recently submitted the 13F filing for the third quarter of 2025, providing ins

gurufocus.com2025-11-13

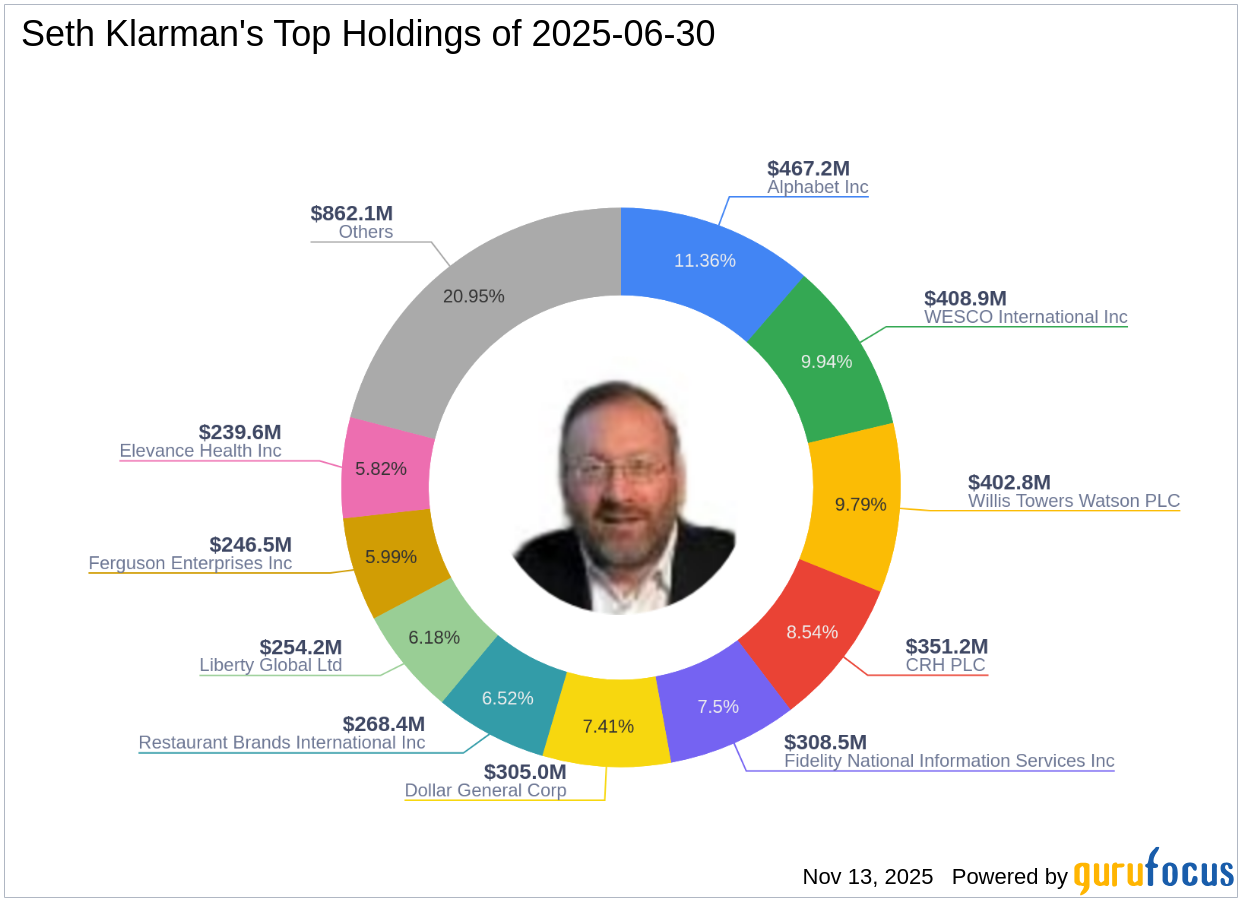
Seth Klarman's Strategic Moves: Union Pacific Corp Takes Center Stage with 7.43% Portfolio Share

Insight into Seth Klarman (Trades, Portfolio)'s Third Quarter 2025 Investment Adjustments Seth Klarman (Trades, Portfolio) recently submitted the 13F filing fo

seekingalpha.com2025-11-05

Liberty Broadband Corporation (LBRDK) Q3 2025 Earnings Call Prepared Remarks Transcript

Liberty Broadband Corporation ( LBRDK ) Q3 2025 Earnings Call November 5, 2025 11:15 AM EST Company Participants Shane Kleinstein - Head of Investor Relations Ronald Duncan - Co-Founder, CEO & Director Brian Wendling - Chief Accounting Officer & Principal Financial Officer Presentation Operator Greetings. Welcome to the GCI Liberty 2025 Q3 Earnings Call.

📊 AI Financial Analysis

Powered by StockMarketInfo
Earnings Data: Q Ending 2026-06-30

"LBRDK reported Revenue of $0 and Net Income of -$3.46B in 2026-06-30 (Q2 2026). EPS was not provided (reported as 0 in the dataset). QoQ, Net Income deteriorated from +$0.20B in 2026-03-31 (Q1 2026) to -$3.46B, a swing of -$3.56B. YoY, Net Income shifted from +$0.38B in 2025-06-30 (Q2 2025) to -$3.46B, a deterioration of -$3.85B. Profitability metrics are effectively non-comparable on this quarter’s statement because Revenue is reported as $0 while major line items (e.g., other income/expense and tax) drive the loss. Over the last four quarters, the company moved from profitability (Q2 2025: positive net margin) to material losses (Q4 2025 and Q2 2026), implying contracting economic performance. Cash flow also weakened: operating cash flow was -$0.04B in Q2 2026 and free cash flow was -$0.04B. Balance-sheet risk increased materially: total assets fell to $5.68B from $9.85B (Q1 2026), while short-term debt remained very high at $0.86B and cash dropped to $43M. From a shareholder-return perspective, the stock is down -27.9% over 1 year, so total shareholder return is likely negative absent dividends/buybacks (none reported)."

Revenue Growth

Neutral

Revenue is reported as $0 in both 2026-06-30 and 2026-03-31, so QoQ and YoY revenue growth is not meaningful. Prior-year Q2 (2025-06-30) showed $261M revenue, implying the current period’s disclosure/operations may have materially changed.

Profitability

Neutral

Net Income fell from +$203M (Q1 2026) to -$3.46B (Q2 2026), and from +$383M (Q2 2025) to -$3.46B (Q2 2026). Margin data is not usable because Revenue is reported as $0; nevertheless, losses are clearly expanding QoQ and YoY.

Cash Flow Quality

Neutral

Operating cash flow was -$44M in Q2 2026 vs -$74M in Q1 2026 (slightly less negative QoQ), but still weak. Free cash flow was also -$44M. Dividends and buybacks are not indicated.

Leverage & Balance Sheet

Neutral

Total assets declined sharply to $5.68B (from $9.85B in Q1 2026). Equity is lower at $3.75B (vs $5.90B in Q1 2026). Cash fell to $43M while short-term debt is $864M, indicating reduced balance-sheet resilience.

Shareholder Returns

Neutral

MarketPerformance shows -27.9% 1Y and -6.1% 6M, which is a headwind for total shareholder returns. No dividend or buyback support is evident from the financials provided.

Analyst Sentiment & Valuation

Neutral

With price at $55.23 and consensus target around $108.33, implied upside exists; however, given the large earnings deterioration and balance-sheet stress in the latest quarter, valuation signals appear less reliable.

Disclaimer:This analysis is AI-generated for informational purposes only. Accuracy is not guaranteed and this does not constitute financial advice.

Fundamentals Overview

Loading fundamentals overview...

So what: In Q1 2026, LBRDK’s Alaska operator (GCI) showed modest top-line softness (revenue -4% YoY) while profitability fell harder (adjusted OIBDA -18% YoY), partly offset by described one-time/compare items. Consumer momentum improved via gross margin expansion to 72.2% and wireless subscriber growth, supported by the GCI+ free-for-a-year promotion and stabilizing broadband losses. The larger lever is the Quintillion deal: a $310 million acquisition plus up to $50 million capex reimbursement and potential earn-outs, funded alongside a planned $160 million unsecured loan. Management expects first-year free-cash-flow accretion post-close, with network resilience gains aimed at competing against LEO alternatives. However, pro forma leverage worsens to ~2.7x after the loan, and margins remain pressured by distribution costs tied to Quintillion service restoration. Capital intensity remains heavy (2026 CapEx guidance ~$290 million, peak year), keeping free cash flow under pressure despite stabilization in subscriber trends.

AI IconGrowth Catalysts

  • Definitive acquisition of Quintillion expected to be accretive to free cash flow in first year post-closing; expands fiber rings/sub-rings for resilience and routing diversity to compete versus LEO broadband alternatives
  • GCI+ “free for a year” wireless promotion driving consumer postpaid wireless line growth and supporting convergence; retention from prior unlimited test drive promotion in low 90% range
  • Near completion of Alaska plan build-out to increase wireless speeds across served communities and support 5G coverage for all covered Alaskans

Business Development

  • GCI Liberty invested approximately $107 million to acquire Searchlight Capital Partners equity interest in Liberty Latin America; subsequent completion of acquisition of a 6% equity interest from Searchlight
  • In discussions to acquire additional Liberty Latin America shares from Dr. John Malone (Chairman, Board of GCI Liberty and Director Emeritus) and certain affiliates to increase equity/voting stake
  • Definitive agreement to acquire Quintillion for $310 million cash (subject to adjustments), plus reimbursement of up to $50 million for pre-closing Quintillion capital expenditures, and potential earn-out payments
  • GCI will provide a $160 million unsecured loan to Quintillion pursuant to acquisition agreement
  • Quintillion described as a wholesale provider serving largely schools and health care providers; examples named include ACS and smaller local telephone companies throughout Alaska

AI IconFinancial Highlights

  • GCI Q1 revenue $256 million, down 4% YoY; adjusted OIBDA $93 million, down 18% YoY
  • Year-over-year comparability items ~ $13 million impact: ~$4 million benefit in Q1 2025 from successful appeal of rates for certain health care customers; ~$2 million net benefit in prior quarter related to repaired Quintillion fiber break; ~$4 million increase in operating expenses for more efficient operations; ~$3 million public company costs added in 2026 vs prior year
  • Consumer gross margin increased to 72.2% (driven by lower consumer direct costs from decreased video programming costs); Business gross margin decreased to 77.3% (driven by higher distribution costs related to restored service on Quintillion fiber network)
  • Capital expenditures net of grant proceeds $55 million in Q1; 2026 CapEx guidance ~$290 million including ~$20 million carryover from 2025 timing shifts; 2026 expected to be peak CapEx year (15% to 20% of revenue historically after stepping down)
  • Trailing-12-month free cash flow $99 million, down ~13% YoY, driven largely by higher CapEx net of grant proceeds and working capital swings

AI IconCapital Funding

  • GCI Liberty consolidated cash/cash equivalents/restricted cash: $448 million total; $131 million at GCI
  • Total principal debt at GCI Liberty: ~ $1 billion; consolidated net leverage 1.6x at quarter end (incorporates parent cash including proceeds from last quarter rights offering and GCI nonvoting preferred stock)
  • GCI Liberty leverage: 2.3x at quarter end per credit agreement; credit facility had $377 million undrawn capacity net of letters of credit
  • Subsequent to quarter end: acquisition of 6% Liberty Latin America equity interest from Searchlight for $107 million
  • Pro forma leverage: consolidated net leverage 2.3x after Searchlight equity + considering other transaction effects; pro forma consolidated leverage ~2.7x after $160 million unsecured loan to Quintillion

AI IconStrategy & Ops

  • Exit of video business completed in Q3 of prior year; Q1 consumer revenue decline majority driven by video shutdown and data subscriber losses
  • Business wireless losses described as small and driven by ordinary churn and gradual shift of business accounts to consumer side; magnitude not material
  • Broadband loss pace decreasing/stabilizing tied to GCI+ promotional offer and network speed/reliability improvements
  • Planned acquisition expected to enhance network resilience with more robust architecture comprised of multiple rings and sub-rings

AI IconMarket Outlook

  • 2026 CapEx expected to peak, then step down over coming years back to historical range of 15% to 20% of revenue; guidance total 2026 CapEx ~$290 million including ~$20 million carryover
  • Management stated business expected to remain stable going forward (after noting stabilizing broadband base)
  • Liberty Latin America preferred distribution: referenced as 9% preferred later this summer

AI IconRisks & Headwinds

  • Data subscribers down 3% YoY to 150,500; lost 700 data subscribers in quarter due to continued competitive pressure from wireless substitution and limited competition from Starlink
  • Business gross margin pressure in Q1 from higher distribution costs tied to restored service on Quintillion fiber network (reflecting operational disruption impacts)
  • Quintillion-related leverage increase risk: pro forma GCI leverage rising from 2.3x to ~2.7x after proposed $160 million loan
  • Free cash flow down YoY (~13%) driven by higher CapEx net of grant proceeds and working capital swings

Q&A: Analyst Interest

  • Business wireless losses: Management said business wireless losses were small and reflected ordinary churn, with a gradual decline as business accounts transition to the consumer side. They stated loss magnitude is not material to the overall company situation.
  • Liberty Latin America investment thesis: Management emphasized a strategic undervaluation/investment inflection rather than purely a tax-advantaged cash flow play. They confirmed preferred benefits would be sheltered but said they entered before recapitalization, expecting substantial free-cash-flow inflection.
  • Quintillion transaction details and counterparties: Management was unable to break out total Quintillion payments, but said they represent more than half of Quintillion revenues. They described Quintillion as a wholesale provider, not a customer competitor, selling services to remarketers including schools and health care providers (ACS and smaller local telcos).

Sentiment: MIXED

Note: This summary was synthesized by AI from the LBRDK Q1 2026 earnings transcript. Financial data is complex; please verify all metrics against official SEC filings before making investment decisions.

📋 Official Regulatory 10-K / 10-Q SEC Filings

Direct authenticated documentation links to audited SEC database reports for LBRDK.

SEC EDGAR Live Feed
Loading financial data and tables...
📁

SEC Filings (LBRDK)

© 2026 Stock Market Info — Liberty Broadband Corporation (LBRDK) Financial Profile
Liberty Broadband Corporation (LBRDK) Market Cap, Stock Analysis & Valuation