LyondellBasell Industries N.V.

LyondellBasell Industries N.V. (LYB) Market Cap

LyondellBasell Industries N.V. has a market capitalization of .

No quote data available.

CEO: Peter Z. E. Vanacker

Sector: Basic Materials

Industry: Chemicals

IPO Date: 2010-04-28

Website: https://www.lyondellbasell.com

LyondellBasell Industries N.V. (LYB) - Company Information

Market Cap: -|Sector: Basic Materials

Company Profile

LyondellBasell Industries N.V. operates as a chemical company in the United States, Germany, Mexico, Italy, Poland, France, Japan, China, the Netherlands, and internationally. The company operates in six segments: Olefins and Polyolefins Americas; Olefins and Polyolefins Europe, Asia, International; Intermediates and Derivatives; Advanced Polymer Solutions; Refining; and Technology. It produces and markets olefins and co-products; polyolefins; polyethylene products, which consist of high density polyethylene, low density polyethylene, and linear low density polyethylene; and polypropylene (PP) products, such as PP homopolymers and copolymers. The company also produces and sells propylene oxide and its derivatives; oxyfuels and related products; and intermediate chemicals, such as styrene monomers, acetyls, ethylene glycols, and ethylene oxides and derivatives. In addition, it produces and markets compounds and solutions, such as polypropylene compounds, engineered plastics, masterbatches, engineered composites, colors, and powders; and advanced polymers. Further, the company refines crude oil and other crude oils of varied types and sources into gasoline and distillates; develops and licenses chemical and polyolefin process technologies; and manufactures and sells polyolefin catalysts. LyondellBasell Industries N.V. was incorporated in 2009 and is headquartered in Houston, Texas.

Analyst Sentiment

57%
Buy

From 18 Active Polls

1Y Forecast: $80.20

▲ +0.0% Potential Upside

Consensus Target Metrics

Low Bound

$53

Median

$76

High Bound

$100

Average

$80

Price & Moving Averages

Loading chart...

🎯 Wall Street Analyst Intelligence Report

1-Year structural target targets, chart projections, and sentiment maps.

Average 1Y Target
$80.20
▲ +24.34% Upside
Low Target
$53.00
-18% Risk
Median Target
$76.00
18% Mid
High Target
$100.00
55% Max

Consensus Trend Projection

Trailing closures vs. 12-month metrics map.

Analyst Vote Distribution

Aggregate institutional coverage sentiment weights.

Sentiment volume allocation data unavailable.

Historical valuation matrix unavailable.

📘 Full Research Report

ℹ️

AI-Generated Research: This report is for informational purposes only.

📘 LYONDELLBASELL INDUSTRIES NV CLASS (LYB) — Investment Overview

🧩 Business Model Overview

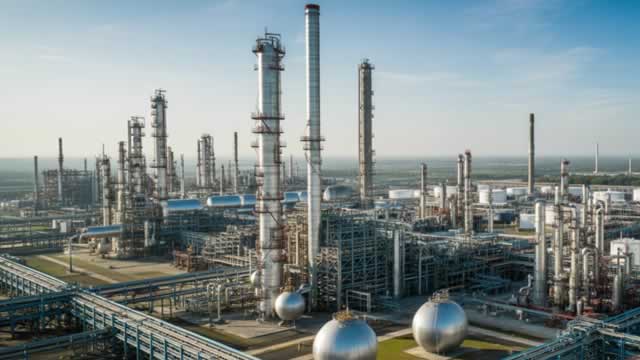
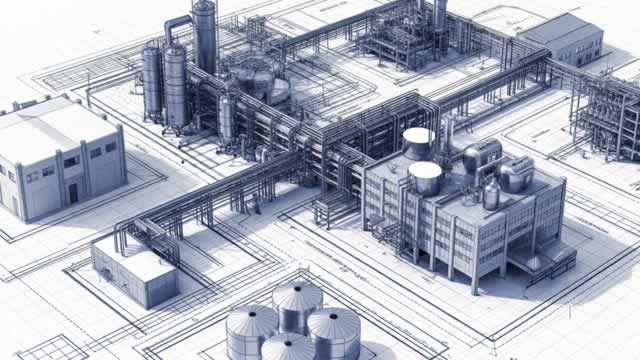
LyondellBasell is a global producer of olefins, polyolefins, and key chemical intermediates used across packaging, consumer goods, automotive components, and industrial applications. The value chain runs from feedstock procurement to conversion into base chemicals (olefins such as ethylene and propylene), followed by upgrading into higher-value plastics and intermediates (including polyethylene and polypropylene grades).

Profitability is driven by the ability to turn relatively advantaged feedstock into competitively positioned polymers and chemical products, while maintaining high asset utilization and cost discipline. The business also benefits from scale and an integrated manufacturing footprint that reduces per-unit logistics and distribution burdens relative to smaller or more purely commodity-focused players.

💰 Revenue Streams & Monetisation Model

Revenue is primarily transactional and spread-driven: LYB sells commoditized and semi-specialty polymers and intermediates whose selling prices track commodity benchmarks, while realized margins depend on regional product differentials and the relationship between product pricing and feedstock costs.

Key margin drivers typically include:

  • Feedstock economics: the cost and availability of ethane/propane (and other supply sources) versus the value of downstream products.
  • Asset utilization and operating reliability: capacity conversion into sellable product with minimal unplanned downtime.
  • Product mix: higher-margin grades and intermediates that can improve blended margins during commodity cycles.
  • Logistics efficiency: lower delivered costs via proximity to advantaged supply and end-market distribution routes.

🧠 Competitive Advantages & Market Positioning

LYB’s competitive moat is best characterized as a combination of Low-Cost Feedstock and Logistical Infrastructure, reinforced by scale and process know-how. In chemicals, market share is often won not through “brand,” but by achieving superior unit economics: converting low-cost inputs into competitively priced outputs delivered to customers with reliable supply.

Low-Cost Feedstock + Regional Cost Advantage

In North America, access to natural gas liquids can support lower ethane/propane-based feedstock costs than regions reliant on alternative feedstocks. When global product prices remain broadly stable, regional feedstock differentials can translate into persistent margin advantages—especially when assets are positioned to monetize those differentials into olefins and polyolefins.

Logistical Infrastructure

A global manufacturing network with distribution reach supports competitive delivered pricing and reduces working-capital strain by improving flow of product to customers. Proximity to feedstock basins and end-market demand centers also helps reduce transportation costs and can improve responsiveness to regional demand shifts.

Competitive Benchmarking

  • Dow: Broad chemical portfolio with significant polyolefins exposure; competitive primarily through integration and manufacturing footprint, with feedstock economics varying by site.
  • ExxonMobil Chemical: Large-scale producer with strong integration; competitive strengths include advantaged assets and global reach, but margin outcomes depend heavily on regional feedstock and capacity balance.
  • Chevron Phillips (CPChem): Strong in polyolefins and olefins with a focus on hydrocarbon-based feedstock chains; competition centers on cost position and operational performance in overlapping geographies.

Compared with these peers, LYB’s positioning emphasizes capturing regional feedstock advantages where manufacturing is aligned to lower-cost supply and supported by scale and logistics that help sustain conversion economics across cycles.

🚀 Multi-Year Growth Drivers

Over a 5–10 year horizon, growth is expected to be driven less by unit volume expansion in a uniformly growing market and more by value realization: improving margins through cost positioning, capturing incremental demand in end markets, and allocating capital toward advantaged capacity.

  • Structural demand for plastics in packaging and consumer/industrial applications, supported by lightweighting and material efficiency.
  • Product grade evolution: demand for performance-linked polyolefins (processability, mechanical properties, and barrier/strength characteristics) that can support better pricing discipline than plain commodity output.
  • Regional capacity allocation: continued emphasis on building or optimizing assets where feedstock and logistics economics are favorable.
  • Operational excellence as a compounding lever: improved yield, reliability, and maintenance execution can lift realized economics without requiring structurally higher market prices.
  • Transition and compliance alignment: investment to meet evolving environmental standards can reduce the cost of compliance over time relative to less-prepared competitors, improving competitive survivability in constrained regulatory environments.

⚠ Risk Factors to Monitor

  • Commodity cycle and margin compression risk: polymer and intermediate prices are cyclical; margins can contract when supply additions outpace demand.
  • Feedstock spread volatility: changes in natural gas liquids economics can erode regional cost advantages, especially if alternative feedstocks become comparatively cheaper.
  • Capital intensity and execution risk: maintenance turnarounds and growth projects require disciplined execution; delays or cost overruns can pressure cash flows.
  • Regulatory and environmental liabilities: emissions rules, permitting, and waste-management requirements can increase operating costs and constrain site flexibility.
  • Technology/process disruption: substitution by alternative materials, shifts in polymer specifications, or breakthroughs in competing processes can affect long-term demand for certain grades.
  • Operational and safety risk: chemical manufacturing is exposed to process safety and reliability issues that can cause downtime and inventory write-offs.

📊 Valuation & Market View

LYB is typically valued through enterprise value to profitability multiples such as EV/EBITDA or EV/EBIT, reflecting that earnings capacity is highly dependent on cycle conditions. Market participants also anchor on drivers that move spreads and cash generation:

  • Feedstock-product spread environment and regional cost position
  • Utilization and operating reliability
  • Net leverage and balance-sheet resilience (particularly through downcycles)
  • Capex discipline and the conversion of capital into sustained margin dollars

Because the sector’s fundamentals are cyclical, valuation tends to oscillate with expected normalized margins and perceived balance-sheet strength rather than growth in a steady-state earnings model.

🔍 Investment Takeaway

LYB’s long-term investment appeal rests on structural unit-cost advantages: aligning manufacturing assets to low-cost feedstock economics and supporting global competitiveness through logistical infrastructure. In a market where polymers are often priced as commodities, sustained outperformance depends on keeping conversion economics superior—via operational excellence, disciplined capital allocation, and protection of regional cost position versus major peers such as Dow, ExxonMobil Chemical, and Chevron Phillips.


⚠ AI-generated — informational only. Validate using filings before investing.

📊 AI Financial Analysis

Powered by StockMarketInfo
Earnings Data: Q Ending 2026-03-31

"Headline (2026-03-31, Q1): Revenue $7.20B and net income $125M (EPS $0.38). QoQ: Revenue +1.4% (vs. $7.09B in 2025-12-31) and net income turned positive vs. a net loss ($-140M). YoY: Revenue -6.2% (vs. $7.68B in 2025-03-31) and net income decreased -28.4% (from $175M). Profitability improved sequentially: gross margin rose to 9.7% from 6.5% in Q4, and operating margin improved to 3.3% from -0.6%. YoY, margins are mixed: net margin improved vs. Q1 2025 (1.7% vs. 2.3% was lower), but gross margin is higher than Q1 2025 (9.7% vs. 7.2%). Cash flow was weak in the quarter: operating cash flow was -$269M and free cash flow -$538M, driven by an unfavorable working-capital swing (change in working capital -$826M). Balance sheet remains stable for a capital-intensive manufacturer: total assets $33.96B, equity ~$10.0B, and total debt $14.25B. Net debt was about $11.6B, slightly down from $12.5B in Q4. Shareholder returns appear supportive: the stock is up 18.5% over 1 year (price momentum positive but below the >20% threshold). Dividend yield is ~0.86%, and the quarter included no buyback/issuance data provided, so total return likely relies mainly on price performance. Analyst consensus target ($79.3) is modestly above the current price ($66.27), suggesting limited upside versus broader cyclicality risk."

Revenue Growth

Caution

QoQ revenue +1.4% (Q1’26 vs Q4’25) but YoY revenue -6.2% (Q1’26 vs Q1’25), indicating a soft underlying demand/volume backdrop.

Profitability

Positive

Sequential improvement with net income moving from -$140M (Q4) to +$125M (Q1) and operating margin expanding to 3.3% from -0.6%. YoY net income declined -28.4%, but gross margin is higher than Q1’25 (9.7% vs 7.2%).

Cash Flow Quality

Neutral

Operating cash flow was -$269M and free cash flow -$538M in Q1’26, driven by a large working-capital outflow (-$826M). Prior quarter cash flow was strongly positive (+$1.51B), so volatility is high.

Leverage & Balance Sheet

Neutral

Balance sheet is reasonably stable: total assets ~$34.0B and equity ~$10.0B. Net debt eased to ~$11.6B from ~$12.5B in Q4, but leverage remains meaningful (debt/equity elevated).

Shareholder Returns

Neutral

1-year price change +18.5% (positive momentum but not >20%). Dividend yield ~0.86% provides limited contribution; buyback activity is not evident in the provided Q1 cash-flow line items.

Analyst Sentiment & Valuation

Neutral

Consensus target $79.3 vs. price $66.27 implies modest upside. Valuation appears not cheap on earnings (P/E ~51.9 in the ratios), consistent with cyclicality and recent earnings variability.

Disclaimer:This analysis is AI-generated for informational purposes only. Accuracy is not guaranteed and this does not constitute financial advice.

Fundamentals Overview

Loading fundamentals overview...

LYB delivered strong Q1 performance amid a structurally tighter petrochemicals environment driven by Middle East conflict, with EPS of $0.49 and EBITDA of $615 million (+~50% aided by March improvement). Cash generation remained exceptional: last-12-month EBITDA-to-cash conversion was 111% versus an 80% target, helped by working-capital discipline (trade working capital down $450 million vs a year ago) and timing of tax payments. The company is leaning into price and volume momentum—polyethylene orders show strength and management executed sizable April/May pricing initiatives ($0.50/lb PE cumulative; $0.10/lb PP spread cumulative in both months). The major swing factor is execution: Bayport PO/TBA downtime reduced EBITDA by about $40 million in Q1, but restart is expected toward end of Q2 with meaningful upside. Risks are primarily duration/second-order demand and margin velocity constraints (APS contractual pricing limits). Capital remains disciplined (capex $269 million; dividend cut and $224 million paid in Q1) while portfolio transformation (four European asset sales) increases flexibility.

AI IconGrowth Catalysts

  • Channelview PO/TBA plant running above benchmark rates
  • Hyperzone reliability and acetyls debottlenecks to deliver incremental value (incremental growth via reliability improvements)
  • MoReTec-1 construction ramping toward end-2027 (expected to increase EBITDA by ~$400 million when realized)
  • VEP continuing to drive down costs and increase reliability/productivity
  • APS: continued customer-centric focus driving volume momentum; APS EBITDA up 26% YoY in Q1

Business Development

  • Sale completed of four European assets (portfolio transformation milestone; increased resilience/flexibility)
  • Middle East joint ventures continued to operate largely as planned (I&D context and regional cost-advantaged assets)

AI IconFinancial Highlights

  • Q1 diluted EPS: $0.49
  • Q1 EBITDA: $615 million; improved nearly 50% sequentially/YoY drivers cited as seasonal trends plus March market improvement
  • Cash conversion (last 12 months): 111% of EBITDA into cash vs long-term target of 80%
  • Working capital discipline: trade working capital was $450 million lower on March 31 vs a year prior despite higher volumes/prices
  • Cash balances: $2.6 billion; liquidity: $7.3 billion at quarter end
  • Q2 intentional working-capital build expected due to higher prices/operating rates and opportunity capture
  • Effective and cash tax rates guided for 2026: 15% to 20%
  • Dividend: Board approved 50% quarterly reduction; $224 million returned to shareholders through dividends in Q1

AI IconCapital Funding

  • Operating cash consumed: $269 million (Q1 pattern; linked to low end-2025 inventory and intention to capture higher prices/demand in 2026)
  • Capital investments funded in Q1: $269 million
  • Dividend reduction: 50% (capital rebalancing for flexibility)
  • Management emphasis on repaying 2026 and 2027 debt maturities prefunded in 2025 (no exact debt balance disclosed in transcript)

AI IconStrategy & Ops

  • Fixed costs: Q1 fixed costs under $50 million lower than Q1 2025 (including closure costs)
  • Headcount reduced by ~3,000 positions (~15%) since end-2024 via fixed cost reductions and portfolio management (including European asset sale)
  • APS transformation framed as customer-centric growth with cost/productivity/portfolio changes; EBITDA +55% in 2025 and +26% YoY in Q1
  • Operational targeting: O&P Americas crackers ~95% in Q1; 2Q expected 90% utilization of nameplate capacity in the segment

AI IconMarket Outlook

  • O&P Americas: order books strong—April polyethylene orders 20% above pre-war averages
  • Price actions: cumulative $0.50/lb polyethylene across April and May; cumulative $0.10/lb polypropylene spread increases in both months
  • O&P Americas: expect ~90% utilization of nameplate capacity during Q2
  • O&P Europe/Asia/International: expect ~80% operating rates across the segment during Q2
  • Intermediates & Derivatives: target ~75% operating rates in Q2 due to Bayport PO/TBA downtime
  • Bayport PO/TBA restart: expected toward end of Q2; estimated earnings impact ~$25 million per week while down
  • Technology segment: Q2 results expected only slightly lower than Q4 2025 (improving from shipment timing and licensing milestones)

AI IconRisks & Headwinds

  • Geopolitical disruption (Middle East conflict) expected to extend beyond year-end; persistent crude oil geopolitical risk premium; sanctioned crude discounts unlikely to return
  • Logistics rerouting stability viewed as potentially 9–12 months (management cited uncertain rerouting timeline)
  • Restart timing uncertain and some outages may become permanent, accelerating rationalization (both supportive and risk-bearing depending on duration)
  • Second-order demand risk: discretionary spending destruction remains a possible risk; management stated no evidence currently and watchful stance
  • Unplanned downtime impacts: Bayport PO/TBA outage reduced EBITDA by ~ $40 million in Q1; La Porte acetyls delayed restart after winter storm Fern
  • Technology segment headwind: declining licensing activity and lower catalyst sales volumes due to shipping constraints tied to the war

Q&A: Analyst Interest

  • Topic: PE pricing durability vs consultant forecast erosion. Management argued the shock is multi-quarter, not months, and logistics/physical damage normalize slowly; geopolitical risk premium may persist post-resolution. They cited recent realized increases ($0.30/lb PE in April; additional $0.20/lb in May) and asserted supply-demand imbalance means less downside.
  • Topic: I&D structural changes and Bayport ramp. Management cited broad pricing power across acetyls chain (methanol doubled $300/ton to $600/ton; acid +50%, VAM +100% in ~3 months). Bayport downtime drives Q2 utilization planning (~75%); restart “latest by end of Q2” targeting ~95–100% rates afterward.
  • Topic: Demand destruction mechanics and PE vs PP chain comparison. Management stressed PE demand is mainly packaging/consumables, with consumer behavior historically shifting rather than collapsing (pandemic/2008–09 analogs). They pointed to PP’s broader market impact (~70%+ impacted via Middle East production and LPG-derived feeds), calling PP the “sleeping giant.”

Sentiment: POSITIVE

Note: This summary was synthesized by AI from the LYB Q1 2026 earnings transcript. Financial data is complex; please verify all metrics against official SEC filings before making investment decisions.

Loading financial data and tables...
© 2026 Stock Market Info — LyondellBasell Industries N.V. (LYB) Financial Profile