La-Z-Boy Incorporated

La-Z-Boy Incorporated (LZB) Market Cap

La-Z-Boy Incorporated has a market capitalization of $1.50B.

Price: $36.33

-0.12 (-0.33%)

Market Cap: 1.50B

NYSE · time unavailable

CEO: Melinda D. Whittington

Sector: Consumer Cyclical

Industry: Furnishings, Fixtures & Appliances

IPO Date: 1973-02-21

Website: https://www.la-z-boy.com

La-Z-Boy Incorporated (LZB) - Company Information

Market Cap: 1.50B|Sector: Consumer Cyclical

Company Profile

La-Z-Boy Incorporated manufactures, markets, imports, exports, distributes, and retails upholstery furniture products, accessories, and casegoods furniture products in the United States, Canada, and internationally. It operates through Wholesale, Retail, Corporate and Other segments. The Wholesale segment manufactures and imports upholstered furniture, such as recliners and motion furniture, sofas, loveseats, chairs, sectionals, modulars, ottomans, and sleeper sofas; and imports, distributes, and retails casegoods (wood) furniture, including occasional pieces, bedroom sets, dining room sets, and entertainment centers. This segment sells its products directly to La-Z-Boy Furniture Galleries stores, operators of La-Z-Boy Comfort Studio locations, England Custom Comfort Center locations, dealers, and other independent retailers. The company's Retail segment sells upholstered furniture, casegoods, and other accessories to the end consumer through its retail network. This segment operates a network of 161 company-owned La-Z-Boy Furniture Galleries stores. La-Z-Boy Incorporated also produces reclining chairs; and manufactures and distributes residential furniture. Its Corporate and Other segment sells the products through its website. The company was formerly known as La-Z-Boy Chair Company and changed its name to La-Z-Boy Incorporated in 1996. La-Z-Boy Incorporated was founded in 1927 and is based in Monroe, Michigan.

Analyst Sentiment

72%
Strong Buy

From 3 Active Polls

Consensus Target Matrix

Data feed parsing pending...

Price & Moving Averages

Loading chart...

🎯 Wall Street Analyst Intelligence Report

1-Year structural target targets, chart projections, and sentiment maps.

Average 1Y Target
$38.15
▲ +5.00% Upside
Low Target
$27.25
-25% Risk
Median Target
$37.06
2% Mid
High Target
$45.41
25% Max
Consensus
Buy
5 / 9 Buys

Consensus Trend Projection

Trailing closures vs. 12-month metrics map.

Analyst Vote Distribution

Aggregate institutional coverage sentiment weights.

📊 Historical Valuation Multiples

Real-time Trailing Twelve Month (TTM) momentum side-by-side with discrete quarterly metrics.

Fiscal QuarterTTMQ1 2026Q4 2025Q3 2025Q2 2025Q1 2025Q4 2024Q3 2024Q2 2024
Period EndingTrailing 12MJan 24, 2026Oct 25, 2025Jul 26, 2025Apr 30, 2025Jan 25, 2025Oct 26, 2024Jul 27, 2024Apr 30, 2024
Market Cap ($M)1,4991,5651,3491,5751,6281,8861,6391,8311,396
Enterprise Value ($M)2,2412,3081,5141,7581,7902,0601,8261,9731,536
Price to Earnings Ratio (P/E)17.8418.0811.6921.6327.2516.5913.6417.508.88
Price/Earnings-to-Growth Ratio (PEG)4.941.902.90115.232.650.84
Price to Sales Ratio (P/S)0.702.892.583.202.853.613.153.702.52
Price to Book Ratio (P/B)1.431.501.301.551.591.851.621.831.39
Price to Free Cash Flow Ratio (P/FCF)9.4721.6445.6492.3941.4649.32-1350.1849.9037.46
Enterprise Value to Sales (EV/Sales)4.262.903.573.143.953.503.982.78
Enterprise Value to EBITDA (EV/EBITDA)8.9236.0521.0731.3630.2229.5125.6427.7824.61
Debt to Equity Ratio2.951.010.480.490.480.480.490.480.48

LZB Growth Runway Model

Standard long term linear growth fade

Multi-Stage Discounted Cash Flow Sandbox

Market Price$36.33
Intrinsic Value$45.46
Market Alignment
Undervalued by 25.1%relative to calculated intrinsic value
9.00%
Exp: 6%6%
i

Growth runway slowdown

This value provides a time window for the growth rate to decline beyond Stage 1 toward the terminal rate. Longer windows are most useful for companies with high growth starting conditions or strong competitive advantages. This option stretches out the growth rate slowdown across 5, 10, or 15-year steps. A high-growth starting condition (exceeding a 25% initial growth rate) automatically applies a curve decay to simulate realistic, rapid market saturation.
i

Terminal growth rate

With long-term inflation between 3-5%, revenue must grow by that baseline to maintain flat real-world market share. This value sets the permanent terminal growth rate to factor into the valuation beyond the growth slowdown runway toward maturity.

3-Stage Financial Runway Horizon

🧠 Perpetuity Horizon Engine (Stage 3: Post-2035)

Terminal FCF Base$0.21B
Perpetuity TV Value$3.90B
Discounted TV (PV)$1.65B
TV Weighting %61.4%
⚠️
Financial Model Disclaimer & Risk Disclosure: This interactive scenario simulator is an educational sandbox provided strictly for informational and analytical research purposes. Core historical financial statements and consensus estimates are sourced directly via Financial Modeling Prep (FMP). All downstream outputs are entirely deterministic, hypothetical projections generated by combining automated mathematical formulas (including linear interpolation and Gaussian bell-curve decay models) with user-selected variables and third-party financial data inputs. Users assume all liability for trading decisions executed based on these sandbox calculations.

📘 Full Research Report

ℹ️

AI-Generated Research: This report is for informational purposes only.

📘 LA-Z-BOY INC (LZB) — Investment Overview

🧩 Business Model Overview

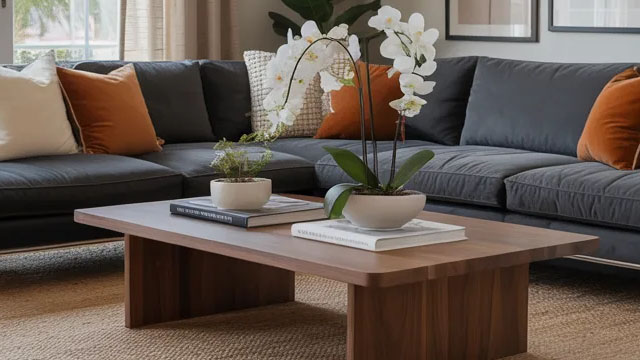
LA-Z-BOY designs and manufactures upholstered home furnishings—centered on seating (including recliners and motion furniture)—and distributes them largely through a dealer network. The value chain is anchored in (1) product engineering and comfort-focused design, (2) manufacturing and sourcing of key components (frames, upholstery, cushioning), and (3) dealer-based selling with showroom and delivery support. Customers typically move through a configuration and selection process (style, upholstery, and features) that supports repeat purchases and service needs, while dealers provide local inventory/build-to-order execution and consumer education.

💰 Revenue Streams & Monetisation Model

Revenue is primarily transactional—furniture is sold to dealers and, in some channels, directly to consumers—while profitability is supported by product mix and operational discipline rather than recurring subscriptions. Margin drivers include:

  • Mix of higher-margin categories and options (motion features, premium upholstery inputs, and configurable styles).
  • Productivity in manufacturing through scale, standardization of components, and efficient production scheduling.
  • Pricing power and promotional discipline aligned with dealer demand and industry inventory levels.
  • Cost management across materials (wood, foam, textiles/leather substitutes), freight, and labor.

The business monetises by converting engineering-led differentiation into sellable SKUs through a distribution model that lowers consumer search costs and concentrates demand capture at the point of purchase.

🧠 Competitive Advantages & Market Positioning

LA-Z-BOY’s moat is most evident in distribution leverage and customer stickiness created by configuration + service expectations, rather than pure brand advertising economics. Key elements:

  • Switching costs (soft, but real): Furniture purchases are high-ticket and preference-driven (size, comfort fit, and layout compatibility). Once a customer is comfortable with a dealer, product line, and comfort profile, repeat purchases and accessory additions become more likely, reducing effective switching versus mass-market quick-turn alternatives.
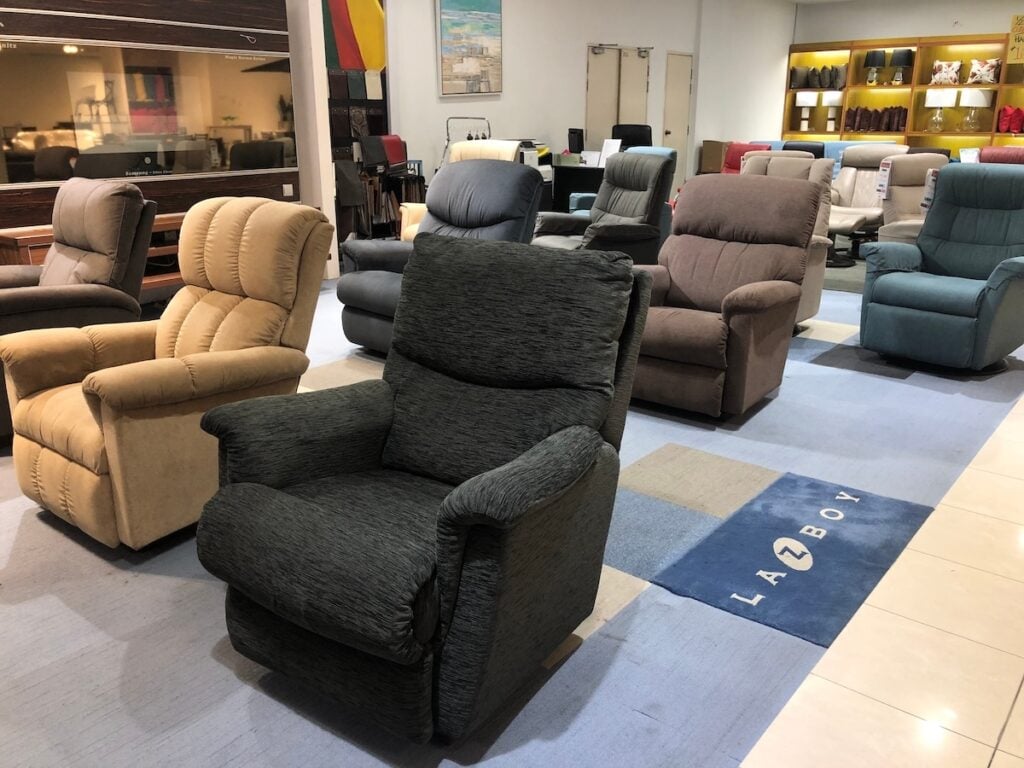
  • Dealer network infrastructure: Local showrooms, delivery coordination, and warranty handling embed LA-Z-BOY into the consumer’s purchasing workflow. Competitors without a similar dealer footprint face higher consumer acquisition costs and lower conversion efficiency.
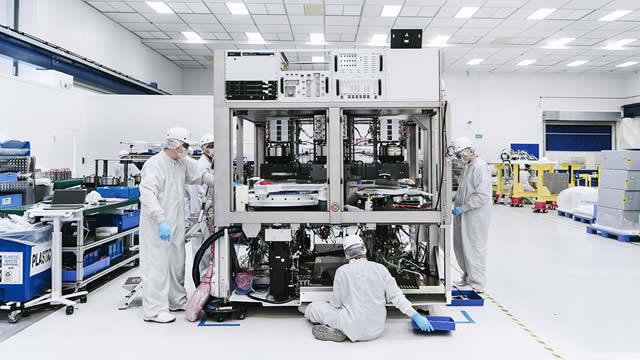
  • Operational and sourcing scale: Broad platform manufacturing supports economies in components, procurement leverage, and process learning across models.

Competitive benchmarking:

  • Herman Miller and other premium office/furnishing-focused peers lean more on design-led office and contract ecosystems; their end-markets and category emphasis differ from LA-Z-BOY’s comfort-driven residential seating focus.
  • Ethan Allen competes in made-to-order home furnishings with a design-services footprint; however, LA-Z-BOY’s core is more concentrated in upholstered seating and motion product depth delivered through a different channel mix.
  • Ashley Furniture represents a mass-market scale competitor emphasizing speed and breadth; LA-Z-BOY competes by targeting comfort specifications and dealer-driven merchandising rather than pure price-led volume.

Overall, LA-Z-BOY’s industry focus is aligned with residential seating comfort and configuration, supported by dealer-enabled distribution leverage and a product assortment that fits household-specific needs.

🚀 Multi-Year Growth Drivers

Growth can be sustained through a combination of category resilience and demographic/home environment tailwinds across a 5–10 year horizon:

  • Housing turnover and remodeling: Furniture replacement cycles rise with household moves, refresh projects, and durability-driven upgrades.
  • Demographic comfort needs: Aging households and higher incidence of mobility-focused product preferences support demand for recliners and supportive seating designs.
  • Mix expansion: Ongoing innovation in motion features, comfort technologies, and premium upholstery inputs can lift average selling prices without requiring a purely volume-based strategy.
  • Channel execution and dealer productivity: Effective merchandising and inventory alignment at the dealer level can improve conversion rates, especially during periods when consumer demand disperses away from purely online alternatives.
  • Manufacturing flexibility: A platform approach to models and components enables responsiveness to shifting consumer preferences, supporting share retention through industry cycles.

⚠ Risk Factors to Monitor

  • Consumer discretionary cyclicality: Furniture demand is sensitive to employment confidence, credit conditions, and housing activity; downside execution in inventory management can pressure margins.
  • Input cost volatility: Wood, foam, and upholstery materials (including leather or leather substitutes), plus freight and labor costs, can compress gross margin if not offset by pricing and mix.
  • Dealer concentration and channel health: Dealer inventory behavior and marketing cadence affect order flow; dealer distress or channel disruption can impair revenue velocity.
  • Warranty and quality exposure: Motion mechanisms and upholstery durability create ongoing quality and warranty considerations that can influence cost structure.
  • Competitive pricing pressure: Mass-market players can intensify promotions, while premium competitors can compete on differentiation; LA-Z-BOY must defend mix and manufacturing efficiency.

📊 Valuation & Market View

The market typically values furniture and home furnishings manufacturers using cash-generation and margin durability frameworks (commonly EV/EBITDA or valuation multiples tied to earnings power). Key valuation drivers include:

  • Gross margin stability through disciplined pricing, product mix, and cost control.
  • Operating leverage from manufacturing efficiency and operating expense discipline.
  • Inventory and working-capital quality, which governs free cash flow resilience through demand cycles.
  • Share retention indicators such as mix improvements and dealer reorder trends.

In this sector, valuation generally expands when the market assigns higher confidence to sustained operating margins and resilient cash conversion across consumer cycles.

🔍 Investment Takeaway

LA-Z-BOY’s long-term investment case rests on distribution leverage through its dealer network, product configuration-driven stickiness, and operational scale that supports cost discipline and mix-driven margin outcomes. While the category remains cyclical, the structural ability to translate comfort-focused engineering into dealer-enabled consumer purchase behavior supports durability—making the business best understood as a cycle-aware operator with defensible channel economics and a differentiated residential seating focus.


⚠ AI-generated — informational only. Validate using filings before investing.

📰 Market News & Coverage

15 Stories Available

Real-time institutional reporting and market updates for LZB.

seekingalpha.com2026-06-05

Dividend Champion, Contender, And Challenger Highlights: Week Of June 7

A weekly summary of dividend activity for Dividend Champions, Contenders, and Challengers. Companies which changed their dividends. Companies with upcoming ex-dividend dates.

prnewswire.com2026-06-02

La-Z-Boy Incorporated Announces Timing of Fiscal 2026 Fourth Quarter and Full Year Earnings Release and Conference Call

MONROE, Mich., June 2, 2026 /PRNewswire/ -- La-Z-Boy Incorporated (NYSE: LZB), a global leader in the retail and manufacture of residential furniture, will report its Fiscal 2026 Fourth Quarter and Full Year results for the period ended April 25, 2026 after the close of trading on the New York Stock Exchange on Tuesday, June 16, 2026, and will hold its quarterly investor conference call at 8:30 a.m.

prnewswire.com2026-06-01

La-Z-Boy Incorporated Completes Sale of American Drew and Kincaid Wholesale Casegoods Businesses

MONROE, Mich., June 1, 2026 /PRNewswire/ -- La-Z-Boy Incorporated (NYSE: LZB), a global leader in the retail and manufacture of residential furniture, completed the sale of its previously announced American Drew and Kincaid wholesale casegoods businesses to Banner House (formerly Magnussen Home Furnishings, Inc.), a multi-branded portfolio of home furniture.

prnewswire.com2026-04-28

La-Z-Boy Incorporated Declares Quarterly Dividend

MONROE, Mich., April 28, 2026 /PRNewswire/ -- La-Z-Boy Incorporated (NYSE: LZB), a global leader in the retail and manufacture of residential furniture, today declared a quarterly cash dividend on the company's common stock of $0.242 per share.

globenewswire.com2026-04-21

La-Z-Boy Incorporated Announces Sale of American Drew and Kincaid Wholesale Casegoods Businesses

Key Highlights: American Drew and Kincaid wholesale casegoods businesses to be sold to Banner House (formerly Magnussen Home Furnishings, Inc.), a multi-branded portfolio of home furniture Transaction is scheduled to close in mid-May La-Z-Boy will continue to offer casegoods products in its 374 stores across North America as part of its whole home solution for consumers Seamless transition expected for existing customers, dealers, and suppliers Transaction advances La-Z-Boy Incorporated progress of focusing on its core, vertically integrated North American upholstery business MONROE, Mich., April 21, 2026 (GLOBE NEWSWIRE) -- La-Z-Boy Incorporated (NYSE: LZB), a global leader in the retail and manufacture of residential furniture, announced the sale of its American Drew and Kincaid wholesale casegoods businesses to Banner House (formerly Magnussen Home Furnishings, Inc.), a multi-branded portfolio of home furniture.

globenewswire.com2026-04-20

La-Z-Boy Incorporated Introduces AudioLuxe, a New Premium Audio Furniture Line with Sound by Klipsch

Key Highlights : New AudioLuxe by La-Z-Boy® premium audio furniture line debuts at High Point Market with select availability this fall The product line combines an integrated audio experience with the comfort and quality for which La-Z-Boy is known Key features, driven by consumer led insights, include Sound by Klipsch, surround sound with audio-visual sync, Auracast™ Bluetooth audio sharing, personalized controls, and La-Z-Boy customizable comfort MONROE, Mich., April 20, 2026 (GLOBE NEWSWIRE) -- La-Z-Boy Incorporated (NYSE: LZB), a global leader in the retail and manufacture of residential furniture, is bringing premium audio to its motion furniture lineup with the debut of AudioLuxe by La-Z-Boy®, a new product line featuring integrated Klipsch sound systems.

businesswire.com2026-04-20

La-Z-Boy Incorporated Introduces AudioLuxe, a New Premium Audio Furniture Line with Sound by Klipsch

MONROE, Mich.--(BUSINESS WIRE)--La-Z-Boy Incorporated (NYSE: LZB), a global leader in the retail and manufacture of residential furniture, is bringing premium audio to its motion furniture lineup with the debut of AudioLuxe by La-Z-Boy®, a new product line featuring integrated Klipsch sound systems. The collection makes its industry debut at the April 2026 High Point Market with select availability this fall and leverages La-Z-Boy's in-house consumer led insights to drive innovation. AudioLuxe.

defenseworld.net2026-04-10

Crown Castle (NYSE:CCI) Stock Unloaded Rep. Josh Gottheimer

Representative Josh Gottheimer (Democratic-New Jersey) recently sold shares of Crown Castle Inc. (NYSE: CCI). In a filing disclosed on April 08th, the Representative disclosed that they had sold between $1,001 and $15,000 in Crown Castle stock on March 24th. The trade occurred in the Representative's "MORGAN STANLEY - SELECT UMA ACCOUNT # 1" account. Representative Josh

defenseworld.net2026-04-10

La-Z-Boy (NYSE:LZB) Stock Unloaded Rep. Josh Gottheimer

Representative Josh Gottheimer (Democratic-New Jersey) recently sold shares of La-Z-Boy Incorporated (NYSE: LZB). In a filing disclosed on April 08th, the Representative disclosed that they had sold between $1,001 and $15,000 in La-Z-Boy stock on March 12th. The trade occurred in the Representative's "MORGAN STANLEY - SELECT UMA ACCOUNT # 1" account. Representative Josh Gottheimer also

defenseworld.net2026-04-10

Rep. Josh Gottheimer Sells Off Shares of ENN Energy Holdings Ltd. (OTCMKTS:XNGSY)

Representative Josh Gottheimer (Democratic-New Jersey) recently sold shares of ENN Energy Holdings Ltd. (OTCMKTS:XNGSY). In a filing disclosed on April 08th, the Representative disclosed that they had sold between $1,001 and $15,000 in ENN Energy stock on March 24th. The trade occurred in the Representative's "MORGAN STANLEY - SELECT UMA ACCOUNT # 1" account. Representative

defenseworld.net2026-04-10

Rep. Josh Gottheimer Sells Infineon Technologies AG (OTCMKTS:IFNNY) Stock

Representative Josh Gottheimer (Democratic-New Jersey) recently sold shares of Infineon Technologies AG (OTCMKTS:IFNNY). In a filing disclosed on April 08th, the Representative disclosed that they had sold between $1,001 and $15,000 in Infineon Technologies stock on March 12th. The trade occurred in the Representative's "MORGAN STANLEY - SELECT UMA ACCOUNT # 1" account. Representative Josh

defenseworld.net2026-04-10

HDFC Bank (NYSE:HDB) Shares Unloaded Rep. Josh Gottheimer

Representative Josh Gottheimer (Democratic-New Jersey) recently sold shares of HDFC Bank Limited (NYSE: HDB). In a filing disclosed on April 08th, the Representative disclosed that they had sold between $1,001 and $15,000 in HDFC Bank stock on March 12th. The trade occurred in the Representative's "MORGAN STANLEY - SELECT UMA ACCOUNT # 1" account. Representative Josh

defenseworld.net2026-04-10

Phreesia (NYSE:PHR) Shares Unloaded Rep. Josh Gottheimer

Representative Josh Gottheimer (Democratic-New Jersey) recently sold shares of Phreesia, Inc. (NYSE: PHR). In a filing disclosed on April 08th, the Representative disclosed that they had sold between $1,001 and $15,000 in Phreesia stock on March 5th. The trade occurred in the Representative's "MORGAN STANLEY - SELECT UMA ACCOUNT # 1" account. Representative Josh Gottheimer also

defenseworld.net2026-04-10

First Watch Restaurant Group (NASDAQ:FWRG) Shares Unloaded Rep. Josh Gottheimer

Representative Josh Gottheimer (Democratic-New Jersey) recently sold shares of First Watch Restaurant Group, Inc. (NASDAQ: FWRG). In a filing disclosed on April 08th, the Representative disclosed that they had sold between $1,001 and $15,000 in First Watch Restaurant Group stock on March 5th. The trade occurred in the Representative's "MORGAN STANLEY - SELECT UMA ACCOUNT #

defenseworld.net2026-04-10

Rep. Josh Gottheimer Sells CBIZ, Inc. (NYSE:CBZ) Shares

Representative Josh Gottheimer (Democratic-New Jersey) recently sold shares of CBIZ, Inc. (NYSE: CBZ). In a filing disclosed on April 08th, the Representative disclosed that they had sold between $1,001 and $15,000 in CBIZ stock on March 5th. The trade occurred in the Representative's "MORGAN STANLEY - SELECT UMA ACCOUNT # 1" account. Representative Josh Gottheimer also

📊 AI Financial Analysis

Powered by StockMarketInfo
Earnings Data: Q Ending 2026-01-24

"LZB reported revenue of $541.59M and a net income of $21.65M for the most recent quarter ending January 2026. The company generated $90.15M in operating cash flow, leading to a free cash flow of $72.34M after accounting for capital expenditures. With total assets of $2.09B against total liabilities of $1.03B, LZB maintains a solid equity position of $1.06B. Despite these positive metrics, LZB has struggled in market performance, reflecting an annual price change of -18.84%. Dividends have been paid consistently, totaling approximately $0.96 per share over the last year, although this does not significantly boost shareholder returns due to the decline in stock price. Overall, LZB exhibits strong operational cash flow and a healthy balance sheet but faces challenges in market sentiment and growth prospects."

Revenue Growth

Neutral

Revenue of $541.59M indicates stable growth potential, but specifics on year-over-year growth are not provided.

Profitability

Neutral

Profit margin is reasonable with a net income of $21.65M; however, continued profitability will depend on managing costs in a challenging market.

Cash Flow Quality

Good

Strong operating cash flow at $90.15M supports operational sustainability; positive free cash flow is a positive indicator.

Leverage & Balance Sheet

Positive

Healthy balance sheet with total equity of $1.06B and manageable debt levels, although net debt is present.

Shareholder Returns

Caution

Negative stock price performance and modest dividends lead to lower shareholder return prospects despite some consistent dividends.

Analyst Sentiment & Valuation

Fair

Market performance shows negative sentiment; unclear valuation context could pose risks for investor confidence.

Disclaimer:This analysis is AI-generated for informational purposes only. Accuracy is not guaranteed and this does not constitute financial advice.

Fundamentals Overview

Loading fundamentals overview...

Management sounded broadly constructive—highlighting strong delivered sales (+4% YoY), high-end margin delivery (GAAP 5.5%, adjusted 6.1%), and strong operating cash flow ($89M, +57% YoY). They also reiterated clear margin levers from transformation: 50–75 bps Wholesale improvement and up to ~50 bps enterprise benefit, plus 75–100 bps annualized operating margin improvement tied to strategic portfolio actions (with $30M net sales decrease). However, the Q&A exposed the near-term reality behind the optimism: Q4 conservatism was explicitly driven by adverse weather timing into deliveries and ongoing traffic challenges causing fixed-cost deleveraging. Joybird remains the clearest operational hurdle—down double digits in written sales (-13%), with a worse operating loss from fixed-cost deleverage and management calling it “tough” and “volatile.” Analyst pressure focused on the margin “base year” and whether savings flow through without offsetting investments—management said the 75–100 bps was based on trailing-12-months at Q2 and intended to flow through “all else being equal,” but did not deny ongoing near-term headwinds.

AI IconGrowth Catalysts

  • Retail expansion: opened 4 new company-owned stores in the quarter; 16 new company-owned stores in the last 12 months (4 closed), adding 29 net stores
  • Integrated largest acquisition: completed integration of 15-store Southeast acquisition
  • Western U.S. phase completion of distribution and home delivery transformation project (new Arizona centralized hub)
  • In-store execution offsetting weak traffic: higher conversion rates, average ticket, and design sales

Business Development

  • Wholesale strategic compatible distribution growth with Slumberland and Rooms To Go (both cited as key partners)
  • Additional strategic partner wins cited: Farmers (Southeast) and Living Spaces (West)
  • U.K. sourcing transition progressing with DFS (new/better-fit customer vs legacy FCS); management cited DFS as continuing to add introductions and calling LZB 'fastest-growing' among DFS introductions
  • Casegoods portfolio exit/liquidity actions: sale of Kincaid upholstery completed; letter of intent to sell noncore wholesale casegoods American Drew and Kincaid

AI IconFinancial Highlights

  • Total delivered sales: $542M (+4% YoY)
  • Retail delivered sales: $252M (+11% YoY); Retail written sales +11% YoY; written same-store sales -4% YoY
  • Wholesale delivered sales: $367M (+1% YoY)
  • GAAP operating margin: 5.5%; adjusted operating margin: 6.1% (toward high end of guidance range)
  • GAAP EPS: $0.52; adjusted diluted EPS: $0.61
  • Consolidated adjusted gross margin: +10 bps YoY (mix shift toward Retail partially offset by transformation investments)
  • Adjusted SG&A as % of sales: +80 bps YoY (mix shift to Retail + fixed cost deleverage on lower delivered same-store sales)
  • Tax rate (GAAP): 31.3% vs 25.1% in Q3 FY25; increase due to nondeductible operating losses and one-time charges related to U.K. supply chain optimization actions; management expects normalization in FY27
  • Cash flow: operating cash flow $89M (+57% YoY); liquidity $306M cash; no externally funded debt

AI IconCapital Funding

  • Shareholder returns: $55M YTD dividends and share repurchases ($28M dividends, $27M share repurchases)
  • Quarterly buybacks resumed/normalized: $14M in the quarter; 3M shares remaining under existing authorization
  • Capex: $18M in the quarter; FY26 capex guidance $80M-$90M
  • 15-store acquisition purchase consideration: $86M (completed at beginning of the quarter)

AI IconStrategy & Ops

  • Distribution/home delivery transformation: completed Western U.S. 1/3 served by new Arizona centralized hub; broke ground on new Dayton, Tennessee centralized hub for Eastern region
  • Expected transformation impact: 50-75 bps Wholesale margin improvement in aggregate; up to 50 bps benefit to entire enterprise once completed
  • U.K. actions: planned closure of U.K. manufacturing facility; production cease by end of FY26
  • Portfolio optimization: completed sale of Kincaid upholstery just after Q3 end; signed LOI to sell American Drew and Kincaid, substantially complete by FY-end (April)
  • Strategic initiatives annualized impact guidance (enterprise): $30M net sales decrease and 75-100 bps adjusted operating margin improvement; management indicated savings based on trailing 12 months enterprise results at Q2 point
  • Store network: 374 total stores; company-owned proportion at 60% (all-time high); target to grow to 400+ stores

AI IconMarket Outlook

  • FY26 Q4 guidance: sales $560M-$580M; adjusted operating margin 7.5%-9.0%
  • Q4 store openings: 5 new company-owned stores (16 for full FY)
  • FY26 tax rate guidance: 27%-29%
  • FY26 fourth quarter conservatism: short-term impact from recent adverse weather; consumer reengagement expected but timing pressures into Q4
  • Benefit timing: strategic initiatives benefit expected when substantially completed by end of fiscal year; management expects $30M net sales decrease plus 75-100 bps margin improvement (annualized) but said directionally it should flow through with 'intent' that it flows to bottom line 'all else being equal'

AI IconRisks & Headwinds

  • Choppy consumer and traffic pressure: management stated traffic remains challenged, creating fixed-cost deleveraging impacts
  • Weather timing impact: adverse weather in late January continuing into early February slowed traffic; management expects some timing effects carrying into Q4 deliveries
  • Joybird volatility: Joybird written sales -13% YoY; delivered sales $36M (-3%); Joybird operating loss increased due to fixed cost deleverage on lower delivered volume; management called Joybird 'tough' and said it is particularly volatile with a younger, urban-focused consumer disproportionately impacted by macroeconomic challenges
  • U.K. transition-related tax/charges: GAAP tax rate increased to 31.3% due to nondeductible operating losses and one-time charges tied to U.K. supply chain optimization actions
  • FX headwind in Wholesale: Wholesale adjusted operating margin 6.0% vs 6.5% prior year, driven primarily by transformation investments and unfavorable foreign exchange rates
  • Margin guidance nuance: Q4 adjusted operating margin of 7.5%-9% described by analyst as down ~100+ bps despite higher Retail mix; management attributed near-term pressure largely to traffic deleveraging and transformation redesign

Sentiment: MIXED

Note: This summary was synthesized by AI from the LZB Q3 2026 earnings transcript. Financial data is complex; please verify all metrics against official SEC filings before making investment decisions.

📋 Official Regulatory 10-K / 10-Q SEC Filings

Direct authenticated documentation links to audited SEC database reports for LZB.

SEC EDGAR Live Feed
Loading financial data and tables...
📁

SEC Filings (LZB)

© 2026 Stock Market Info — La-Z-Boy Incorporated (LZB) Financial Profile