Mama's Creations, Inc.

Mama's Creations, Inc. (MAMA) Market Cap

Mama's Creations, Inc. has a market capitalization of $754.6M.

Price: $18.43

0.18 (0.99%)

Market Cap: 754.56M

NASDAQ · time unavailable

CEO: Adam L. Michaels

Sector: Consumer Defensive

Industry: Packaged Foods

IPO Date: 2021-07-19

Website: https://www.mamascreations.com

Mama's Creations, Inc. (MAMA) - Company Information

Market Cap: 754.56M|Sector: Consumer Defensive

Company Profile

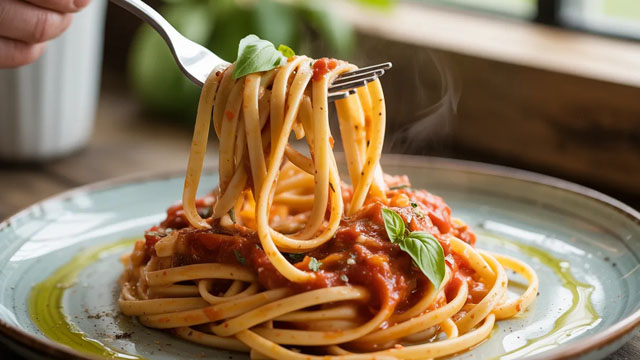
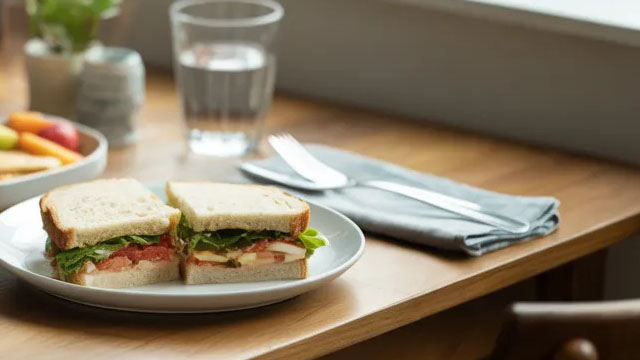
Based in East Rutherford, New Jersey, Mama's Creations, Inc., established in 2010, specializes in the production and distribution of various chilled, ready-to-eat food items throughout the United States. Their extensive product line includes an array of prepared meals such as beef and turkey meatballs, meatloaf, chicken dishes, an assortment of sausage products, and pasta entrees. Additionally, the company supplies offerings for hot and salad bars, prepared food counters, sandwich stations, and cold deli/grab-and-go sections. These products are distributed through diverse channels, including direct sales to major grocery chains, club stores, and large-scale retailers, alongside sales to food distributors and other retail outlets, as well as directly to consumers via its official website. The company officially rebranded to Mama's Creations, Inc. in August 2023, having previously operated as MamaMancini's Holdings, Inc.

Analyst Sentiment

85%
Strong Buy

From 8 Active Polls

1Y Forecast: $23.00

▲ +24.8% Potential Upside

Consensus Target Metrics

Low Bound

$21

Median

$23

High Bound

$25

Average

$23

Price & Moving Averages

Loading chart...

🎯 Wall Street Analyst Intelligence Report

1-Year structural target targets, chart projections, and sentiment maps.

Average 1Y Target
$23.00
▲ +24.80% Upside
Low Target
$21.00
14% Risk
Median Target
$23.00
25% Mid
High Target
$25.00
36% Max
Consensus
Buy
7 / 7 Buys

Consensus Trend Projection

Trailing closures vs. 12-month metrics map.

Analyst Vote Distribution

Aggregate institutional coverage sentiment weights.

📊 Historical Valuation Multiples

Real-time Trailing Twelve Month (TTM) momentum side-by-side with discrete quarterly metrics.

Fiscal QuarterTTMQ2 2026Q1 2026Q4 2025Q3 2025Q2 2025Q1 2025Q4 2024Q3 2024
Period EndingTrailing 12MApr 30, 2026Jan 31, 2026Oct 31, 2025Jul 31, 2025Apr 30, 2025Jan 31, 2025Oct 31, 2024Jul 31, 2024
Market Cap ($M)755577587420311248290280285
Enterprise Value ($M)744566582424312249293281288
Price to Earnings Ratio (P/E)118.9870.1166.46194.6760.9150.1548.13170.8762.05
Price/Earnings-to-Growth Ratio (PEG)4.685.6810.097.3615.44
Price to Sales Ratio (P/S)3.9910.9410.888.888.847.048.628.8710.02
Price to Book Ratio (P/B)13.5410.4211.168.4610.529.3911.6312.1512.76
Price to Free Cash Flow Ratio (P/FCF)82.61119.40208.75114.29-142.4745.40-311.34111.02-71.07
Enterprise Value to Sales (EV/Sales)10.7310.788.978.887.068.718.9210.15
Enterprise Value to EBITDA (EV/EBITDA)53.12120.62156.02163.60104.6788.10151.64264.60114.60
Debt to Equity Ratio-0.770.250.270.460.360.480.410.480.49

📘 Full Research Report

ℹ️

AI-Generated Research: This report is for informational purposes only.

📘 MAMAS CREATIONS INC (MAMA) — Investment Overview

🧩 Business Model Overview

MAMAS CREATIONS INC operates as a consumer-brand business that monetizes product demand through a direct-to-consumer and/or online retail value chain. The company’s core “how it works” is: (1) source or manufacture products aligned to its target customer segment, (2) market and distribute those products through owned and third-party digital channels, and (3) convert customer traffic into repeat purchasing through new assortments and ongoing customer engagement. Because consumer purchases are discretionary, the company’s long-term durability depends less on contractual lock-in and more on retention drivers (product cadence, customer experience, and merchandising effectiveness) that reduce churn and support lifetime value.

💰 Revenue Streams & Monetisation Model

Revenue primarily comes from transactional product sales. Monetisation quality is determined by the interaction of:
  • Gross margin profile: product cost structure (materials, unit economics, and freight/fulfillment) versus average selling price.
  • Operating leverage: scalability of marketing, design/merchandising, and overhead as order volume increases.
  • Repeat purchasing: incremental contribution from repeat buyers and higher mix (newness/collections) that can improve blended margins.
If the business offers any structured repeat mechanism (e.g., curated drops or recurring engagement purchases), that would create a more favorable recurring-like revenue component. In most consumer models of this type, however, the dominant driver remains transactional sales with retention-based upside.

🧠 Competitive Advantages & Market Positioning

A defensible position for a consumer brand is typically built on intangible assets and execution, with partial support from distribution scale:
  • Intangible assets (design and assortment fit): proprietary product design know-how, category specialization, and an assortment that matches a specific customer need.
  • Customer relationship asset: first-party audience building (email/SMS and site data) that improves conversion efficiency over time.
  • Distribution and merchandising leverage: the ability to translate product development into sell-through through owned channels and marketplace partners.
Competitive benchmarking (selected peers):
  • Hatch Collection — positioned in a defined lifestyle apparel category with strong product focus.
  • Kindred Bravely — known for assortment depth and category specialization.
  • Storq — competes on product range and retail/digital channel execution.
Compared with these peers, MAMAS CREATIONS INC’s industry focus centers on building demand for its own product assortment rather than competing as a mass retailer. The practical implication is that MAMA’s share gains typically come from merchandising execution and customer engagement, while its competitive weakness is susceptibility to rapid fashion/assortment imitation—making consistent product differentiation and marketing efficiency critical.

🚀 Multi-Year Growth Drivers

Over a 5–10 year horizon, growth is most plausibly driven by:
  • Direct channel penetration: ongoing shift toward online discovery and purchase, which increases the value of first-party customer data.
  • Category expansion through assortment cadence: adding adjacent products and maintaining a repeat-purchase engine via collections/drops.
  • Improving unit economics: scale-driven reductions in fulfillment cost per unit and improved conversion through tighter merchandising and targeting.
  • Higher share of wallet: moving customers from one-time purchases to repeat purchases through improved fit, quality consistency, and product relevance.
In this sector, TAM expansion matters, but the durable compounding mechanism is whether the company can convert a larger portion of demand into repeat buying while maintaining gross margin and controlling marketing cost per order.

⚠ Risk Factors to Monitor

  • Inventory and working-capital risk: consumer product models can face markdown pressure when product-market fit weakens.
  • Marketing efficiency volatility: profitability depends on sustained conversion and reasonable CAC/LTV dynamics.
  • Product trend and assortment execution risk: competitive imitation and changing customer preferences can compress margins.
  • Channel concentration: dependence on major platforms or marketplaces can increase fee exposure and reduce control over customer relationship economics.
  • Supply chain and fulfillment variability: freight, sourcing reliability, and delivery performance directly affect cost and repeat intent.

📊 Valuation & Market View

Consumer brand equity markets typically value companies using price-to-sales (P/S) and EV/EBITDA frameworks, with the key differentiators being:
  • Trajectory of gross margin (improving mix and cost control).
  • Evidence of operating leverage (fixed-cost absorption as revenue scales).
  • Retention signals (repeat purchasing and stable engagement outcomes).
  • Balance-sheet resilience (inventory levels and cash conversion).
Because switching costs are usually low in consumer categories, valuation tends to become more sensitive to the durability of demand and margin structure rather than to contractual revenue.

🔍 Investment Takeaway

MAMAS CREATIONS INC is best analyzed as a consumer brand where sustainable value creation hinges on merchandising-driven customer retention and operating leverage. The moat is not typically contractual; it is primarily built through intangible assets (assortment fit and product development), first-party customer relationship accumulation, and execution that improves conversion and repeat purchase rates. Upside emerges if the company demonstrates consistent sell-through, resilient gross margins, and controllable acquisition costs while expanding assortment and channel reach.

⚠ AI-generated — informational only. Validate using filings before investing.
📰 Market News & Coverage

15 Stories Available

Real-time institutional reporting and market updates for MAMA.

marketwatch.com2026-07-27

This small-cap stock strategy shines by riding the beat-and-raise trend

Brandon Nelson of Calamos Investments identifies companies primed for sustainable growth and improving profit margins.

zacks.com2026-07-21

Can New Products Drive Mama's Creations' Next Growth Wave?

MAMA is betting on new products, packaging and protein formats to expand retail reach as launch costs pressure margins.

zacks.com2026-07-15

Is Mama's Creations, Inc. (MAMA) Outperforming Other Consumer Staples Stocks This Year?

Here is how Mama's Creations, Inc. (MAMA) and WD-40 (WDFC) have performed compared to their sector so far this year.

zacks.com2026-07-15

Zacks Industry Outlook Mondelez, Sysco, United Natural Foods and Mama's

Mondelez, Sysco, United Natural Foods and Mama's have been highlighted in this Industry Outlook article.

zacks.com2026-07-14

4 Miscellaneous Food Stocks to Keep an Eye on Amid Industry Headwinds

MDLZ, SYY, UNFI and MAMA navigate industry headwinds through innovation, operational efficiencies and evolving consumer trends.

zacks.com2026-07-14

Bet on Winning DuPont Analysis & Pick 4 Top Stocks

Do you have more faith in DuPont analysis than in simple ROE calculation? Tap MAMA, EXPD, GWW and ECG.

zacks.com2026-07-08

Mama's Creations, Inc. (MAMA) Up 36.1% Since Last Earnings Report: Can It Continue?

Mama's Creations, Inc. (MAMA) reported earnings 30 days ago. What's next for the stock?

seekingalpha.com2026-07-02

Mama's Creations, Inc. (MAMA) Shareholder/Analyst Call Prepared Remarks Transcript

Mama's Creations, Inc. (MAMA) Shareholder/Analyst Call Prepared Remarks Transcript

zacks.com2026-07-02

3 Reasons Why Growth Investors Shouldn't Overlook Mama's Creations, Inc. (MAMA)

Mama's Creations, Inc. (MAMA) is well positioned to outperform the market, as it exhibits above-average growth in financials.

globenewswire.com2026-06-29

Mama’s Creations Announces Pricing of $100 Million Public Offering of Common Stock

EAST RUTHERFORD, New Jersey, June 29, 2026 (GLOBE NEWSWIRE) -- Mama's Creations, Inc. (Nasdaq: MAMA) ("Mama's Creations" or the "Company"), a leading national marketer and manufacturer of fresh deli prepared foods, today announced the pricing of its registered underwritten public offering of 5,555,556 shares of its common stock, par value $0.

globenewswire.com2026-06-29

Mama's Creations Announces Pricing of $100 Million Public Offering of Common Stock

EAST RUTHERFORD, New Jersey, June 29, 2026 (GLOBE NEWSWIRE) -- Mama's Creations, Inc. (Nasdaq: MAMA) (“Mama's Creations” or the “Company”), a leading national marketer and manufacturer of fresh deli prepared foods, today announced the pricing of its registered underwritten public offering of 5,555,556 shares of its common stock, par value $0.00001 per share (“Common Stock”) at a public offering price of $18.00 per share, resulting in gross proceeds to the Company of approximately $100 million, before deducting the underwriters' discount and commissions and estimated offering fees and expenses. In addition, Mama's Creations has granted the underwriters a 30-day option to purchase up to an additional 833,333 shares of Common Stock at the public offering price, less underwriting discounts and commissions. If the underwriters exercise their option in full, the expected gross proceeds of the offering, before deducting the underwriters' discount and commissions and estimated offering fees and expenses, would be approximately $115 million. The offering is expected to close on July 1, 2026, subject to customary closing conditions.

globenewswire.com2026-06-29

Mama’s Creations. Announces Proposed Public Offering of Common Stock

EAST RUTHERFORD, New Jersey, June 29, 2026 (GLOBE NEWSWIRE) -- Mama's Creations, Inc. ("Mama's Creations" or the "Company") (NASDAQ: MAMA), a leading national marketer and manufacturer of fresh deli prepared foods, today announced the commencement of a proposed, underwritten public offering of shares of its common stock, par value $0.

globenewswire.com2026-06-29

Mama's Creations. Announces Proposed Public Offering of Common Stock

EAST RUTHERFORD, New Jersey, June 29, 2026 (GLOBE NEWSWIRE) -- Mama's Creations, Inc. (“Mama's Creations” or the “Company”) (NASDAQ: MAMA), a leading national marketer and manufacturer of fresh deli prepared foods, today announced the commencement of a proposed, underwritten public offering of shares of its common stock, par value $0.00001 per share (“Common Stock”). All shares as a part of the proposed offering are being offered by the Company. In addition, the Company intends to grant the underwriters a 30-day option to purchase up to an additional 15% of the shares of Common Stock offered in the public offering at the public offering price, less the underwriting discounts and commissions. The proposed offering is subject to market and other conditions, and there can be no assurances as to whether or when the proposed offering may be completed, or as to the actual size or terms of the proposed offering.

zacks.com2026-06-29

Bet on Winning DuPont Analysis & Pick 5 Top Stocks

Do you have more faith in DuPont analysis than in simple ROE calculation? Tap CASY, ECG, GRDN, EXPD and MAMA for gains.

zacks.com2026-06-25

MAMA Is Riding the Fresh Deli Convenience Food Boom

MAMA is expanding its refrigerated prepared-foods platform as retailers invest in fresh deli offerings, but margin and shelf-space pressures keep the outlook balanced.

📊 AI Financial Analysis

Powered by StockMarketInfo
Earnings Data: Q Ending 2026-04-30

"MAMA reported Q1’2027 (ended 2026-04-30) revenue of $52.77M and net income of $2.06M (EPS $0.05). On a YoY basis, revenue grew +49.7% versus Q1’2026 ($35.26M), while net income increased +66.3% versus $1.24M. QoQ, revenue declined -2.3% from $53.99M in Q4’2026, but net income improved +7.8% from $2.02M. Profitability strengthened versus the prior year: net margin improved to 3.9% from 3.5% YoY, and gross margin edged down slightly QoQ (23.6% vs 25.8%). Over the last four quarters, operating performance has normalized after a weak Q3’2026, with operating income rising materially from Q3’s $0.82M to $2.66M in the latest quarter. Interest remains a modest drag/benefit versus operations, with taxes reflecting a negative effective tax rate in the latest quarter. Cash flow quality looks solid for the quarter: operating cash flow was $5.01M and free cash flow was $4.83M. The balance sheet remains resilient with total assets of $87.5M and equity of $55.4M; net debt is negative (net cash) at about -$16.9M. Shareholder returns appear strong based on price momentum: the stock is up +132.8% over 1 year (capital appreciation), with no dividends reported."

Revenue Growth

Strong

YoY revenue growth was +49.7% ($52.77M vs $35.26M). QoQ revenue slipped -2.3% ($52.77M vs $53.99M), but the multi-quarter trajectory remains upward versus the prior year.

Profitability

Good

Net margin improved to 3.9% from 3.5% YoY, and net income rose +66.3% YoY. QoQ net income increased +7.8%, though gross margin contracted QoQ (23.6% vs 25.8%), suggesting a mild cost headwind.

Cash Flow Quality

Good

Operating cash flow of $5.01M and free cash flow of $4.83M in the latest quarter indicate good conversion. No dividends are paid and no buybacks are shown, but cash generation is currently positive.

Leverage & Balance Sheet

Good

Total assets increased to $87.5M from $85.7M QoQ, and equity rose to $55.4M (from $52.6M). Net debt is negative (net cash ~-$16.9M), improving financial resilience.

Shareholder Returns

Strong

Total return is strongly supported by capital appreciation: 1Y price change is +132.8%. Dividend yield is 0% and there are no disclosed buybacks, but momentum materially boosts the return score.

Analyst Sentiment & Valuation

Fair

Price ($14.69) is below consensus target ($19.17), implying upside. However, valuation metrics in the latest quarter show elevated earnings multiple (P/E ~70x), which limits the score despite positive upside to targets.

Disclaimer:This analysis is AI-generated for informational purposes only. Accuracy is not guaranteed and this does not constitute financial advice.

Fundamentals Overview

Loading fundamentals overview...

MAMA delivered strong top-line and profitability growth in Q1 2027 despite meaningful launch-related margin pressure. Revenue rose 49.7% to $52.8M and adjusted EBITDA climbed 71.2% to $4.9M, with net income up 66.3% to $2.1M. The key offset was gross margin: down to 23.6% from 26.1% (~-250 bps), largely tied to labor/raw material inefficiencies and start-up costs from new packaging, protein form factors, and technology adoption as over 12 items rolled out to major retailers. Importantly, management framed this as timing: shelf launches occurred mid-to-late April, so Q1 captured most costs while revenue contribution is expected to ramp through the rest of FY27. Operating leverage remains intact: operating expense ratio improved by ~-310 bps to 18.5%. Bayshore integration is largely complete (ERP conversion done, “no major hurdle left”), and management highlighted continued retail media momentum (notably Walmart and Instacart ROAS) plus expanding Costco everyday status as evidence of structural—not purely promotional—velocity gains.

AI IconGrowth Catalysts

  • Over 12 new branded item launches with major retailers in Q1 (record for the company), with costs recognized in Q1 while revenue is weighted later due to late-April shelf timing
  • Cost and production optimization from Bayshore integration: centralized sourcing/logistics, reflowed footprint to improve utilization and reduce overtime, and earlier absorption in the system
  • Cost-to-serve and execution improvements visible in retail media programs driving trial and repeat (platform sales >$1M on Instacart; Walmart branded attributed sales nearly tripled YoY; ROAS expanded to $29.50)
  • Cost-plus-quality execution enabling Costco everyday rotation status expansion: San Diego added “beef meatballs” as an everyday item (second region confirmed)

Business Development

  • Major retailers for new item placements: Walmart, Target, Food Lion (over 12 new items launched in Q1; chicken form factors/packaging iterations discussed)
  • Albertsons divisions: new launches across 3 divisions including 2 Panini items at Albertsons/Albertsons banner (called out as “Weiss” in transcript), and 2 non-protein items at Fresh Market
  • Instacart growth: sponsored sales generated 45% from new customers (reinforces partner-led acquisition via platform ads)
  • Costco partnership: digital MVM lapped; San Diego region now offers rotation back as an everyday item for “beef meatballs”

AI IconFinancial Highlights

  • Revenue +49.7% YoY to $52.8M
  • Net income +66.3% YoY to $2.1M, or $0.05 diluted EPS
  • Adjusted EBITDA +71.2% YoY to $4.9M
  • Gross margin declined to 23.6% from 26.1% YoY (~-250 bps), attributed to labor/raw material inefficiencies plus start-up costs for new packaging/protein form factors and Bayshore integration impacts
  • Operating expenses as % of revenue declined to 18.5% from 21.6% YoY (~-310 bps), reflecting operating leverage and intentional shifting of marketing spend into gross-to-net trade
  • Cash and cash equivalents $24.4M at April 30, 2026 (vs $20.0M at Jan 31, 2026); total debt $5.1M at April 30, 2026

AI IconCapital Funding

  • No explicit buyback authorization/amounts disclosed in transcript
  • Debt level disclosed: total debt $5.1M as of April 30, 2026
  • Cash runway: $24.4M cash and equivalents; management cited “credit facilities and strong cash flow generation” enabling selective M&A

AI IconStrategy & Ops

  • Bayshore integration: sourcing/logistics centralized under a single desk across all 3 plants; Bayshore transitioned fully to corporate ERP system
  • ERP integration across all 3 facilities completed: faster month-end close, sharper inventory accuracy, granular SKU/line cost visibility, and stronger analytical foundation
  • WMS improvements: labor efficiency, stock location, and inventory accuracy enhancements
  • First-ever TMS implemented: transportation planning efficiency, route/stop optimization, improved OTIP/service visibility, and carrier compliance
  • Rutherford expansion moved in with installation of additional blast freezer and refrigerated storage (to improve run efficiency, reduce overtime, and improve customer service)
  • Marketing-to-trade reallocation described: management moved roughly ~$0.5M from marketing into trade to support Target and Food Lion launch promotions; helped support new customer launches while improving operating expense ratio

AI IconMarket Outlook

  • Management expectation: new item placements are expected to ramp meaningfully through the balance of fiscal 2027
  • ROAS/media momentum expected to continue through back half of FY27 (activation calendar running through H2)
  • Target category strategy executed: add net-plus-2 SKUs to each of top 10 accounts (reinforced as an ongoing FY27 goal)
  • No explicit numeric revenue/EPS guidance for Q2 or FY27 disclosed in the provided transcript

AI IconRisks & Headwinds

  • Near-term gross margin pressure from launch start-up costs and inefficiencies tied to new packaging/protein form factors and technology adoption (labor and raw material inefficiency)
  • Execution risk inherent in new production lines (learning curve around HPP/packaging, vacuum-sealed formats, and form-factor iterations), though management indicated they are already improving and claim to be ahead on runs
  • Cost/revenue timing mismatch: shelf launches occurred mid-to-late April, resulting in Q1 costs but limited Q1 revenue contribution, creating volatility in sequential results
  • Ongoing need to convert launches into steady-state production to reach mid- to high-20% corporate gross margin target

Q&A: Analyst Interest

  • Sequential revenue timing: Topic: Analysts asked whether Q2 revenues should increase sequentially given new items launched late in April and costs were incurred in Q1. Management responded that Q1 carried costs with revenue largely delayed into Q2, citing “double hit,” and indicated early in-store improvements and accelerating velocities should help.
  • Gross margin and ramp duration: Topic: Analysts requested clarification and—if possible—quantification of the start-up inefficiencies behind the gross margin decline, and how long the low-margin ramp lasts before steady state. Management attributed issues to labor/raw material inefficiency plus learning new packaging/technologies (including HPP) and provided a range and partial marketing-to-trade shift.
  • Bayshore integration status: Topic: Analysts asked what remains after ERP conversion and whether anything could affect future leverage/gross margin, and how freed capacity impacts priorities like M&A. Management said the last major Bayshore hurdle was completed ahead of schedule, with nothing major left, improving management confidence and travel flexibility.

Sentiment: POSITIVE

Note: This summary was synthesized by AI from the MAMA Q1 2027 earnings transcript. Financial data is complex; please verify all metrics against official SEC filings before making investment decisions.

📋 Official Regulatory 10-K / 10-Q SEC Filings

Direct authenticated documentation links to audited SEC database reports for MAMA.

SEC EDGAR Live Feed
Loading financial data and tables...
📁

SEC Filings (MAMA)

© 2026 Stock Market Info — Mama's Creations, Inc. (MAMA) Financial Profile