Mativ Holdings, Inc.

Mativ Holdings, Inc. (MATV) Market Cap

Mativ Holdings, Inc. has a market capitalization of $410.1M.

Price: $7.44

-0.24 (-3.13%)

Market Cap: 410.07M

NYSE · time unavailable

CEO: Shruti Singhal

Sector: Basic Materials

Industry: Paper, Lumber & Forest Products

IPO Date: 1995-11-09

Website: https://www.mativ.com

Mativ Holdings, Inc. (MATV) - Company Information

Market Cap: 410.07M|Sector: Basic Materials

Company Profile

Mativ Holdings, Inc. operates as a performance materials company. The company operates through two segments, Advanced Materials & Structures (AMS), and Engineered Papers (EP). The AMS segment manufactures resin-based rolled goods, such as nets, films and meltblown materials, bonding products, and adhesive components, as well as adhesives and other coating solutions, and converting services. It serves healthcare, construction, industrial, transportation, and filtration end-markets. The EP segment produces various cigarette papers and reconstituted tobacco products for the tobacco industry. It also produces non-tobacco papers for various applications, such as energy storage and industrial commodity paper grades. The company sells its products in the United States, Europe and the former Commonwealth of Independent States, the Asia Pacific, the Americas, and internationally. The company was formerly known as Schweitzer-Mauduit International, Inc. and changed its name to Mativ Holdings, Inc. in July 2022. Mativ Holdings, Inc. was incorporated in 1995 and is headquartered in Alpharetta, Georgia.

Analyst Sentiment

50%
Hold

From 0 Active Polls

Consensus Target Matrix

Data feed parsing pending...

Price & Moving Averages

Loading chart...

🎯 Wall Street Analyst Intelligence Report

1-Year structural target targets, chart projections, and sentiment maps.

Average 1Y Target
$7.81
▲ +5.00% Upside
Low Target
$5.58
-25% Risk
Median Target
$7.59
2% Mid
High Target
$9.30
25% Max
Consensus
Buy
5 / 7 Buys

Consensus Trend Projection

Trailing closures vs. 12-month metrics map.

Analyst Vote Distribution

Aggregate institutional coverage sentiment weights.

📊 Historical Valuation Multiples

Real-time Trailing Twelve Month (TTM) momentum side-by-side with discrete quarterly metrics.

Fiscal QuarterTTMQ1 2026Q4 2025Q3 2025Q2 2025Q1 2025Q4 2024Q3 2024Q2 2024
Period EndingTrailing 12MMar 31, 2026Dec 31, 2025Sep 30, 2025Jun 30, 2025Mar 31, 2025Dec 31, 2024Sep 30, 2024Jun 30, 2024
Market Cap ($M)410477664618373339592923869
Enterprise Value ($M)1,4141,4811,7031,6121,4381,4421,6511,9671,935
Price to Earnings Ratio (P/E)5.34-10.191.65-48.31-9.80-0.2098.71-11.09-155.11
Price/Earnings-to-Growth Ratio (PEG)-2.86-1.17-0.03-32.88
Price to Sales Ratio (P/S)0.210.991.431.200.710.701.291.851.66
Price to Book Ratio (P/B)0.861.011.331.560.890.790.691.050.97
Price to Free Cash Flow Ratio (P/FCF)3.53-64.4683.059.277.62-11.38311.7236.7723.22
Enterprise Value to Sales (EV/Sales)3.093.683.142.742.973.603.953.69
Enterprise Value to EBITDA (EV/EBITDA)7.3533.6740.6434.3624.0964.0741.6965.5835.96
Debt to Equity Ratio5.222.302.252.762.792.771.341.371.34
⚠️

Valuation Model Suspended

API Payload Error: Inverted or negative baseline Free Cash Flow margin detected (-1.8%).

Troubleshooting Notice: The upstream financial data supplier has uploaded corrupted or inverted baseline metrics for MATV. The server sandbox cannot calculate an intrinsic value path from negative cash generation baselines.

📘 Full Research Report

ℹ️

AI-Generated Research: This report is for informational purposes only.

📘 MATIV HOLDINGS INC (MATV) — Investment Overview

🧩 Business Model Overview

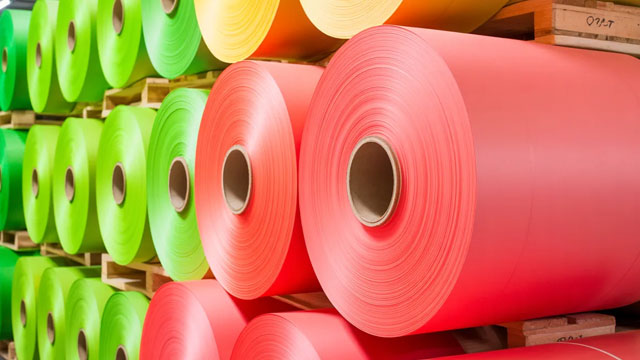
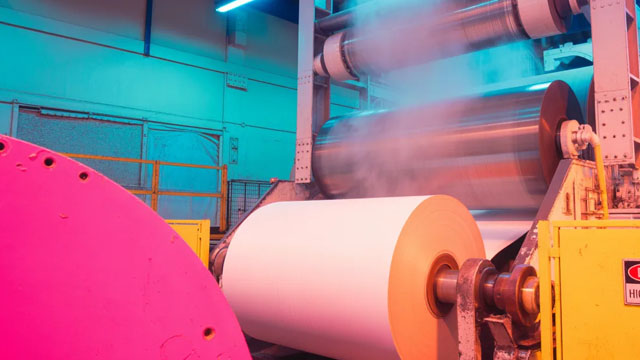
MATIV Holdings Inc. manufactures and supplies performance-oriented specialty chemicals used by industrial and consumer-adjacent customers. The business model centers on blending, formulation, and application support that help customers achieve product performance targets (e.g., cleaning efficacy, coating behavior, or process efficiency) while meeting cost and regulatory requirements. Rather than competing purely on commodity volume, MATIV’s value creation depends on engineering solutions that are difficult to swap once integrated into a customer’s manufacturing process and quality specifications.

Operationally, MATIV monetizes through a diversified portfolio of chemical products distributed through customer-specific relationships, with manufacturing scale and procurement discipline supporting cost competitiveness. A meaningful portion of revenue is tied to customer programs and qualification cycles, which lengthen customer commitment relative to standard commodity chemical purchasing.

💰 Revenue Streams & Monetisation Model

MATIV monetizes through sales of specialty chemical products into multiple end markets. Revenue is primarily product sales with pricing that typically reflects both demand conditions and the underlying input-cost environment. Monetisation drivers include:

  • Specialty mix and formulation content: Higher-performance product categories generally support stronger gross margins than commodity equivalents.
  • Customer qualification and process integration: Once a formulation is accepted, repeat purchases become more predictable than purely spot-market trade.
  • Commercial discipline and pass-through dynamics: Margin performance depends on the ability to manage input cost volatility and align pricing with contractual and competitive benchmarks.
  • End-market diversification: Exposure across industrial and consumer-adjacent applications can moderate cyclicality versus single-end-market peers.

Net profitability is most sensitive to (i) raw-material and energy costs, (ii) operational execution (capacity utilization, yield, and logistics), and (iii) pricing power in specialty formulations.

🧠 Competitive Advantages & Market Positioning

MATIV’s competitive position is best described as a specialty-chemicals switching-cost model supported by application know-how and process qualification, rather than a pure cost-lead commodity play. The economic moat is rooted in:

  • High switching costs (customer qualification): Performance requirements, regulatory documentation, and quality testing create friction for customers to change suppliers once a chemical system is embedded in production.
  • Intangible assets (formulation and application expertise): Tailored solutions and technical support help customers meet specific performance outcomes, which competitors must replicate to displace incumbent approvals.
  • Cost advantages from scale and purchasing: Procurement leverage and manufacturing know-how can reduce unit costs, supporting resilience when pricing softens.

COMPETITIVE BENCHMARKING:

  • Solenis (paper and industrial process chemicals): Solenis is heavily weighted toward process chemistry solutions and often benefits from deep application integration in paper and related industrial markets. MATIV competes where specialty performance and customer qualification matter, but with a broader multi-industry chemical portfolio.
  • Stepan (surfactants and specialty chemicals): Stepan competes in performance chemical categories where formulation performance and regulatory compliance drive stickiness. MATIV similarly emphasizes specialty outcomes rather than pure commodity pricing, though product end-markets and regional footprints may differ.
  • Nouryon (specialty chemicals and industrial solutions): Nouryon competes on technical value and application-led selling across various industrial uses. MATIV’s positioning focuses on embedded customer requirements and solution capabilities across its served end-markets, aiming to reduce the likelihood of base-business churn.

🚀 Multi-Year Growth Drivers

Over a 5–10 year horizon, MATIV’s growth profile is supported by durable structural themes common to performance chemicals:

  • Shift toward higher-performance formulations: End users increasingly favor chemicals that reduce process friction, improve yields, and meet environmental and performance constraints—areas where application-specific expertise is valued.
  • Regulatory and sustainability compliance as a demand driver: Compliance requirements can favor suppliers capable of reformulating, documenting, and supporting adoption of acceptable alternatives.
  • Industrial productivity and quality emphasis: Customers often seek chemicals that improve throughput, stability, and product quality—creating sustained pull-through for qualified suppliers.
  • Commercial leverage from deeper customer penetration: Technical service models can expand wallet share within existing accounts through additional formulations, upgrades, and broader platform rollouts.
  • Capacity and operational excellence: Execution on plant utilization, yield improvement, and supply-chain reliability supports margin expansion even when top-line growth is moderate.

TAM expansion is best viewed through application growth and replacement demand (performance and regulatory-driven substitution), rather than through a simple linear increase in chemical volumes.

⚠ Risk Factors to Monitor

  • Input cost volatility: Specialty chemicals frequently face exposure to feedstock and energy price swings; margin depends on contract structures and pricing agility.
  • Customer concentration and qualification cycles: Loss of a major program or extended re-qualification time can pressure revenue growth and profitability.
  • Regulatory and compliance risks: Changes in chemical regulations can require reformulation and documentation efforts, increasing costs and execution burden.
  • Environmental liabilities and plant performance: Capital needs, maintenance reliability, and environmental compliance affect sustained earnings power.
  • Cyclicality in end markets: Industrial demand can soften, reducing volume leverage and compressing margins without offsetting pricing actions.

📊 Valuation & Market View

Specialty and performance chemical businesses are commonly valued using EV/EBITDA and EV/Sales multiples, with investors focusing on earnings quality and margin durability rather than only top-line growth. Key valuation drivers typically include:

  • Gross margin sustainability through mix, cost management, and pricing actions.
  • Operating leverage tied to capacity utilization and disciplined operating expenses.
  • Quality of earnings (repeatability of contracted/customer-qualified demand).
  • Capital intensity and maintenance capex profile required to sustain and grow production capability.

For MATIV, the market’s view tends to hinge on whether specialty mix and customer stickiness can offset cyclical volume pressures and input-cost volatility.

🔍 Investment Takeaway

MATIV’s long-term investment case rests on a specialty-chemical moat anchored in switching costs from customer qualification and application-driven differentiation. With performance-oriented products across multiple end markets, the company is positioned to compete less like a commodity supplier and more like a qualified solutions partner, where technical support and formulation capability help sustain demand and margins through normal economic cycles.


⚠ AI-generated — informational only. Validate using filings before investing.

📰 Market News & Coverage

15 Stories Available

Real-time institutional reporting and market updates for MATV.

businesswire.com2026-05-19

Mativ Announces Participation in Upcoming Investor Conferences

ALPHARETTA, Ga.--(BUSINESS WIRE)--Mativ Holdings, Inc. (NYSE: MATV) today announced its participation in the following upcoming investor conferences: Stifel 2026 Boston Cross Sector 1x1 Conference in Boston, MA – June 2, 2026 Deutsche Bank 17th Annual Basic Materials Conference in New York, NY – June 3, 2026 Thank you for your interest in Mativ. We look forward to your participation in the conferences. About Mativ Mativ Holdings, Inc. is a global leader in specialty materials, solving our custo.

seekingalpha.com2026-05-11

Mativ Holdings, Inc. (MATV) Q1 2026 Earnings Call Transcript

Mativ Holdings, Inc. (MATV) Q1 2026 Earnings Call Transcript

seekingalpha.com2026-05-11

Mativ Holdings: A Speculative Buy On Improving Fundamentals

Mativ Holdings is progressing toward profitability, with improved gross margins despite a slight revenue decline. MATV generated $20M in underlying free cash flow for Q1, comfortably covering its $0.10 quarterly dividend. High net debt ($950M) and interest expenses remain key risks, with debt reduction critical for accelerating free cash flow.

marketbeat.com2026-05-11

Mativ Q1 Earnings Call Highlights

Mativ NYSE: MATV reported higher first-quarter profitability and improved cash flow despite mixed demand across its portfolio, with management pointing to pricing actions, cost controls and operational changes as key drivers of margin expansion.

zacks.com2026-05-06

Mativ Holdings (MATV) Surpasses Q1 Earnings Estimates

Mativ Holdings (MATV) came out with quarterly earnings of $0.06 per share, beating the Zacks Consensus Estimate of $0.02 per share. This compares to a loss of $0.14 per share a year ago.

businesswire.com2026-05-06

Mativ Announces First Quarter 2026 Results

ALPHARETTA, Ga.--(BUSINESS WIRE)--Mativ Holdings, Inc. ("Mativ" or the "Company") (NYSE: MATV) reported financial results for the three-months ended March 31, 2026. Mativ First Quarter 2026 Highlights1 Sales of $479.6 million decreased 1.1% year over year, and 0.4% on an organic basis GAAP loss was $11.7 million, an improvement of 97.3%, compared to $425.5 million in prior year period (which included a $411.9 million goodwill impairment charge); GAAP EPS was $(0.22) Adjusted income was $3.9 mil.

defenseworld.net2026-04-27

Head to Head Review: Ingevity (NYSE:NGVT) and Mativ (NYSE:MATV)

Ingevity (NYSE: NGVT - Get Free Report) and Mativ (NYSE: MATV - Get Free Report) are both basic materials companies, but which is the superior stock? We will compare the two businesses based on the strength of their risk, institutional ownership, earnings, dividends, analyst recommendations, valuation and profitability. Insider and Institutional Ownership 91.6% of Ingevity shares are

businesswire.com2026-04-21

Mativ Announces Conference Call to Discuss First Quarter 2026 Results

ALPHARETTA, Ga.--(BUSINESS WIRE)--Mativ Holdings, Inc. (NYSE: MATV) today announced it will release first quarter 2026 financial results on May 6, 2026, after the market closes. A conference call to discuss these results has been scheduled for 8:30 a.m. ET on May 7, 2026. The call can be accessed via webcast or by telephone using the information set forth below. An online replay of the call will be accessible on the Investors section of Mativ's website at ir.mativ.com shortly after the webcast.

defenseworld.net2026-04-14

Mativ Holdings, Inc. $MATV Shares Acquired by Deprince Race & Zollo Inc.

Deprince Race and Zollo Inc. lifted its holdings in shares of Mativ Holdings, Inc. (NYSE: MATV) by 14.5% during the undefined quarter, according to its most recent disclosure with the SEC. The institutional investor owned 453,965 shares of the company's stock after purchasing an additional 57,421 shares during the quarter. Deprince Race and

gurufocus.com2026-03-31

JPMorgan Leads $500M Mativ Loan at 95 Amid Weak Demand

Risk appetite in credit markets may be starting to soften. JPMorgan Chase and Co. (JPM) has led a $500 million leveraged loan sale for Mativ Holdings Inc. (MATV)

businesswire.com2026-02-23

Mativ Announces Participation in Upcoming Investor Conference

ALPHARETTA, Ga.--(BUSINESS WIRE)--Mativ Holdings, Inc. (NYSE: MATV) today announced its participation in the following upcoming investor conference: J.P. Morgan 2026 Global Leveraged Finance Conference in Miami, FL – March 2-3, 2026 Thank you for your interest in Mativ. We look forward to your participation in the conference. About Mativ Mativ Holdings, Inc. is a global leader in specialty materials, solving our customers' most complex challenges by engineering bold, innovative solutions that c.

defenseworld.net2026-02-22

Mativ (NYSE:MATV) Shares Gap Down – Should You Sell?

Mativ Holdings, Inc. (NYSE: MATV - Get Free Report)'s stock price gapped down before the market opened on Friday. The stock had previously closed at $13.29, but opened at $12.76. Mativ shares last traded at $11.83, with a volume of 63,292 shares traded. Trending Headlines about Mativ Here are the key news stories impacting Mativ

seekingalpha.com2026-02-19

Mativ Holdings, Inc. (MATV) Q4 2025 Earnings Call Transcript

Mativ Holdings, Inc. (MATV) Q4 2025 Earnings Call Transcript

zacks.com2026-02-18

Mativ Holdings (MATV) Q4 Earnings and Revenues Beat Estimates

Mativ Holdings (MATV) came out with quarterly earnings of $0.15 per share, beating the Zacks Consensus Estimate of $0.09 per share. This compares to earnings of $0.05 per share a year ago.

businesswire.com2026-02-18

Mativ Announces Fourth Quarter and Full Year 2025 Results

ALPHARETTA, Ga.--(BUSINESS WIRE)--Mativ Holdings, Inc. ("Mativ" or the "Company") (NYSE: MATV) reported financial results for the three months and year ended December 31, 2025. Mativ Fourth Quarter 2025 Highlights1 Sales of $463.1 million increased 1.0% year over year, and 1.9% on an organic basis GAAP income was $100.8 million; GAAP EPS was $1.80 Adjusted income was $8.5 million; Adjusted EPS was $0.15 Adjusted EBITDA was $53.5 million, up 19% versus prior year Adjusted EBITDA margin was 11.6%.

📊 AI Financial Analysis

Powered by StockMarketInfo
Earnings Data: Q Ending 2026-03-31

"MATV reported Q1’26 revenue of $479.6M (QoQ +3.6%, YoY -1.1%) and net income of -$11.7M (QoQ deterioration from $100.8M; YoY improvement vs -$425.5M, but still loss-making). EPS was -$0.22 versus -$7.82 in Q1’25, reflecting a substantial year-over-year earnings rebound, although profitability remains unstable. Margins contracted sequentially: gross margin fell to 17.7% from 15.4% in Q4 (improves QoQ), but operating margin slipped to 1.5% from 2.5% and net margin moved to -2.4% from +21.8%, indicating heavy below-the-line pressure in the quarter. QoQ incomeBeforeTax turned negative (from -$10.2M to -$8.7M) and the company again posted an interest burden (interest expense $17.5M). Cash flow quality is weak near-term. Operating cash flow was only +$1.0M (down sharply QoQ from +$19.3M) and free cash flow was +$1.0M, despite dividends of -$5.9M. The company’s balance sheet shows equity erosion continuing: total stockholders’ equity was $472.3M vs $498.7M QoQ, while leverage remains high with total debt ~$1.087B and net debt ~$1.004B. Total shareholder returns are strong on momentum: the stock is up +107.1% over 1 year (dividend yield ~1.24%), boosting the shareholder return score despite fundamental volatility."

Revenue Growth

Neutral

Revenue was $479.6M in Q1’26: +3.6% QoQ vs $463.1M in Q4’25, and -1.1% YoY vs $484.8M in Q1’25—broadly flat with slight YoY softness.

Profitability

Neutral

Net income was -$11.7M in Q1’26 vs +$100.8M QoQ and -$425.5M YoY. Operating margin declined QoQ (1.5% vs 2.5%) and net margin turned negative (-2.4%), showing earnings volatility and margin instability.

Cash Flow Quality

Neutral

Operating cash flow was only +$1.0M (down from +$19.3M QoQ). Free cash flow was +$1.0M while dividends continued (-$5.9M), implying limited cash cushion in the latest quarter.

Leverage & Balance Sheet

Caution

High leverage persists: total debt ~$1.087B and net debt ~$1.004B. Equity declined QoQ ($472.3M vs $498.7M), with retained earnings still deeply negative, weakening balance-sheet resilience.

Shareholder Returns

Good

Strong price momentum: +107.1% 1y_change. Dividend yield is ~1.24% per provided ratios/price context, supporting total return despite operating underperformance.

Analyst Sentiment & Valuation

Caution

No explicit price target provided. Valuation multiples are distorted by losses (negative P/E), and fundamentals in Q1’26 remain loss-making, limiting conviction even with strong recent momentum.

Disclaimer:This analysis is AI-generated for informational purposes only. Accuracy is not guaranteed and this does not constitute financial advice.

Fundamentals Overview

Loading fundamentals overview...

Mativ’s Q1 2026 delivered strong profitability and cash generation despite visible demand softness, especially in healthcare. Consolidated adjusted EBITDA margin expanded to 9.9% (+220 bps YoY), supported by favorable price-to-input cost dynamics, lower manufacturing costs, and tighter SG&A. Segment performance was differentiated: FAM margins rose +430 bps while SAS rose +160 bps, but SAS results were pressured by below-expected healthcare volumes and customer destocking (creating a difficult year-over-year comp). Cash flow improved materially: free cash flow was a use of $7m, yet improved by more than $22m YoY, with operating cash flow up >$16m from lower restructuring and timing of capex. Management also reset the inflation narrative, now expecting $40m-$50m of 2026 input inflation and taking late-Q1 pricing actions across categories to fully offset it. Q2 guidance points to a mid-single-digit adjusted EBITDA decline versus a strong prior year as healthcare volumes remain near-term weak.

AI IconGrowth Catalysts

  • Specialty films commitment from a new aerospace customer (commercial relationship expected to commence Q2; shipments starting later in Q2; slow ramp)
  • European filtration aftermarket momentum (transportation, water, industrial) plus gains in paint protection and industrial films
  • FAM growth across filtration/films and aftermarket transportation, water and industrial applications
  • SAS growth across finished have categories and commercial print (partially offset by lower healthcare volumes)

Business Development

  • New aerospace customer specialty films commitment (financial terms/timing not disclosed due to confidentiality; ramp expected from late Q2)

AI IconFinancial Highlights

  • Net sales: $480m (organic nearly flat YoY; down ~1% reported) driven by favorable selling prices/currency offset by lower volume/mix
  • Adjusted EBITDA: $47.5m (+28% YoY); Adjusted EBITDA margin: 9.9% (+220 bps YoY), best Q1 since mid-2022 merger
  • FAM: margins 14.6% (+430 bps YoY) with adjusted EBITDA +41% YoY; improvements from price-to-input cost, lower manufacturing costs, favorable currency, and lower SG&A (partially offset by volume/mix)
  • SAS: margins 10.5% (+160 bps YoY) with adjusted EBITDA ~+$31m (+~16% YoY); benefits from favorable price-to-input cost and reduced SG&A (partially offset by volume/mix)
  • Reporting change: segment adjusted EBITDA margins are ~100 bps lower than originally reported due to allocating certain centralized IT/finance/HR expenses to segments; consolidated adjusted EBITDA and margin unchanged
  • Q1 tax rate negative: driven by geographic earnings mix and inability to benefit from losses in certain jurisdictions with full valuation allowance
  • Q1 free cash flow: use of $7m; improved by >$22m YoY; best Q1 since merger (YoY improvement tied to >$16m operating cash flow, lower restructuring expenses and capital expenditure timing)
  • Middle East/inflation planning: full-year input cost inflation estimate revised to $40m-$50m (from prior $20m-$25m); incremental late-Q1 pricing actions across all product categories to fully recover 2026 inflation

AI IconCapital Funding

  • April refinancing: reduced number of debt tranches and bank participants from 15 to 8; rightsized revolving facility to $305m; eliminated delayed draw term loan
  • New/updated facilities: revised cash flow revolver plus new $90m term loan A (matures 2031) and new $500m term loan B (matures 2033); no debt maturities until late 2029
  • Expected annual interest expense: ~$76m going forward (vs prior estimate ~$74m)
  • Capital allocation priority: delevering; net debt ~$954m at quarter end (seasonal uptick); liquidity ~$499m; net leverage 4.1x (decreasing vs 2025 year-end)
  • 2026 investment plans disclosed in February: additional $10m working capital and $5m CapEx for growth

AI IconStrategy & Ops

  • Completed underperforming plant closure: Wilson, North Carolina (previously announced as part of portfolio review/footprint optimization)
  • SKU rationalization and operational workflow simplification to improve supply chain efficiency and reduce complexity
  • Temporary outage at Knoxville, Tennessee facility late in quarter: resolved; plant fully operational by Q&A
  • Operational/workflow simplification and SG&A optimization referenced as realized nearly $20m savings in 2025; 2026 cost savings target $15m-$20m on schedule
  • Governance/operations reporting alignment: centralized costs (IT infrastructure, finance/accounting shared services, regional HR) reallocated to segments beginning in Q1

AI IconMarket Outlook

  • Q2 2026 outlook: expect Q2 adjusted EBITDA to be down a mid-single-digit percentage vs strong prior year, largely due to near-term health care volume weakness
  • Middle East conflict impact expectation: direct impacts manageable via further pricing; ongoing monitoring for indirect demand effects
  • Pricing/inflation expectation: fully offset $40m-$50m forecasted 2026 input cost inflation via pricing actions; additional pricing if oil settles higher
  • Next earnings call: August (per closing remarks)

AI IconRisks & Headwinds

  • Health care vertical: customer destocking in Q1 2026 vs inventory building in prior year created tougher comparison and near-term volume weakness
  • Supply chain inefficiencies: temporary Knoxville, Tennessee operational outage late in Q1 (resolved, but indicates execution risk)
  • Demand softness beyond healthcare: release liner and labels businesses described as soft
  • Sticky input cost inflation risk: Middle East conflict increases oil/related costs; pricing may remain challenging if costs remain elevated (oil/logistics/insurance risk premium expected to persist)
  • Reduced forward visibility due to geopolitical volatility impacting volumes and demand timing

Q&A: Analyst Interest

  • Topic: Health care destocking timing and normalization expectations: Management cited two drivers (destocking causing a tough lapping comparison vs prior inventory build and a temporary Knoxville outage now fully resolved). They said no precise timeline exists, but expect improvement in the back half as end-demand normalizes.
  • Topic: Pricing power vs input cost trajectory (and reversing prices if costs fall): Management argued sticky input inflation in 2026 due to infrastructure damage, logistics/insurance costs, and a lingering risk premium. They expect to maintain the margin-protection playbook with further pricing if oil rises; they did not signal proactive price reductions if costs fall.
  • Topic: Cash flow cadence for 2026 amidst seasonality: Management reiterated Q1 is typically the most demanding period due to seasonal working-capital build ahead of Q2/Q3 production and first-quarter incentive payouts. They expected normal seasonality going forward (strongest in Q2/Q3; positive year-end), plus planned incremental $10m working capital and $5m CapEx.

Sentiment: MIXED

Note: This summary was synthesized by AI from the MATV Q1 2026 earnings transcript. Financial data is complex; please verify all metrics against official SEC filings before making investment decisions.

📋 Official Regulatory 10-K / 10-Q SEC Filings

Direct authenticated documentation links to audited SEC database reports for MATV.

SEC EDGAR Live Feed
Loading financial data and tables...
📁

SEC Filings (MATV)

© 2026 Stock Market Info — Mativ Holdings, Inc. (MATV) Financial Profile