Matson, Inc.

Matson, Inc. (MATX) Market Cap

Matson, Inc. has a market capitalization of $5.67B.

Price: $187.32

0.03 (0.02%)

Market Cap: 5.67B

NYSE · time unavailable

CEO: Matthew J. Cox

Sector: Industrials

Industry: Marine Shipping

IPO Date: 1973-05-03

Website: https://www.matson.com

Matson, Inc. (MATX) - Company Information

Market Cap: 5.67B|Sector: Industrials

Company Profile

Matson, Inc., together with its subsidiaries, provides ocean transportation and logistics services. The company's Ocean Transportation segment offers ocean freight transportation services to the domestic non-contiguous economies of Hawaii, Alaska, and Guam, as well as to other island economies in Micronesia. It primarily transports dry containers of mixed commodities, refrigerated commodities, packaged foods and beverages, building materials, automobiles, and household goods; livestock; seafood; general sustenance cargo; and garments, footwear, e-commerce, and other retail merchandise. This segment also operates an expedited service from China to Long Beach, California, and various islands in the South Pacific, as well as Okinawa, Japan; and provides container stevedoring, refrigerated cargo services, inland transportation, container equipment maintenance, and other terminal services to ocean carriers on the Hawaiian islands of Oahu, Hawaii, Maui, and Kauai, as well as in the Alaska locations of Anchorage, Kodiak, and Dutch Harbor. In addition, the company offers vessel management and container transshipment services. Its Logistics segment provides multimodal transportation brokerage services, including domestic and international rail intermodal, long-haul and regional highway trucking, specialized hauling, flat-bed and project, less-than-truckload, and expedited freight services; less-than-container load consolidation and freight forwarding services; warehousing and distribution services; supply chain management services, and non-vessel operating common carrier freight forwarding services. The company serves the U.S. military, freight forwarders, retailers, consumer goods, automobile manufacturers, and other customers. The company was formerly known as Alexander & Baldwin Holdings, Inc. and changed its name to Matson, Inc. in June 2012. Matson, Inc. was founded in 1882 and is headquartered in Honolulu, Hawaii.

Analyst Sentiment

89%
Strong Buy

From 3 Active Polls

1Y Forecast: $190.00

▲ +1.4% Potential Upside

Consensus Target Metrics

Low Bound

$167

Median

$190

High Bound

$213

Average

$190

Price & Moving Averages

Loading chart...

🎯 Wall Street Analyst Intelligence Report

1-Year structural target targets, chart projections, and sentiment maps.

Average 1Y Target
$190.00
▲ +1.43% Upside
Low Target
$167.00
-11% Risk
Median Target
$190.00
1% Mid
High Target
$213.00
14% Max
Consensus
Buy
7 / 11 Buys

Consensus Trend Projection

Trailing closures vs. 12-month metrics map.

Analyst Vote Distribution

Aggregate institutional coverage sentiment weights.

📊 Historical Valuation Multiples

Real-time Trailing Twelve Month (TTM) momentum side-by-side with discrete quarterly metrics.

Fiscal QuarterTTMQ1 2026Q4 2025Q3 2025Q2 2025Q1 2025Q4 2024Q3 2024Q2 2024
Period EndingTrailing 12MMar 31, 2026Dec 31, 2025Sep 30, 2025Jun 30, 2025Mar 31, 2025Dec 31, 2024Sep 30, 2024Jun 30, 2024
Market Cap ($M)5,6694,9843,8053,1063,5744,2044,4634,7494,376
Enterprise Value ($M)6,2665,5814,3913,7324,1814,7884,9455,1364,871
Price to Earnings Ratio (P/E)13.2722.016.655.769.4414.548.725.969.66
Price/Earnings-to-Growth Ratio (PEG)0.971.520.440.56
Price to Sales Ratio (P/S)1.716.584.473.534.305.385.014.945.16
Price to Book Ratio (P/B)2.091.831.381.151.371.601.681.861.82
Price to Free Cash Flow Ratio (P/FCF)13.55109.2943.3934.3918.35-21019.8889.2625.2218.38
Enterprise Value to Sales (EV/Sales)7.365.154.245.036.125.555.345.75
Enterprise Value to EBITDA (EV/EBITDA)8.0038.3822.4515.2421.2228.3324.8115.3721.64
Debt to Equity Ratio0.760.260.260.270.250.270.280.260.28

MATX Growth Runway Model

Standard long term linear growth fade

Multi-Stage Discounted Cash Flow Sandbox

Market Price$187.32
Intrinsic Value$254.56
Market Alignment
Undervalued by 35.9%relative to calculated intrinsic value
9.00%
Exp: -2%-2%
i

Growth runway slowdown

This value provides a time window for the growth rate to decline beyond Stage 1 toward the terminal rate. Longer windows are most useful for companies with high growth starting conditions or strong competitive advantages. This option stretches out the growth rate slowdown across 5, 10, or 15-year steps. A high-growth starting condition (exceeding a 25% initial growth rate) automatically applies a curve decay to simulate realistic, rapid market saturation.
i

Terminal growth rate

With long-term inflation between 3-5%, revenue must grow by that baseline to maintain flat real-world market share. This value sets the permanent terminal growth rate to factor into the valuation beyond the growth slowdown runway toward maturity.

3-Stage Financial Runway Horizon

🧠 Perpetuity Horizon Engine (Stage 3: Post-2035)

Terminal FCF Base$0.54B
Perpetuity TV Value$10.07B
Discounted TV (PV)$4.26B
TV Weighting %55.9%
⚠️
Financial Model Disclaimer & Risk Disclosure: This interactive scenario simulator is an educational sandbox provided strictly for informational and analytical research purposes. Core historical financial statements and consensus estimates are sourced directly via Financial Modeling Prep (FMP). All downstream outputs are entirely deterministic, hypothetical projections generated by combining automated mathematical formulas (including linear interpolation and Gaussian bell-curve decay models) with user-selected variables and third-party financial data inputs. Users assume all liability for trading decisions executed based on these sandbox calculations.

📘 Full Research Report

ℹ️

AI-Generated Research: This report is for informational purposes only.

```html

📘 MATSON INC (MATX) — Investment Overview

🧩 Business Model Overview

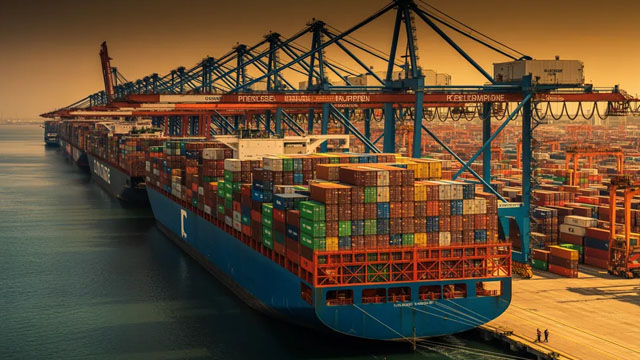
Matson is a niche ocean transportation and logistics operator with a concentrated operating footprint across the United States—anchored by serving the U.S. West Coast-to-Hawaii and U.S. West Coast-to-Guam lanes. The model is built around running a dedicated network of containerized freight movements using an owned/managed vessel fleet, coordinated terminal operations, and time-tabled service reliability.

In practical terms, shippers tender cargo for container shipment, Matson transports it via scheduled ocean routes, and the logistics chain is completed through port-to-destination drayage and intermodal handling where applicable. The value proposition is less about “cheapest headline shipping” and more about dependable transit windows, route coverage, and operational execution in markets where alternative routing options are limited by geography.

💰 Revenue Streams & Monetisation Model

Revenue is primarily derived from freight revenue earned per container movement (transactional by nature), supplemented by logistics and related service revenue tied to handling and movement of cargo through Matson’s network. Pricing typically incorporates a combination of base freight and pass-through components such as fuel-related surcharges, along with contractual arrangements that can reduce exposure to short-term rate swings.

Margin drivers are closely linked to vessel and route utilization (how fully capacity is deployed), operating efficiency (vessel performance, crew and maintenance productivity), and cost discipline (port/terminal costs, equipment expenses, and labor). Because ocean shipping is capital-intensive and utilization-sensitive, operating leverage is meaningful: incremental demand and improved fleet deployment typically flow through more than proportionally to earnings than in lower-fixed-cost models.

🧠 Competitive Advantages & Market Positioning

Matson’s moat is best described as a combination of geographic network advantages and operational switching friction, supported by an asset base and execution track record.

  • Geographic cost advantage (route reality): Hawaii and Guam are inherently distance- and routing-constrained markets. The economic barrier to entry is structural because service coverage, sailing frequency, and vessel scheduling must be maintained to compete on reliability.
  • Switching costs: Shippers and freight forwarders value predictable transit times, equipment coordination, and routable service commitments. Changing carriers often requires retooling logistics plans, contracts, and inventory/fulfillment schedules—raising practical friction.
  • Scale in niche lanes: Concentration in specific trades allows Matson to run routes with better density and operational rhythm than generalized carriers that prioritize high-volume global lanes.

Competitive benchmarking:

  • Crowley — strong presence in Hawaii/territory-related shipping. Matson competes by emphasizing route coverage and execution in these same geographic niches.
  • MAERSK / MSC (large global container lines) — dominant on transpacific and global networks. Their focus is primarily high-volume mainland trades, leaving niche geographic lanes where Matson has stronger service fit.
  • Other U.S. West Coast and regional ocean carriers — compete where they can offer overlapping sailings into parts of Matson’s corridors. Matson’s differentiated positioning is strongest where routing constraints and service reliability matter most.

Overall, Matson’s advantage is harder to replicate than a pure cost or pricing story because it depends on network permanence, fleet deployment discipline, and customer logistics integration in routes where “substitute” shipping options are limited.

🚀 Multi-Year Growth Drivers

  • Structural demand in constrained territories: Long-run cargo needs tied to population, infrastructure development, tourism-driven consumption, and defense/government logistics in Hawaii and Guam support relatively steady underlying volume versus more discretionary global trades.
  • Supply chain rebalancing toward reliability: Shippers increasingly optimize for service dependability and planning certainty. In niche geographic markets, carriers that sustain schedules tend to win and retain business through operational outcomes, not only rate competitiveness.
  • Regulatory-driven fleet optimization: Maritime emission and efficiency standards increase the economic cost of operating non-compliant or inefficient vessels. Over a multi-year horizon, this tends to favor operators with the ability and discipline to manage modernization and compliance at scale.
  • Route density and intermodal execution: Better density, equipment management, and terminal throughput can improve unit economics even without major step-changes in total demand.

Taken together, the growth profile is less about “hyper growth” and more about compounding performance through service durability, disciplined capacity deployment, and regulatory compliance execution in markets where logistics constraints are persistent.

⚠ Risk Factors to Monitor

  • Freight rate cyclicality and utilization risk: Ocean shipping earnings can swing materially with global capacity, trade imbalances, and demand shocks. Matson’s niche focus reduces some exposure but does not eliminate it.
  • Fuel cost and margin pass-through: While surcharges can partially offset fuel variability, timing differences and contract structures may leave operating margins exposed when fuel costs move faster than pricing adjustments.
  • Regulatory and compliance capex: Emissions and vessel efficiency requirements can raise maintenance, retrofit, and operating costs. Failure to execute economically could pressure competitiveness.
  • Capital intensity and fleet renewal: Sustaining service levels requires continuous investment and disciplined fleet management. Cost of capital and timing of vessel delivery can affect returns.
  • Operational disruption: Labor constraints, port congestion, weather-related disruptions, and equipment shortages can impair schedule integrity, which is central to customer stickiness in constrained markets.

📊 Valuation & Market View

Market participants typically value shipping and transportation operators using a framework that emphasizes enterprise value versus operating cash flow (EV/EBITDA) and cycle-adjusted earnings power rather than steady recurring revenue metrics. Key valuation sensitivity comes from:

  • Operating leverage: how quickly incremental demand translates into utilization gains and margin expansion.
  • Cost per unit and fleet efficiency: crew productivity, maintenance efficiency, and throughput at terminals.
  • Regulatory capex trajectory: the magnitude and timing of compliance-related investments relative to sustainable cash generation.
  • Contracting and rate structure: degree of revenue stability from contractual arrangements versus spot dynamics.

For Matson specifically, investors generally underwrite durability by assessing whether the operating network produces consistent route density and whether modernization investments can be executed without structurally impairing unit economics.

🔍 Investment Takeaway

Matson’s long-term investment case rests on network-based geographic advantages in constrained U.S. territories, reinforced by operational switching friction and a fleet-and-execution model that supports reliable service. The core risk is cyclical freight dynamics and regulatory capex, but the structural nature of its routes and the practical difficulty of replacing service coverage create a durable competitive position that can compound value across a full cycle when capacity discipline and compliance execution remain strong.


⚠ AI-generated — informational only. Validate using filings before investing.

```

📰 Market News & Coverage

15 Stories Available

Real-time institutional reporting and market updates for MATX.

gurufocus.com2026-05-20

Matson Inc (MATX) Stock Up 4.8% but GF Value Says Overvalued -- GF Score: 86/100

On May 20, 2026, Matson Inc (MATX) shares rose 4.8% today, reaching a current price of $188.62. The stock has experienced significant price appreciation over th

seekingalpha.com2026-05-08

The London Company Small Cap Portfolio Q1 2026 Portfolio Review

Matson was the top performer as container shipping rates strengthened amid supply chain disruptions and management executed on operational efficiency initiatives. Revolve Group sold off as the online fashion retailer faced softer consumer demand and lower discretionary spending. We added to Haemonetics Corporation following recent share price volatility.

prnewswire.com2026-05-05

MATSON NEW VESSEL CONSTRUCTION PROGRAM MARKS TWO MILESTONES

PHILADELPHIA, May 5, 2026 /PRNewswire/ -- Matson, Inc. ("Matson"; NYSE: MATX) today marked two milestones in its fleet renewal program with the beginning of hull assembly on the second of three new LNG powered "Aloha Class" containerships designed for its Hawaii and China-Long Beach Express (CLX) services, and the start of construction on its third new vessel at Hanwha Philly Shipyard, Inc. (HSPI) in Pennsylvania. A small shipyard ceremony to mark the dock mounting of the first grand block assembly of the second new vessel was followed by the cutting of steel plates to initiate work to build the third vessel.

seekingalpha.com2026-05-04

Matson, Inc. (MATX) Q1 2026 Earnings Call Transcript

Matson, Inc. (MATX) Q1 2026 Earnings Call Transcript

prnewswire.com2026-05-04

MATSON, INC. ANNOUNCES FIRST QUARTER 2026 RESULTS

1Q26 EPS of $1.85 versus $2.18 in 1Q25 1Q26 Net Income of $56.6 million versus $72.3 million in 1Q25 1Q26 Consolidated Operating Income of $61.4 million versus $82.1 million in 1Q25 1Q26 EBITDA of $113.3 million versus $131.7 million in 1Q25 Repurchased approximately 0.4 million shares in 1Q26 Raises full year outlook HONOLULU, May 4, 2026 /PRNewswire/ -- Matson, Inc. ("Matson" or the "Company") (NYSE: MATX), a leading U.S. carrier in the Pacific, today reported net income of $56.6 million, or $1.85 per diluted share, for the quarter ended March 31, 2026.  Net income for the quarter ended March 31, 2025 was $72.3 million, or $2.18 per diluted share.

zacks.com2026-04-28

Is WisdomTree U.S. SmallCap ETF (EES) a Strong ETF Right Now?

Designed to provide broad exposure to the Style Box - Small Cap Value category of the market, the WisdomTree U.S. SmallCap ETF (EES) is a smart beta exchange traded fund launched on 02/23/2007.

prnewswire.com2026-04-23

MATSON ANNOUNCES ADDITION OF 3 MILLION SHARES TO EXISTING SHARE REPURCHASE PROGRAM AND QUARTERLY DIVIDEND OF $0.36 PER SHARE

HONOLULU, April 23, 2026 /PRNewswire/ -- The Board of Directors of Matson, Inc. (NYSE: MATX), a leading U.S. carrier in the Pacific, approved adding three million shares to its existing share repurchase program and extending the program to December 31, 2029.  As of April 23, 2026, the existing share repurchase program had approximately 0.7 million shares remaining.

gurufocus.com2026-04-21

Matson Inc (MATX) Stock Down 3.6% but Still Overvalued -- GF Score: 79/100

On April 21, 2026, Matson Inc (MATX) shares fell 3.6% today, bringing the current price to $170.68. The stock has experienced a 52-week range of $86.97 to $180.

prnewswire.com2026-04-20

MATSON TO ANNOUNCE FIRST QUARTER 2026 RESULTS ON MAY 4, 2026

HONOLULU, April 20, 2026 /PRNewswire/ -- Matson, Inc. ("Matson" or the "Company") (NYSE: MATX), a leading U.S. carrier in the Pacific, today announced that it will release its financial results for the first quarter on Monday, May 4, 2026. A conference call is scheduled for 4:30 p.m.

defenseworld.net2026-04-19

Matson (NYSE:MATX) Reaches New 12-Month High – What’s Next?

Matson, Inc. (NYSE: MATX - Get Free Report) hit a new 52-week high during trading on Friday. The stock traded as high as $178.61 and last traded at $178.4330, with a volume of 38338 shares traded. The stock had previously closed at $174.63. Wall Street Analysts Forecast Growth Several research analysts have commented on the

defenseworld.net2026-04-17

Financial Analysis: RXO (NYSE:RXO) & Matson (NYSE:MATX)

RXO (NYSE: RXO - Get Free Report) and Matson (NYSE: MATX - Get Free Report) are both mid-cap transportation companies, but which is the better investment? We will contrast the two companies based on the strength of their risk, dividends, profitability, valuation, institutional ownership, analyst recommendations and earnings. Analyst Recommendations This is a breakdown of current ratings

defenseworld.net2026-04-06

Allspring Global Investments Holdings LLC Increases Holdings in Matson, Inc. $MATX

Allspring Global Investments Holdings LLC boosted its stake in shares of Matson, Inc. (NYSE: MATX) by 97.5% during the fourth quarter, according to its most recent Form 13F filing with the SEC. The fund owned 79,767 shares of the shipping company's stock after buying an additional 39,370 shares during the period. Allspring Global

defenseworld.net2026-04-06

Matson, Inc. (NYSE:MATX) Receives Average Recommendation of “Hold” from Analysts

Matson, Inc. (NYSE: MATX - Get Free Report) has earned a consensus rating of "Hold" from the six ratings firms that are covering the stock, MarketBeat reports. Four analysts have rated the stock with a hold rating and two have given a buy rating to the company. The average 12-month price target among brokers that have

defenseworld.net2026-03-23

Contrasting Matson (NYSE:MATX) & Royal Mail (OTCMKTS:ROYMY)

Royal Mail (OTCMKTS:ROYMY - Get Free Report) and Matson (NYSE: MATX - Get Free Report) are both mid-cap transportation companies, but which is the better investment? We will compare the two businesses based on the strength of their analyst recommendations, valuation, earnings, profitability, institutional ownership, risk and dividends. Institutional and Insider Ownership 84.8% of Matson shares

prnewswire.com2026-03-18

Matson Contributed $8.6 Million to Community Programs in 2025

$3.1 million to Food Security programs $ 1.8 million to Health & Human Services $871K to Environmental programs HONOLULU, March 18, 2026 /PRNewswire/ -- Matson contributed a total of $8.6 million in cash and in-kind support in 2025 to 709 charitable organizations and non-profit programs across the communities it serves.  Cash contributions, including funds directed by employees through the company's Matching Gift program, added up to $3.7 million in 2025, while the value of donated services and equipment totaled $4.9 million.

📊 AI Financial Analysis

Powered by StockMarketInfo
Earnings Data: Q Ending 2026-03-31

"MATX Q1’26 reported Revenue of $757.8M and Net Income of $56.6M (EPS $1.86). Revenue declined -11.1% QoQ (vs. Q4’25 $851.9M) but increased +-3.2% YoY (vs. Q1’25 $782.0M). Net Income fell -60.5% QoQ (from $143.1M) and -21.7% YoY (from $72.3M). Margins contracted: net profit margin fell to 7.5% from 16.8% in Q4’25 and 9.2% in Q1’25, indicating a meaningful profitability normalization/pressure. Balance sheet shows solid equity and liquidity, with Total Assets of $4.15B down from $4.76B in Q4’25, and Total Stockholders’ Equity steady at $2.73B. Debt appears lower on the quarter (Total Debt $342M vs. $727M), reducing leverage risk, though the near-term balance sheet mix is volatile. Cash flow remains positive: Operating Cash Flow was $94.0M and Free Cash Flow was $94.0M in Q1’26, while dividends paid were $11.0M and buybacks were $52.8M. Shareholder returns look strong on momentum: the stock is up +80.3% over the last 1 year, with a low indicated dividend yield (~0.22%), implying capital appreciation has driven total return. Analyst valuation context: consensus target is $190 vs. current ~$176.55 (limited upside)."

Revenue Growth

Fair

Revenue was $757.8M in Q1’26, down -11.1% QoQ but down slightly -3.2% YoY, suggesting a soft top-line trend into the latest quarter.

Profitability

Neutral

Net Income fell to $56.6M (-60.5% QoQ, -21.7% YoY). Net margin contracted to 7.5% from 16.8% in Q4’25 and 9.2% in Q1’25, indicating margin pressure.

Cash Flow Quality

Positive

Operating Cash Flow of $94.0M supports Free Cash Flow of $94.0M. The company returned capital via $11.0M dividends and $52.8M buybacks, but profitability declined materially.

Leverage & Balance Sheet

Positive

Total Assets decreased to $4.15B from $4.76B QoQ, while equity remained robust at $2.73B. Reported total debt and net debt are lower vs Q4’25, improving resilience.

Shareholder Returns

Strong

Strong momentum: price +80.3% over 1 year. Dividend yield is modest (~0.22%); buybacks in Q1’26 ($52.8M) support capital return.

Analyst Sentiment & Valuation

Neutral

Consensus price target ($190) is above current (~$176.55) for moderate upside, but the recent earnings profitability downshift may limit near-term rerating.

Disclaimer:This analysis is AI-generated for informational purposes only. Accuracy is not guaranteed and this does not constitute financial advice.

Fundamentals Overview

Loading fundamentals overview...

In Q1 2026, MATX’s headline is a $20.7M YOY decline in consolidated operating income to $61.4M, driven primarily by Ocean Transportation weakness in China service contribution and a Logistics drop from supply chain management. However, management said Ocean operating income exceeded expectations in Q1, supported by post–Lunar New Year China demand strength, while Q1 EPS was $1.85 and the tax rate fell to 16.6% (discrete item). The core forward driver is visibility that China demand extends through peak season, enabling higher utilization and healthier yields, with management guiding Q2 Ocean operating income about $20M above Q2 2025 and consolidated operating income about $20M higher YOY (despite expected negative fuel recovery lag). Fuel volatility (Iran conflict) is the key operational risk, but management repeatedly emphasized full-year recovery by end of year (most in Q3). Capital allocation remains steady: ~$54.4M repurchased in Q1, debt down to $351.1M, and continued heavy new-build milestone funding via the CCF.

AI IconGrowth Catalysts

  • China service post-Lunar New Year freight demand strengthening, expected to continue through peak season
  • E-commerce recurring volume from South China; post-holiday e-goods growth tied to demand for data center servers and racks
  • Air-to-ocean freight conversions benefiting from elevated air freight costs and reduced air cargo capacity
  • Thailand feeder service (commenced late Dec 2025) exceeding volume expectations; growth in North/South Vietnam and Thailand feeder network

Business Development

  • Southeast Asia market penetration to extend geographic reach/diversify origin ports (CLX/MAX)
  • Thailand feeder service commenced operations in late December 2025 (positive feedback; volume above expectations)
  • SSAT terminal joint venture contributed $5.0 million in Q1 2026 (YOY -$1.6 million), with full-year contribution expected below 2025’s $32.5 million

AI IconFinancial Highlights

  • Consolidated operating income: $61.4M in Q1 2026, down $20.7M YOY (Ocean -$19.0M; Logistics -$1.7M)
  • Ocean Transportation operating income exceeded expectations in Q1 2026, driven by higher freight demand post-Lunar New Year in China service
  • Logistics operating income declined YOY due to lower supply chain management contribution
  • EPS: diluted EPS $1.85; net income $56.6M (no explicit beat/miss vs analyst expectations provided)
  • Effective tax rate: 16.6% in Q1 2026 vs 21.6% prior year, driven by a discrete tax item reducing taxable income
  • Q2 2026 guidance: Ocean Transportation operating income approximately $20M above $98.6M in Q2 2025; Logistics operating income to approach $14.4M in Q2 2025; consolidated operating income approximately $20M higher YOY including expected negative impact from fuel cost recovery lag

AI IconCapital Funding

  • Returned capital (dividends + share repurchases) of $333.8M over trailing 12 months
  • Q1 2026 share repurchase: ~400,000 shares for $54.4M
  • Total repurchases since Aug 2021 through end of Mar 2026: ~14.2M shares (32.7% of stock) for ~$1.3B total cost
  • Apr 23, 2026: added 3.0M shares to existing share repurchase authorization
  • Debt: $351.1M at end of Q1 2026, down $10.1M vs end of Q4 2025
  • Cash and cash equivalents: ~$100M at Mar 31, 2026; Capital construction fund (CCF): ~$522M

AI IconStrategy & Ops

  • China service yield focus: maximizing yield on every Shanghai sailing while maintaining healthy freight rates
  • Operational positioning: shift back toward a more traditional Lunar New Year cycle; expect full/nearly full ships in Q2/Q3
  • Fuel cost recovery approach: rely on fuel surcharge mechanisms; guided that Q2 earnings will reflect a lag, with full recovery by end of year (most in Q3)
  • Milestone payment cadence for new-build program: ~$16M paid in Q1 from CCF; expected ~$213M in Q2, ~$34M in Q3, ~$110M in Q4; CCF covers ~93% of remaining milestone obligations

AI IconMarket Outlook

  • Full-year 2026: raise outlook for consolidated operating income to modestly exceed 2025 level; Ocean operating income expected to modestly exceed prior year; Logistics operating income to approach prior year
  • Full-year fuel recovery: fully recover fuel costs by end of 2026; most recovery in third quarter
  • Q2 2026: expect Ocean Transportation operating income approx. $20M above Q2 2025; consolidated operating income approx. $20M above prior year (net of fuel lag impact)
  • China service container volume: full-year 2026 expected moderately higher than 2025, reflecting demand strength continuing through peak season
  • Peak pattern reference: expect demand to remain busy until the traditional first/second week of October tied to the next Lunar New Year period

AI IconRisks & Headwinds

  • Fuel price volatility from Iran conflict: near-term earnings impacted by timing lag between incurred fuel cost and recovery via fuel surcharge; Q2 negative impact expected from lag (margin erosion not expected overall)
  • Tariff/shock risk: potential dislocation or reenacted tariffs could disrupt consumer demand or direct trade relationships; Q2 and guidance rely on absence of shocks
  • Hawaii demand softness: container volume -5.6% YOY in Q1; tourism remains soft with international tourism still weak
  • Competitive effects: competitor vessel dry-docking in prior-year period contributed to Hawaii -5.6% YOY; ongoing competitive dynamics may influence volumes
  • Logistics margin pressure: Q1 Logistics decline tied to lower supply chain management contribution; brokerage and market softness cited as ongoing sensitivity

Q&A: Analyst Interest

  • Topic: China capacity/utilization and peak-season ship loading (Q3 focus). Management: confirmed a “more traditional cycle” in China trades after Lunar New Year. They expect full or nearly full ships in the second and third quarters, then remain busy through the traditional first/second week of October, ending above last year’s peak performance.
  • Topic: Air-to-ocean conversion and whether fuel/jet scarcity accelerates expedited demand. Management: said customers are showing increased air-to-ocean conversion, partly temporary and partly structural. They noted dislocation in air markets from energy price/availability issues and that ~50% of air freight rides in passenger bellies; however, they deem it a tailwind, not a huge catalyst.
  • Topic: Quantifying the fuel lag headwind and “true pass-through” vs over-recovery. Management: avoided a point-specific number due to volatility, emphasizing visibility for Q2 as “under collection.” They reiterated confidence in full-year fuel recovery without margin erosion. Management also clarified scrubber-related items (when applicable) fall into the overall fuel recovery basket.

Sentiment: MIXED

Note: This summary was synthesized by AI from the MATX Q1 2026 earnings transcript. Financial data is complex; please verify all metrics against official SEC filings before making investment decisions.

📋 Official Regulatory 10-K / 10-Q SEC Filings

Direct authenticated documentation links to audited SEC database reports for MATX.

SEC EDGAR Live Feed
Loading financial data and tables...
📁

SEC Filings (MATX)

© 2026 Stock Market Info — Matson, Inc. (MATX) Financial Profile