Myers Industries, Inc.

Myers Industries, Inc. (MYE) Market Cap

Myers Industries, Inc. has a market capitalization of $787.8M.

Financials based on reported quarter end 2025-12-31

Price: $21.06

-0.28 (-1.31%)

Market Cap: 787.81M

NYSE · time unavailable

CEO: Aaron Schapper

Sector: Consumer Cyclical

Industry: Packaging & Containers

IPO Date: 1980-03-17

Website: https://www.myersindustries.com

Myers Industries, Inc. (MYE) - Company Information

Market Cap: 787.81M · Sector: Consumer Cyclical

Myers Industries, Inc. engages in distribution of tire service supplies in Ohio. It operates through The Material Handling and Distribution segments. The Material Handling segment offers pallets, small parts bins, bulk shipping containers, OEM parts, storage, organization, and custom plastic products; injection molded, rotationally molded or blow molded products, consumer fuel containers and tanks for water, fuel, and waste handling. It serves industrial manufacturing, food processing, retail/wholesale products distribution, agriculture, automotive, recreational, and marine vehicles, healthcare, appliance, bakery, electronics, textiles, consumer markets, and other markets under Akro-Mils, Jamco, Buckhorn, Ameri-Kart, Scepter, Elkhart Plastics, and Trilogy Plastics brands directly, as well as through distributors. The Distribution segment engages in the distribution of tools, equipment, and supplies for tire, wheel, and undervehicle service on passenger, heavy truck, and off-road vehicles; and manufacture and sale of tire repair materials and custom rubber products, as well as reflective highway marking tapes. This segment serves retail and truck tire dealers, commercial auto and truck fleets, auto dealers, general service and repair centers, tire re-treaders, truck stop operations, and government agencies. The company was founded in 1933 and is headquartered in Akron, Ohio.

Analyst Sentiment

71%
Strong Buy

Based on 8 ratings

Analyst 1Y Forecast: $23.50

Average target (based on 2 sources)

Consensus Price Target

Low

$26

Median

$26

High

$26

Average

$26

Potential Upside: 23.5%

Price & Moving Averages

Loading chart...

📘 Full Research Report

ℹ️

AI-Generated Research: This report is for informational purposes only.

📘 MYERS INDUSTRIES INC (MYE) — Investment Overview

🧩 Business Model Overview
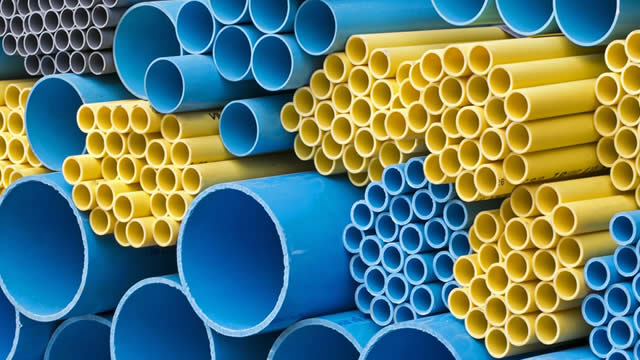
MYERS INDUSTRIES is an industrial manufacturer serving customers that require durable, mission-critical products and support for applications where reliability matters. The business is organized around engineered solutions and industrial components that move through a typical industrial value chain: (1) product design/engineering and component sourcing, (2) manufacturing and assembly with quality controls suited to end-use performance requirements, and (3) distribution to end markets where buyers value product qualification, documentation, and service responsiveness.

Customer stickiness is driven by specifications, application fit, and installation practices that do not change quickly. Once a product is selected and installed into an operating environment, switching typically requires requalification, engineering time, and potential downtime—creating a structural barrier to frequent replacement.

💰 Revenue Streams & Monetisation Model

Revenue is primarily transaction-based (sales of manufactured products), but the economics are supported by repeat purchase behavior and aftermarket demand in end markets where equipment lifespan and maintenance cycles are long. Monetisation is influenced by a mix of:

  • Engineered product sales where value is tied to performance, compliance, and application-specific requirements.
  • Operational execution that determines gross margin through manufacturing efficiency, procurement discipline, and yield.
  • Customer qualification and order conversion that translate design wins into durable order backlogs.

Margin drivers are typically linked to product mix (higher-spec offerings tend to command better pricing), supply chain stability (component availability and cost), and operating leverage from fixed manufacturing costs. In this model, disciplined cost control and quality reduce warranty/returns and improve conversion rates for future projects.

🧠 Competitive Advantages & Market Positioning

The most relevant moat is switching costs, reinforced by durability of qualification and operational integration in customers’ systems. Competitors face difficulty capturing share because buyers often select suppliers during a qualification process that includes engineering review, documentation, and performance verification. After installation, changing suppliers typically triggers engineering reassessment, redesign risk, and scheduling disruption.

Additional defensibility comes from manufacturing know-how and quality systems, where consistency and traceability matter. In industrial categories, reliability and compliance can be as important as unit price, and that shifts competitive advantage toward suppliers with proven execution, lead-time performance, and stable production capability.

🚀 Multi-Year Growth Drivers

Over a 5–10 year horizon, growth is typically supported by a combination of demand replacement cycles and incremental capacity additions in industrial end markets. Key drivers to underwrite include:

  • Infrastructure and industrial capex: expansion of facilities, upgrades to older equipment, and retrofit programs that refresh installed bases.
  • Reliability and performance requirements: applications where downtime or underperformance is costly tend to favor qualified suppliers and engineered solutions.
  • Lifecycle replacement and maintenance cycles: longer-lived industrial equipment creates steady demand for replacements and parts tied to operating uptime.
  • Product/engineering depth: expansion of addressable categories through design capabilities that can support adjacent applications without fully restarting qualification at the customer level.

The investment case is strongest when new product introductions translate into design wins, and when the company sustains manufacturing capability and customer service levels that preserve qualification momentum.

⚠ Risk Factors to Monitor

  • Customer concentration and project timing: industrial sales can be lumpy, driven by customer spending cycles and project schedules.
  • Input cost and supply chain volatility: raw materials, components, and logistics can pressure margins without offsetting pricing power.
  • Competition and pricing pressure: incumbents can face bids from established competitors or lower-cost entrants, particularly when project schedules tighten.
  • Quality or compliance execution risk: defects or failures can lead to returns, remediation costs, and longer qualification timelines going forward.
  • Capital intensity and capacity utilization: fixed costs create sensitivity to underutilization in downturns.

A structural risk would be a shift in customer technology preferences that reduces the relevance of legacy product categories or accelerates replacement cycles—mitigated to the extent the company’s engineering roadmap keeps pace with end-market requirements.

📊 Valuation & Market View

Market participants often frame valuation for industrial manufacturers through EV/EBITDA and cash flow-based multiples, with emphasis on margin durability and return of capital potential. While sector-level multiples can vary, the drivers that typically move valuation include:

  • Gross margin structure (mix, pricing discipline, and manufacturing efficiency).
  • Operating leverage as volumes recover or remain stable.
  • Working capital discipline tied to inventory management and receivables.
  • Evidence of design-win pipeline and backlog conversion quality.

A credible valuation approach focuses less on short-term accounting metrics and more on sustainable earnings power: normalized margins, reinvestment needs, and cash conversion through the cycle.

🔍 Investment Takeaway

MYERS INDUSTRIES is positioned in a value chain where qualification, reliability requirements, and application fit create switching costs. The long-term thesis rests on converting engineering credibility into repeatable sales through industrial lifecycle demand, while sustaining manufacturing execution to protect margins and cash generation. The core underwriting question is whether the company can maintain competitive differentiation and qualification momentum across end-market cycles, limiting price erosion and preserving durable earnings power.


⚠ AI-generated — informational only. Validate using filings before investing.

Fundamentals Overview

Loading fundamentals overview...

📊 AI Financial Analysis

Powered by StockMarketInfo
Earnings Data: Q Ending 2025-12-31

"MYE reported revenue of $203.97M and a net income of $11.33M for the year ending December 31, 2025. Earnings per share (EPS) stand at $0.30. Operating cash flow was $22.56M, with free cash flow at $18.94M after accounting for capital expenditures. The company pays dividends, distributing approximately $5.06M for the financial year, at a rate of $0.135 per share quarterly. Total assets are $851.32M, with total liabilities at $557.10M, resulting in total equity of $294.23M and net debt of $333.62M. The market price is currently $21.20, reflecting a significant one-year gain of 73.63%, indicating strong market performance and potential investor confidence. MYE's leverage ratio appears manageable, and the company has successfully generated positive cash flow, supporting future operations. Analyst sentiment indicates a consensus target price of $26, which suggests potential upside from the current trading price."

Revenue Growth

Positive

Healthy revenue growth year-over-year indicating positive market traction.

Profitability

Neutral

Positive net income and EPS reflect sound profitability metrics.

Cash Flow Quality

Good

Strong operating cash flow provides a solid foundation for investment.

Leverage & Balance Sheet

Positive

Manageable debt levels relative to total assets and equity bolster financial stability.

Shareholder Returns

Good

Robust price appreciation coupled with consistent dividends yields strong returns to shareholders.

Analyst Sentiment & Valuation

Good

Positive analyst outlook with stable target price presents potential for valuation upside.

Disclaimer:This analysis is AI-generated for informational purposes only. Accuracy is not guaranteed and this does not constitute financial advice.

Management is clearly pleased with transformation progress: Q4 adjusted operating margin expanded +230 bps to 11%, adjusted EPS rose +63% YoY, and full-year free cash flow increased +23% to $67.2M, alongside a $44.2M net debt reduction (net leverage 2.4x). They also highlight “moderate growth” in industrial and “strong growth” in infrastructure (largest-ever matting backlog). However, the Q&A reveals key operational and timing uncertainties that limit conviction. On mix/capacity, they concede Q4 profitability benefited from good mix, matting backlog tailwinds, and even a “slight pickup” in roto volumes after restructuring—yet they refuse to assume a new baseline (notably, they point to ongoing resin-price risk). On costs, they do not provide incremental 2026 savings figures, explaining carry-forward depends on MTS/distribution sale timing and split between RemainCo vs disposed businesses. Overall tone is encouraging, but analyst pressure focuses on sustainability and quantification—areas management stays non-committal.

AI IconGrowth Catalysts

  • Material Handling: industrial and infrastructure growth (food & beverage and consumer/vehicle demand soft offset)
  • Backlog strength in Infrastructure matting products (described as largest in history of the business)
  • Defense/military replenishment driving increased demand for ammunition-related products
  • Potential volume absorption tailwind on idled rotational molding (slight pickup in Q4 volumes on roto side after restructuring)

Business Development

  • Defense customer sets: direct U.S. military sales and NATO (European/international) customer set; supply chain coverage via Canadian operations (NATO dovetail) and U.S. injection molding (U.S. government)

AI IconFinancial Highlights

  • Q4 net sales: $204M, essentially flat YoY; excluding exit/idling of 2 rotational molding facilities, sales would have been up 3%
  • Q4 adjusted gross margin: +140 bps to 33.6% (favorable mix + higher volume; partially offset by unfavorable price)
  • Q4 adjusted operating margin: +230 bps to 11% (SG&A lower YoY from focused transformation savings)
  • Q4 adjusted EPS: +63% YoY
  • Full-year 2025 net sales: $825.7M, -1.3% YoY; excluding exit/idling, sales would have been -0.6%
  • Full-year adjusted gross margin: +30 bps to 33.7% (lower material costs, favorable cost productivity, favorable mix)
  • Full-year adjusted operating margin: +30 bps to 10.3% (benefits from focused transformation program)
  • Q4 adjusted EBITDA margin: 25.6%, +290 bps (focused transformation savings + improved mix/higher volume; partially offset by unfavorable pricing)
  • Distribution segment adjusted EBITDA margin: +160 bps (on +0.9% net sales)
  • Q4 free cash flow: $18.9M (operating cash flow $22.6M; CapEx $3.6M)
  • Full-year free cash flow: +23% to $67.2M
  • Leverage: net debt reduced by $44.2M in 2025; net leverage ratio 2.4x (target range 1.5x to 2.5x)
  • Portfolio actions: exit low-margin products and idle 2 of 9 rotational molding facilities (Q4 impact noted as ~$5M revenue per quarter, primarily industrial and consumer; favorable impact to earnings)

AI IconCapital Funding

  • 2025 CapEx: $19.6M (~2.4% of sales)
  • 2026 CapEx expectation: close to 3% of sales (target level)
  • Shareholder returns: $23M returned in 2025 via dividends and share repurchases
  • 2026 leverage plan: further reduce debt to move net leverage ratio closer to midpoint of 1.5x–2.5x target range
  • Liquidity: ended year with cash balance $45.1M and total liquidity $289.8M

AI IconStrategy & Ops

  • Focused transformation program (4 objectives) and 2026 evolution into 3 strategic priorities (core markets/customer value; operational excellence/cost leadership; profitable growth investments)
  • Annualized cost savings: $20M in 2025 primarily in SG&A
  • Structural cost/actions: idled 2 rotational molding facilities and exited low-margin products
  • Implemented a strategic deployment tool for disciplined planning and annual objectives (being rolled out across all levels)
  • Operational/cost standardization goal for 2026: make improvements repeatable year after year; optimize operating footprint when needed

AI IconMarket Outlook

  • No automotive aftermarket outlook provided due to planned divestiture of MTS
  • MTS expected to qualify for discontinued operations treatment beginning in Q1 (timing stated explicitly)
  • Industrial: expect moderate growth; citing modest recovery in manufacturing capex; militaries replenishing inventory and increased demand for military products
  • Infrastructure: expect strong growth supported by conversion from wood to composite matting; backlog for matting products described as largest in history
  • Vehicle: overall stable; RV and marine flat; commercial vehicles recovery starting in 2H 2026; automotive OEM demand tied to volume of new/updated vehicle program launches over next 12–18 months
  • Consumer: now anticipate sales stable
  • Winter storm impacts: planning for average of 3 landed storms in the Continental U.S. in 2026 (sharp demand increase for fuel containers noted for Q1; full-year impact too early to determine)

AI IconRisks & Headwinds

  • Macro/geopolitical: continued monitoring of geopolitical conditions including energy markets and tariffs/other factors influencing demand trends (no quantitative tariff impact provided in transcript)
  • Operational/inputs: continued need to adapt to risk/material costs including resin prices (explicitly raised in Q&A)
  • Inflation/price pressure: Q4 adjusted gross margin improvement partially offset by unfavorable price
  • Working capital: working capital as % of sales increased slightly due to higher receivables from infrastructure project delivery timing (partially offset by lower inventory)
  • MTS divestiture timing uncertainty: incremental carry-forward of 2025 cost savings into RemainCo depends on timing/structure of the sale (no numbers provided)

Sentiment: MIXED

Note: This summary was synthesized by AI from the MYE Q4 2025 earnings transcript. Financial data is complex; please verify all metrics against official SEC filings before making investment decisions.

Loading financial data and tables...
📁

SEC Filings (MYE)

© 2026 Stock Market Info — Myers Industries, Inc. (MYE) Financial Profile