Ingevity Corporation

Ingevity Corporation (NGVT) Market Cap

Ingevity Corporation has a market capitalization of $2.29B.

Price: $65.99

-0.10 (-0.15%)

Market Cap: 2.29B

NYSE · time unavailable

CEO: David H. Li

Sector: Basic Materials

Industry: Chemicals - Specialty

IPO Date: 2016-05-03

Website: https://www.ingevity.com

Ingevity Corporation (NGVT) - Company Information

Market Cap: 2.29B|Sector: Basic Materials

Company Profile

Ingevity Corporation manufactures and sells specialty chemicals and activated carbon materials in North America, the Asia Pacific, Europe, the Middle East, Africa, and South America. The company operates through two segments, Performance Materials and Performance Chemicals. The Performance Materials segment engineers, manufactures, and sells hardwood-based and chemically activated carbon products primarily for use in gasoline vapor emission control systems in cars, motorcycles, trucks, and boats. This segment also produces other activated carbon products for use in various applications, including food, water, beverage, and chemical purification. The Performance Chemicals segment comprises of pavement technologies, industrial specialties, and engineered polymers. It manufactures products derived from crude tall oil and lignin extracted from the kraft pulping process, as well as caprolactone monomers and derivatives derived from cyclohexanone and hydrogen peroxide. This segment's products are used in various applications comprising warm mix paving, pavement preservation, pavement reconstruction and recycling, oil well service additives, oil production, and downstream applications; and adhesives, agrochemical dispersants, lubricants, printing inks, industrial intermediates and oilfield, coatings, resins, elastomers, bioplastics, and medical devices. Ingevity Corporation was founded in 1964 and is headquartered in North Charleston, South Carolina.

Analyst Sentiment

79%
Strong Buy

From 4 Active Polls

1Y Forecast: $76.67

▲ +16.2% Potential Upside

Consensus Target Metrics

Low Bound

$65

Median

$82

High Bound

$83

Average

$77

Price & Moving Averages

Loading chart...

🎯 Wall Street Analyst Intelligence Report

1-Year structural target targets, chart projections, and sentiment maps.

Average 1Y Target
$76.67
▲ +16.18% Upside
Low Target
$65.00
-2% Risk
Median Target
$82.00
24% Mid
High Target
$83.00
26% Max
Consensus
Buy
10 / 13 Buys

Consensus Trend Projection

Trailing closures vs. 12-month metrics map.

Analyst Vote Distribution

Aggregate institutional coverage sentiment weights.

📊 Historical Valuation Multiples

Real-time Trailing Twelve Month (TTM) momentum side-by-side with discrete quarterly metrics.

Fiscal QuarterTTMQ1 2026Q4 2025Q3 2025Q2 2025Q1 2025Q4 2024Q3 2024Q2 2024
Period EndingTrailing 12MMar 31, 2026Dec 31, 2025Sep 30, 2025Jun 30, 2025Mar 31, 2025Dec 31, 2024Sep 30, 2024Jun 30, 2024
Market Cap ($M)2,2952,5142,1132,0031,5681,4411,4791,4171,533
Enterprise Value ($M)3,4443,6643,2773,2122,8672,8122,8662,8382,990
Price to Earnings Ratio (P/E)-18.2310.51-6.2411.51-2.6817.5722.28-3.31-1.35
Price/Earnings-to-Growth Ratio (PEG)9.25-0.09-0.09
Price to Sales Ratio (P/S)1.899.758.286.014.305.074.953.763.92
Price to Book Ratio (P/B)59.8864.6471.1414.5112.996.147.586.615.38
Price to Free Cash Flow Ratio (P/FCF)9.34-204.4228.7417.0123.4893.5837.3549.74132.12
Enterprise Value to Sales (EV/Sales)14.2012.859.647.859.909.597.537.65
Enterprise Value to EBITDA (EV/EBITDA)86.1039.95-53.9030.24-29.5338.7848.17-32.70-10.56
Debt to Equity Ratio28.7332.0041.849.3511.406.157.457.265.49

NGVT Growth Runway Model

Standard long term linear growth fade

Multi-Stage Discounted Cash Flow Sandbox

Market Price$65.99
Intrinsic Value$0.00
Market Alignment
Overvalued by 148.9%relative to calculated intrinsic value
9.00%
Exp: -3%-3%
i

Growth runway slowdown

This value provides a time window for the growth rate to decline beyond Stage 1 toward the terminal rate. Longer windows are most useful for companies with high growth starting conditions or strong competitive advantages. This option stretches out the growth rate slowdown across 5, 10, or 15-year steps. A high-growth starting condition (exceeding a 25% initial growth rate) automatically applies a curve decay to simulate realistic, rapid market saturation.
i

Terminal growth rate

With long-term inflation between 3-5%, revenue must grow by that baseline to maintain flat real-world market share. This value sets the permanent terminal growth rate to factor into the valuation beyond the growth slowdown runway toward maturity.

3-Stage Financial Runway Horizon

🧠 Perpetuity Horizon Engine (Stage 3: Post-2035)

Terminal FCF Base$0.02B
Perpetuity TV Value$0.33B
Discounted TV (PV)$0.14B
TV Weighting %56.3%
⚠️
Financial Model Disclaimer & Risk Disclosure: This interactive scenario simulator is an educational sandbox provided strictly for informational and analytical research purposes. Core historical financial statements and consensus estimates are sourced directly via Financial Modeling Prep (FMP). All downstream outputs are entirely deterministic, hypothetical projections generated by combining automated mathematical formulas (including linear interpolation and Gaussian bell-curve decay models) with user-selected variables and third-party financial data inputs. Users assume all liability for trading decisions executed based on these sandbox calculations.

📘 Full Research Report

ℹ️

AI-Generated Research: This report is for informational purposes only.

📘 INGEVITY CORP (NGVT) — Investment Overview

🧩 Business Model Overview

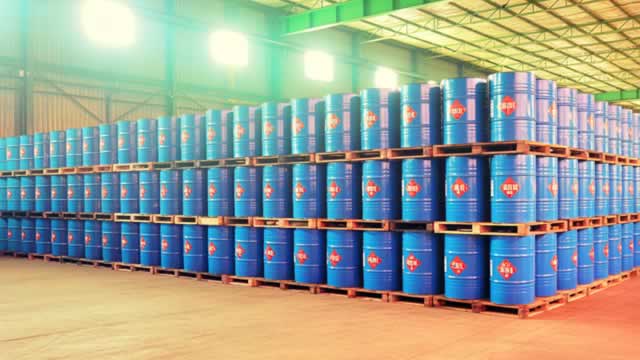
Ingevity produces engineered carbon-based materials—most notably activated carbon and related carbon products—used to remove contaminants from air, water, and fuel/engine systems. The core value chain is (1) securing carbon feedstocks, (2) processing them into activated/engineered carbon through thermal and surface-processing steps, and (3) supplying qualified grades tailored to specific end-use performance targets (capacity, adsorption kinetics, particle structure, and durability). Customers typically require technical validation and consistent quality, which shifts the relationship from “commodity purchasing” toward “specification and qualification.”

💰 Revenue Streams & Monetisation Model

Monetisation is largely volume-driven, with pricing and margin influenced by product mix (engineered grades command higher value than standard commodity-like offerings) and by how pricing mechanisms relate to feedstock and energy costs. Revenue is generally monetised through:

  • Engineered activated carbon and specialty carbon products sold into environmental and transportation end-markets.
  • Project and qualification-linked supply where product performance requirements and regulatory compliance create long qualification cycles.
  • Process-efficiency and scale benefits that translate into margins when plants run at productive utilization and conversion yields remain strong.

Key margin drivers include conversion efficiency, plant utilization, manufacturing reliability, product mix (engineered vs. more commoditized grades), and the degree to which contracts and market pricing allow pass-through or mitigation of feedstock and energy volatility.

🧠 Competitive Advantages & Market Positioning

Ingevity’s moat is best characterized as a combination of technical performance qualification (switching costs) and operational cost and supply advantages tied to carbon feedstock and processing capabilities. Competitors can replicate broad activated carbon chemistry, but earning and maintaining customer qualification for specific engineered performance is materially harder.

  • Switching costs (hard-to-requalify specs): Many applications require specific adsorption capacity, kinetics, and physical properties. Changing suppliers can trigger re-testing, engineering redesign, and warranty/performance risk—raising friction and cost for customers.
  • Cost and supply execution (materials processing know-how): Carbon markets are sensitive to feedstock and energy. Competitive advantage tends to concentrate in operators that manage feedstock sourcing, conversion yield, and plant uptime efficiently.
  • End-market focus: Ingevity’s emphasis on transportation and environmental solutions aligns product development with regulatory-driven adsorption and emissions requirements.

COMPETITIVE BENCHMARKING

  • Cabot Corporation: Cabot is diversified across carbon and specialty materials with broader technology and end-market reach; its advantage often comes from wide product platforms and cross-portfolio chemistry capabilities.
  • Calgon Carbon (market participants historically include Calgon Carbon): Focuses heavily on activated carbon for water and air purification systems; competition often centers on delivered performance, re-bid cycles, and system integration relationships.
  • Haycarb (and other activated carbon producers in the global market): Competes via cost and supply reach in carbon adsorption products, with emphasis on breadth of product offerings and sourcing economics.

In contrast to these rivals, Ingevity’s positioning emphasizes engineered performance and application-specific qualification in transportation and environmental segments, which tends to favor incumbents with demonstrated manufacturing consistency and technical support rather than purely lowest-cost commodity supply.

🚀 Multi-Year Growth Drivers

Over a 5–10 year horizon, growth is supported by secular demand for contaminant removal and emissions control rather than by consumer-driven end markets. Primary drivers include:

  • Regulatory tightening in air and fuel emissions: More stringent requirements for vapor control, particulate/odor management, and pollutant capture expand the addressable market for adsorption media.
  • Water treatment and industrial purification expansion: Continued investment in treatment infrastructure, plus increased industrial contamination controls, supports demand for activated carbon performance grades.
  • Emerging contaminant focus (adsorption media): Rising attention to hard-to-remove contaminants increases the value placed on adsorption capacity and engineered surface performance.
  • Transportation application complexity: Engine and fuel-system evaporative emissions rules sustain demand for engineered carbon solutions that require reliable supply and qualification.

TAM expansion is reinforced by the fact that many activated carbon applications are specification-based—growth depends not only on “tons,” but on qualified performance that supports recurring replacement cycles within installed systems.

⚠ Risk Factors to Monitor

  • Feedstock and energy volatility: Carbon feedstocks can be exposed to refined-product market dynamics; margin can compress if pricing does not offset cost movements.
  • Industry capacity additions: New capacity can increase competition and pressure pricing during periods of imbalance.
  • Customer qualification and technology substitution: Even when activated carbon remains favored, customers may pursue alternative adsorption chemistries, membranes, or system-level changes that reduce demand for certain grades.
  • Environmental and permitting risk: Manufacturing operations face ongoing compliance requirements that can elevate costs or constrain output.
  • Customer concentration and contract structure: Shifts in procurement strategies or contract terms can affect volume and pricing power.

📊 Valuation & Market View

Markets generally value activated carbon and specialty materials producers using EV/EBITDA and cash-flow metrics, supplemented by indicators such as operating margin durability and utilization. For this sector, the valuation multiple typically responds to:

  • Structural margin profile: Evidence of sustainable operating margins driven by engineered mix and operational execution.
  • Pricing power vs. input costs: The extent to which contracts and market pricing pass through or absorb feedstock/energy changes.
  • Capital intensity and return on invested capital: Material producers are sensitive to maintenance capex needs and the returns on growth or debottlenecking projects.
  • Downcycle sensitivity: How quickly earnings normalize when demand weakens and pricing compresses.

Investors should view valuation not as a standalone number, but as a function of normalized EBITDA capacity, cycle positioning, and the credibility of margin defense through engineered specifications and operational cost control.

🔍 Investment Takeaway

Ingevity’s long-term investment case rests on specification-driven switching costs, operational execution in converting cost-sensitive carbon feedstocks into engineered adsorption performance, and exposure to regulatory and infrastructure-driven demand across transportation and environmental end markets. The central question for underwriting is whether the company can sustain engineered product mix and cost control through commodity volatility and capacity cycles—thereby preserving cash generation over a full cycle.


⚠ AI-generated — informational only. Validate using filings before investing.

📰 Market News & Coverage

15 Stories Available

Real-time institutional reporting and market updates for NGVT.

zacks.com2026-06-05

Why Is Ingevity (NGVT) Down 10.8% Since Last Earnings Report?

Ingevity (NGVT) reported earnings 30 days ago. What's next for the stock?

marketbeat.com2026-05-13

Ingevity Q1 Earnings Call Highlights

Ingevity NYSE: NGVT reported higher first-quarter 2026 sales and reaffirmed its full-year outlook as management highlighted progress on portfolio simplification, strong margins in its Performance Materials business and continued share repurchases.

zacks.com2026-05-12

NGVT Q1 Earnings Top Estimates on Pricing and FX Tailwinds

Ingevity beats Q1 estimates as pricing actions and FX gains lift sales and earnings, despite weakness in Road Markings and lower asset utilization.

seekingalpha.com2026-05-07

Ingevity Corporation (NGVT) Q1 2026 Earnings Call Transcript

Ingevity Corporation (NGVT) Q1 2026 Earnings Call Transcript

zacks.com2026-05-06

Ingevity (NGVT) Beats Q1 Earnings and Revenue Estimates

Ingevity (NGVT) came out with quarterly earnings of $1.15 per share, beating the Zacks Consensus Estimate of $0.84 per share. This compares to earnings of $0.99 per share a year ago.

businesswire.com2026-05-06

Ingevity reports first quarter 2026 financial results

NORTH CHARLESTON, S.C.--(BUSINESS WIRE)-- #ingevity--Ingevity reports first quarter 2026 financial results.

defenseworld.net2026-04-27

Head to Head Review: Ingevity (NYSE:NGVT) and Mativ (NYSE:MATV)

Ingevity (NYSE: NGVT - Get Free Report) and Mativ (NYSE: MATV - Get Free Report) are both basic materials companies, but which is the superior stock? We will compare the two businesses based on the strength of their risk, institutional ownership, earnings, dividends, analyst recommendations, valuation and profitability. Insider and Institutional Ownership 91.6% of Ingevity shares are

zacks.com2026-04-16

NGVT Sells Ozark Materials to PPG to Streamline Core Operations

Ingevity sells its Ozark Materials unit to PPG for $65M, aiming to streamline operations and refocus on higher-margin growth segments.

businesswire.com2026-04-15

Ingevity announces sale of Ozark Materials road markings business to PPG, strengthening strategic focus

NORTH CHARLESTON, S.C.--(BUSINESS WIRE)-- #ingevity--Ingevity has signed a definitive agreement and has successfully closed on the sale of its Ozark Materials road markings business to PPG.

businesswire.com2026-04-15

PPG acquires pavement markings manufacturer Ozark Materials, LLC

PITTSBURGH--(BUSINESS WIRE)--PPG (NYSE:PPG) today announced that it has completed the acquisition of Ozark Materials, LLC, a U.S.-based provider of pavement marking solutions, from Ingevity Corporation (NYSE:NGVT). The all-cash transaction includes a purchase price of $65 million, subject to customary adjustments. Ozark Materials serves customers across the United States and Canada and has a strong reputation for quality, service and operational excellence. The company has approximately 130 emp.

businesswire.com2026-04-08

Ingevity announces dates for first quarter 2026 earnings release and webcast

NORTH CHARLESTON, S.C.--(BUSINESS WIRE)-- #ingevity--Ingevity announced today that it will release its first quarter 2026 earnings after the stock market close on Wednesday, May 6, 2026.

defenseworld.net2026-04-06

Allspring Global Investments Holdings LLC Buys Shares of 134,517 Ingevity Corporation $NGVT

Allspring Global Investments Holdings LLC bought a new stake in Ingevity Corporation (NYSE: NGVT) during the undefined quarter, according to the company in its most recent 13F filing with the Securities and Exchange Commission. The firm bought 134,517 shares of the company's stock, valued at approximately $8,083,000. Allspring Global Investments Holdings LLC owned

defenseworld.net2026-04-01

Ingevity (NYSE:NGVT) Stock Price Crosses Above 50 Day Moving Average – Should You Sell?

Ingevity Corporation (NYSE: NGVT - Get Free Report) shares crossed above its 50 day moving average during trading on Tuesday. The stock has a 50 day moving average of $69.54 and traded as high as $72.74. Ingevity shares last traded at $71.3510, with a volume of 357,713 shares trading hands. Wall Street Analyst Weigh In

zacks.com2026-03-27

Why Is Ingevity (NGVT) Up 1.2% Since Last Earnings Report?

Ingevity (NGVT) reported earnings 30 days ago. What's next for the stock?

defenseworld.net2026-03-23

Ingevity Corporation (NYSE:NGVT) Receives Consensus Rating of “Hold” from Analysts

Shares of Ingevity Corporation (NYSE: NGVT - Get Free Report) have been given a consensus rating of "Hold" by the five brokerages that are currently covering the company, Marketbeat Ratings reports. One equities research analyst has rated the stock with a sell recommendation, two have assigned a hold recommendation and two have issued a buy recommendation

📊 AI Financial Analysis

Powered by StockMarketInfo
Earnings Data: Q Ending 2026-03-31

"NGVT reported Q1’26 revenue of $258.0M and net income of $59.8M (EPS $1.70, diluted $1.66). YoY, revenue declined (Q1’26 $258.0M vs Q1’25 $284.0M: -9.2%), while net income surged (Q1’26 $59.8M vs Q1’25 $20.5M: +191.8%). QoQ, revenue rose slightly (+1.1% vs Q4’25 $255.1M), and net income improved meaningfully (from -$84.6M in Q4’25 to +$59.8M in Q1’26). Profitability rebounded strongly: net margin expanded to 23.2% from -33.2% QoQ and 7.2% YoY; gross margin improved to 45.1% from 34.4% QoQ and 39.9% YoY. Cash flow quality was mixed. Operating cash flow was slightly negative (-$2.0M) in Q1’26, but free cash flow also remained negative (-$12.3M) after capex. Despite that, the quarter’s accounting earnings recovered sharply. On the balance sheet, liquidity improved (cash + cash equivalents rose to $95.4M), while leverage remained high with substantial debt (total debt ~$1.20B) and very thin equity ($38.9M), implying limited balance-sheet resilience. Shareholder returns look strong: the stock is up ~142% over 1 year with 0% dividend yield indicated, so total return is primarily capital appreciation. Analyst targets (consensus ~$76.7 vs price $75.2) suggest the stock is near consensus value."

Revenue Growth

Fair

Revenue was roughly flat QoQ (+1.1%, $255.1M in Q4’25 to $258.0M in Q1’26) but down YoY (-9.2%, $284.0M in Q1’25 to $258.0M).

Profitability

Good

Net income rose sharply YoY (+191.8%) and improved from a loss QoQ (-$84.6M to +$59.8M). Net margin expanded to 23.2% from -33.2% QoQ and 7.2% YoY; gross margin also improved (45.1% vs 34.4% QoQ).

Cash Flow Quality

Caution

Operating cash flow was negative in Q1’26 (-$2.0M) versus strongly positive Q4’25 (+$97.1M) and Q3’25 (+$129.7M). Free cash flow was also negative (-$12.3M), indicating weaker conversion despite earnings recovery.

Leverage & Balance Sheet

Caution

Balance sheet shows very thin equity ($38.9M) against large total assets ($1.65B) and high debt (total debt ~$1.20B, net debt ~$1.11B). Interest coverage improved to ~1.47x, but leverage remains a key risk.

Shareholder Returns

Strong

Total shareholder return is strongly supported by capital appreciation: price is up +142% over 1 year (>20% momentum). Dividend yield is 0% per provided ratios/fields; buybacks are implied (repurchased stock -$52.3M in Q1’26).

Analyst Sentiment & Valuation

Positive

Consensus target (~$76.67) is slightly above the current price (~$75.2), suggesting limited near-term upside vs strong recent momentum. Valuation multiples provided appear difficult to interpret given volatile cash flow (e.g., negative price/FCF).

Disclaimer:This analysis is AI-generated for informational purposes only. Accuracy is not guaranteed and this does not constitute financial advice.

Fundamentals Overview

Loading fundamentals overview...

NGVT delivered solid top-line growth in Q1 2026 (+4% sales to $258m) and improved diluted adjusted EPS to $1.15 (+14% YoY) despite margin pressure at the consolidated level. Adjusted EBITDA was flat at $92m while adjusted EBITDA margin declined 130 bps to 35.5% (Road Markings utilization and APT utilization headwinds offset pricing benefits). Performance Materials showed true operating strength: EBITDA margin expanded ~200 bps to 59% and management expects the Q1 inventory-build benefit to reverse in Q2. Free cash flow was negative ($12m) due to seasonal mix and inventory build for outages, but management accelerated $52m of buybacks using divestiture proceeds. Guidance was reaffirmed with 2026 adjusted EPS of $4.70–$5.20 and adjusted EBITDA of $370m–$395m, alongside continued leverage targeting (2.0x–2.5x) and $300m buybacks through 2027, with APT sale progress aimed for announcement before year-end.

AI IconGrowth Catalysts

  • Performance Materials: low-single-digit annual pricing actions plus mix shift toward hybrids (post-expiration of EV credits late Q3 prior year).
  • Pavement Technologies (ex Road Markings impact): pricing gains and improved mix; stable early Q2 demand trends.
  • APT: 5% sales growth supported by favorable foreign exchange and strong sequential volume growth led by Asia Pacific.

Business Development

  • Ozark Materials, Road Markings product line sold to PPG on April 15 in an all-cash transaction valued at approximately $65 million.
  • Industrial Specialties divestiture: North Charleston CTO refinery plus a majority of Industrial Specialties sold for approximately $93 million of net proceeds (announced in January; proceeds referenced in quarter).
  • APT sale process: ongoing transaction process with strong interest; management expects to announce something before end of 2026.

AI IconFinancial Highlights

  • Revenue (sales) grew 4% to $258 million, driven by annual price increases in Performance Materials and Pavement Technologies and favorable FX in APT.
  • GAAP net income: $23.4 million included ~$23 million pretax special charges; $16 million related to final litigation settlement payment to BASF.
  • Adjusted EBITDA: $92 million flat YoY; adjusted EBITDA margin fell to 35.5% from 36.8% (down 130 bps).
  • Adjusted gross margin: 51% (gross profit $132 million, up 4% YoY); management said margin expanded when removing inventory-build noise.
  • Diluted adjusted EPS: $1.15, up 14% YoY, helped by lower interest expense (lower borrowings) and reduced share count from repurchases.
  • Free cash flow: negative $12 million in Q1 2026, driven by inventory build for planned Q2 outage in Performance Materials and seasonal inventory buildup in Pavement Technologies.
  • Performance Materials segment: EBITDA margin expanded to 59% from 57% (+200 bps) with segment EBITDA up 10% to $92 million.
  • Pavement Technologies (incl Road Markings this quarter): Road Markings sales down 10% with EBITDA margin reduced to ~1% (decline driven by lower plant utilization; pricing stable).
  • APT segment: EBITDA margin 17.2%, down meaningfully YoY due to lower plant utilization versus last year’s inventory build prior to planned 2025 shutdown/boilers.

AI IconCapital Funding

  • Share repurchases: ~$52 million in Q1, repurchasing ~775,000 shares ahead of plan.
  • Remaining share repurchase authorization at quarter-end: ~$246 million.
  • Balance-sheet posture: net leverage target 2.0x to 2.5x; management reiterated derisking while remaining opportunistic on buybacks.
  • Free cash flow generation expectation: $215 million to $245 million in 2026 (used for continued buybacks per plan).
  • Guided share repurchase program: $300 million through 2027 (cash allocation framework reaffirmed).

AI IconStrategy & Ops

  • Portfolio simplification: completion of Road Markings product line sale to PPG (April 15) and prior Industrial Specialties refinery/product-line divestiture (net proceeds ~$93 million).
  • APt and segment naming: beginning next quarter, Performance Chemicals renamed to Pavement Technologies; Road Markings historical segment data not recast (not discontinued-ops criteria met).
  • Operational/cost management: Q1 included inventory builds ahead of planned Q2 outage; management expects reversal in Q2.
  • Cost pass-through: introduced surcharges in April in APT to offset higher raw material/energy costs tied to the Middle East conflict; passed through small raw-material and logistics cost upticks.

AI IconMarket Outlook

  • 2026 guidance reaffirmed (excludes Road Markings contributions starting April 15): adjusted EPS $4.70 to $5.20.
  • 2026 sales guidance: $1.05 billion to $1.15 billion.
  • 2026 adjusted EBITDA guidance: $370 million to $395 million.
  • Margin impact: excluding Road Markings expected to lift Performance Chemicals (Pavement Technologies) margin to high teens vs prior mid-teens projection.
  • Run-rate cost actions: eliminate $15 million of Industrial Specialties divestiture indirect costs by end of 2026.
  • 2026 free cash flow guidance: $215 million to $245 million; does not include ~ $113 million pretax litigation-related payments to BASF in Q2.
  • Leverage: expect to reach and maintain net leverage ratio of 2.0x to 2.5x this year.
  • Share repurchases: complete $300 million through 2027; management noted ~$15 million repurchased already in Q2 (as of call).
  • APT sale process timing: management expects to announce something before end of year.

AI IconRisks & Headwinds

  • APT competitive pressure and depressed end-market demand previously; Q1 still impacted by lower plant utilization (margin weakness) and prior-year tariff/weak demand headwinds.
  • Road Markings: ongoing competitive volume pressure (sales down 10%) and utilization-driven EBITDA decline (margin down to ~1%).
  • Middle East conflict affecting raw materials and energy costs; partially offset via surcharges but may pressure demand or cost base.
  • Working capital seasonality and inventory builds: free cash flow negative in Q1; uncertainty over elevated inventory levels if macro/operational disruptions recur.
  • BASF litigation payment overhang: ~$113 million pretax litigation-related payments expected in Q2 (excluded from 2026 FCF guidance).

Q&A: Analyst Interest

  • Hybrid adoption geographic scope: Management said hybrid shift is visible in North America due to modulation of pure EV adoption after subsidies decline, and expected to broaden globally. They cited China where government subsidy reductions have moderated pure EV adoption, increasing hybrids’ share and carbon content needs.
  • Inflation and pricing flexibility: Management described successful annual pricing increases in Performance Materials reflecting customer trust and value proposition; they also use surcharges in APT to offset energy/logistics and small raw-material/logistics cost inflation. They emphasized U.S. production focus and close customer relationships enabling pass-through.
  • APT divestiture progress and buyer tone: Management reiterated portfolio transformation and progress through multiple divestiture steps (one closed earlier, Road Markings signing close, APT remaining). They said interest is strong and remain confident about announcing something before year-end, without indicating buyers’ tone deteriorated.

Sentiment: MIXED

Note: This summary was synthesized by AI from the NGVT Q1 2026 (ended/first quarter; call dated 2026-05-07) earnings transcript. Financial data is complex; please verify all metrics against official SEC filings before making investment decisions.

📋 Official Regulatory 10-K / 10-Q SEC Filings

Direct authenticated documentation links to audited SEC database reports for NGVT.

SEC EDGAR Live Feed
Loading financial data and tables...
📁

SEC Filings (NGVT)

© 2026 Stock Market Info — Ingevity Corporation (NGVT) Financial Profile