Nucor Corporation

Nucor Corporation (NUE) Market Cap

Nucor Corporation has a market capitalization of $58.60B.

Price: $257.29

0.25 (0.10%)

Market Cap: 58.60B

NYSE · time unavailable

CEO: Leon J. Topalian

Sector: Basic Materials

Industry: Steel

IPO Date: 1980-03-17

Website: https://www.nucor.com

Nucor Corporation (NUE) - Company Information

Market Cap: 58.60B|Sector: Basic Materials

Company Profile

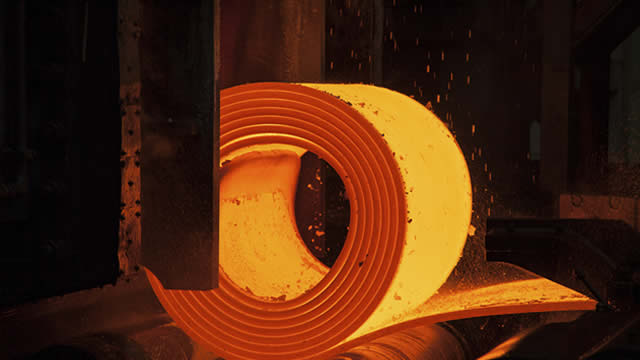
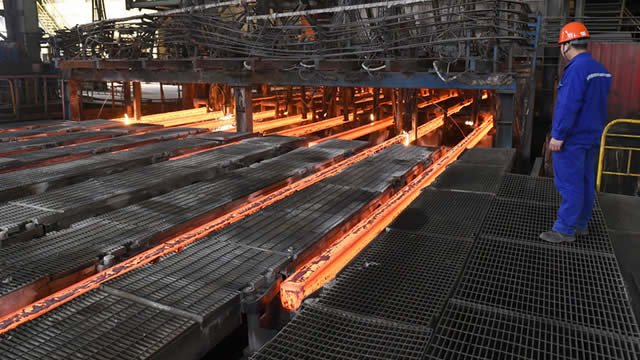
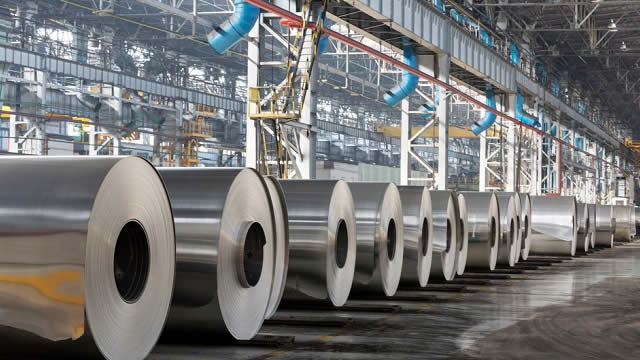
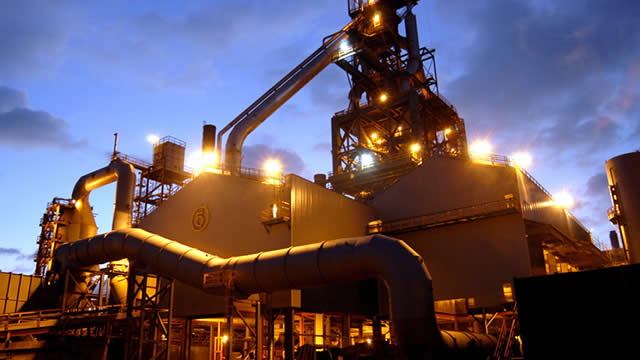
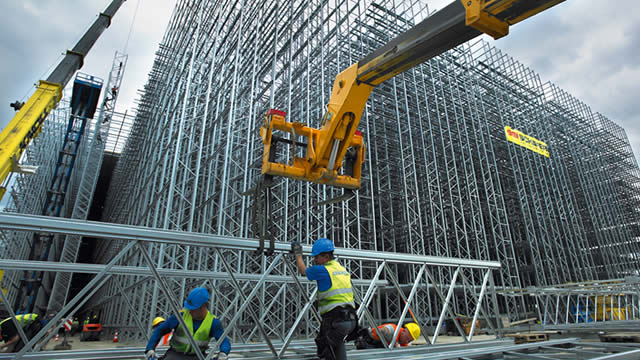
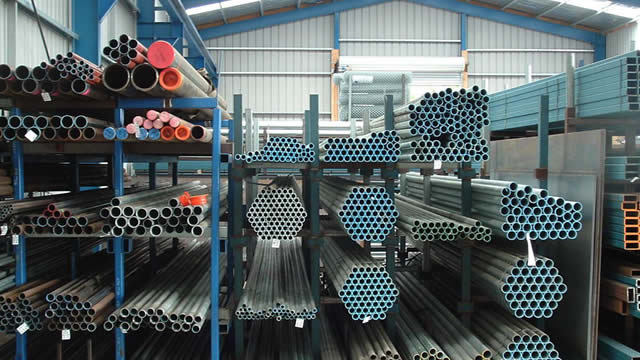
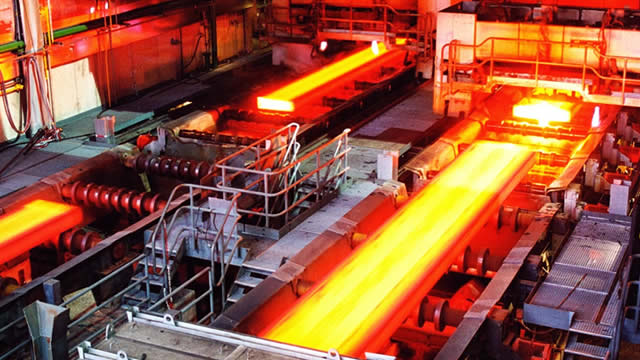
Nucor Corporation is a prominent producer and distributor of steel and diverse steel-related products. Within its Steel Mills division, the company manufactures a comprehensive range of steel goods. These include various sheet steel types like hot-rolled, cold-rolled, and galvanized, alongside plate steel. It also produces structural components such as wide-flange beams, beam blanks, H-piling, and sheet piling. Furthermore, this segment supplies bar steel products, encompassing blooms, billets, concrete reinforcing bars, merchant bars, and specialized bar quality items. Beyond manufacturing, Nucor's steel mills are involved in steel trading and the distribution of rebar. Its clientele primarily consists of steel service centers, fabricators, and manufacturers across the United States, Canada, and Mexico. The Steel Products segment provides an array of manufactured steel goods, such as hollow structural section tubing, electrical conduits, steel racking, joists and girders, steel decks, and fabricated concrete reinforcing steel. It also supplies cold finished steel, fasteners, complete metal building systems, insulated metal panels, steel grating, expanded metal, and various wire and wire mesh products. These offerings are largely directed towards nonresidential construction projects. Additionally, this segment manages a piling distribution operation. Nucor's Raw Materials division is responsible for producing direct reduced iron (DRI). It also acts as a broker for ferrous and nonferrous metals, pig iron, hot briquetted iron (HBI), and direct reduced iron (DRI). This segment supplies ferro-alloys, processes both ferrous and nonferrous scrap metals, and undertakes natural gas drilling activities. Its ferrous scrap is supplied to electric arc furnace steel mills and foundries for their manufacturing processes. Meanwhile, nonferrous scrap metal is sold to aluminum can manufacturers, secondary aluminum smelters, steel mills, various other processors, and direct consumers of diverse nonferrous metals. The corporation caters to a wide range of industries including agriculture, automotive, construction, energy and transmission, oil and gas, heavy equipment, infrastructure, and transportation. Sales are conducted via an in-house sales team and through the company's internal distribution and trading enterprises. Established in 1958, Nucor Corporation has its headquarters situated in Charlotte, North Carolina.

Analyst Sentiment

77%
Strong Buy

From 18 Active Polls

1Y Forecast: $267.50

▲ +4.0% Potential Upside

Consensus Target Metrics

Low Bound

$224

Median

$272

High Bound

$297

Average

$268

Price & Moving Averages

Loading chart...

🎯 Wall Street Analyst Intelligence Report

1-Year structural target targets, chart projections, and sentiment maps.

Average 1Y Target
$267.50
▲ +3.97% Upside
Low Target
$224.00
-13% Risk
Median Target
$272.00
6% Mid
High Target
$297.00
15% Max
Consensus
Buy
20 / 32 Buys

Consensus Trend Projection

Trailing closures vs. 12-month metrics map.

Analyst Vote Distribution

Aggregate institutional coverage sentiment weights.

📊 Historical Valuation Multiples

Real-time Trailing Twelve Month (TTM) momentum side-by-side with discrete quarterly metrics.

Fiscal QuarterTTMQ2 2026Q2 2026Q4 2025Q4 2025Q3 2025Q2 2025Q4 2024Q3 2024
Period EndingTrailing 12MJun 30, 2026Apr 4, 2026Dec 31, 2025Oct 4, 2025Jul 5, 2025Apr 5, 2025Dec 31, 2024Sep 28, 2024
Market Cap ($M)58,59550,83239,47637,40131,90131,79324,01927,31035,500
Enterprise Value ($M)63,21655,45344,37442,26236,53336,72828,74330,70238,176
Price to Earnings Ratio (P/E)20.5011.0313.3524.8613.1213.2138.5123.9235.75
Price/Earnings-to-Growth Ratio (PEG)1.160.5717.071.653.61
Price to Sales Ratio (P/S)1.624.894.164.873.743.763.073.864.77
Price to Book Ratio (P/B)2.662.301.841.791.541.561.201.351.73
Price to Free Cash Flow Ratio (P/FCF)37.0261.32175.45-12467.0459.96-143.21-48.52-187.3574.30
Enterprise Value to Sales (EV/Sales)5.334.675.504.294.343.674.345.13
Enterprise Value to EBITDA (EV/EBITDA)11.2227.4530.9047.4328.3627.9540.8338.3547.51
Debt to Equity Ratio0.820.320.330.340.330.340.390.340.34

📘 Full Research Report

ℹ️

AI-Generated Research: This report is for informational purposes only.

📘 NUCOR CORP (NUE) — Investment Overview

🧩 Business Model Overview

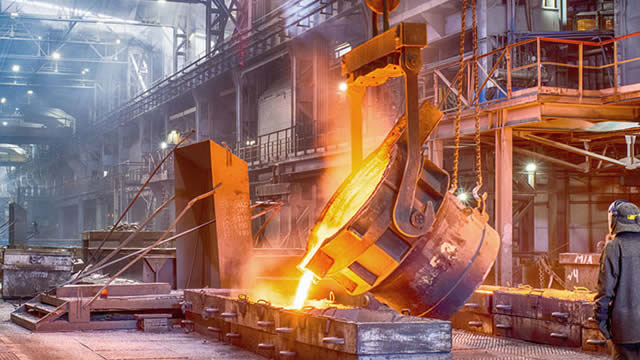
Nucor is a major U.S.-based steel producer with a business model centered on domestic, lower-cost steelmaking and fabrication. The value chain typically starts with steel inputs (primarily scrap and other raw materials), converted into molten steel via electric arc furnace (EAF) technology, followed by casting and further processing into flat-rolled products (e.g., sheet, plate, and related steel forms) and downstream steel products. Nucor sells into a broad set of end markets—construction, automotive, industrial manufacturing, and energy-related applications—where delivery reliability, product qualification, and spec compliance matter.

A key feature of the model is operational flexibility: minimill-based production can respond to market conditions through changes in product mix and operating rates, supported by a network of plants located to reduce logistics costs and to maintain access to supply chains.

💰 Revenue Streams & Monetisation Model

Revenue is predominantly transactional, generated by selling steel and steel products at market-reflective pricing. The main economic lever is the steel margin (steel spread), defined by the difference between selling prices for specific grades and the cost of steel inputs plus conversion and logistics costs.

Because steel demand and pricing are cyclical, Nucor’s monetisation model relies on earning margins during favorable market windows and preserving cost competitiveness during downturns. The primary margin drivers include:

  • Input economics: scrap-derived costs and the ability to source inputs at competitive prices relative to the realized price of finished steel.
  • Energy and conversion efficiency: EAF efficiency and plant-level operating discipline that affect variable costs per ton.
  • Product mix and yield: higher value-added grades and improved processing yield support margin resilience.
  • Logistics: proximity to customers and efficient distribution reduce per-unit freight and handling costs.

🧠 Competitive Advantages & Market Positioning

Nucor’s structural advantage is best characterized as a cost and operational moat, supported by minimill economics, logistics, and disciplined execution—rather than product branding or patent protection.

  • Cost advantage (Minimills / EAF efficiency): EAF-based steelmaking can be cost-competitive versus traditional blast furnace routes, especially when managed with scale, modern equipment, and robust operating practices.
  • Low-cost feedstock access (scrap sourcing): The company’s ability to procure scrap competitively and manage procurement logistics is a fundamental cost pillar. Scrap availability and pricing dynamics influence margins, but producers with more dependable supply and better procurement execution generally perform better across the cycle.
  • Geographic cost advantage & logistical infrastructure: Nucor’s manufacturing footprint in the U.S. reduces freight exposure versus more remote suppliers for key customer clusters. Shorter hauls and established distribution channels support delivered pricing competitiveness.
  • Practical switching constraints: While customers are not locked in by contracts like software platforms, steel supply relationships typically involve specification qualification, certifications, and ongoing production alignment. Requalifying suppliers is non-trivial, creating a degree of stickiness once a plant and product grade are established.

Competitive benchmarking: key competitors include:

  • Steel Dynamics (SDI): also operates U.S. minimill capacity, competing heavily on cost position and product breadth within similar end markets.
  • Commercial Metals (CMC): another EAF-based producer with emphasis on scrap-driven cost competitiveness, competing in many of the same regional and product segments.
  • Cleveland-Cliffs (CLF): a more integrated/asset-heavy participant with different cost drivers, competing through scale, feedstock exposure, and capacity structure.

Compared with these peers, Nucor’s positioning emphasizes operating discipline, a broad portfolio of steel products, and a U.S.-centric logistical footprint that supports delivered-cost advantages. Rivalry remains intense, but the differentiator for Nucor is sustained cost competitiveness across operating environments.

🚀 Multi-Year Growth Drivers

Steel demand in North America is influenced by long-cycle infrastructure activity, industrial maintenance, and durable investment cycles. Over a 5–10 year horizon, growth is driven less by “new” demand creation and more by how capacity and production share allocate across producers:

  • Domestic capacity and reshoring dynamics: Favorable industrial policy and supply-chain localization tend to support demand for domestically produced steel.
  • Increased use of steel in infrastructure and equipment renewal: The replacement cycle for roads, bridges, buildings, and industrial assets supports steady structural demand.
  • Minimill share gains and operational excellence: Continued evolution toward lower-cost, EAF-based production can shift market share toward producers with strong cost control and feedstock procurement.
  • End-market diversification within steel products: A diversified product set can moderate cyclicality by balancing exposure across building, industrial, and energy-related applications.
  • Decarbonisation pressure (execution-dependent): Environmental constraints increasingly favor producers that can adapt their technology roadmap and supply chain practices, creating an advantage for firms with credible capital planning and operational systems.

⚠ Risk Factors to Monitor

  • Cyclical commodity exposure: Steel prices and spreads fluctuate with global supply/demand, import pressure, and inventory behavior.
  • Input cost volatility: Scrap price movements, electricity costs, and availability of key inputs can compress margins unexpectedly.
  • Environmental and permitting costs: Emissions regulations, permitting timelines, and compliance capital needs can raise fixed and variable costs.
  • Trade policy and regulatory risk: Tariffs, antidumping/countervailing duties, and trade enforcement can materially impact import levels and pricing power.
  • Capital intensity and execution risk: Maintaining and upgrading capacity requires ongoing investment; execution quality determines cost competitiveness.
  • Execution and safety/quality: Steel manufacturing is operationally unforgiving; downtime, quality deviations, or disruptions can affect customer retention and delivered costs.

📊 Valuation & Market View

The market typically values steel producers on cash-flow and earnings power through the cycle, often using multiples such as EV/EBITDA and enterprise-value frameworks that normalize cyclicality. In practice, valuation sensitivity is driven by:

  • Steel spread and utilization: margins and operating rates that determine normalized free cash flow.
  • Cost position: the durability of low unit costs (energy efficiency, yield, labor productivity, and logistics).
  • Balance-sheet strength and capital allocation discipline: access to liquidity and the ability to fund maintenance capex and cycle-responsive spending.
  • Policy and trade environment: impacts on effective domestic supply and pricing dynamics.

Because steel is inherently cyclical, valuation tends to re-rate when expectations shift toward sustained cost leadership, improved spread durability, or a more favorable policy and demand backdrop.

🔍 Investment Takeaway

Nucor’s long-term investment case is anchored in a structural cost advantage—minimill/EAF operating economics, disciplined procurement of scrap inputs, and U.S. geographic/logistical efficiency—rather than durable pricing power from intangibles. The company’s performance profile is closely linked to steel spreads, but the moat is the ability to protect unit economics across cycles through execution and cost leadership. The primary debate for investors centers on how reliably Nucor can sustain cost competitiveness amid cyclical pressures, environmental requirements, and trade-related market structure.


⚠ AI-generated — informational only. Validate using filings before investing.

📰 Market News & Coverage

15 Stories Available

Real-time institutional reporting and market updates for NUE.

247wallst.com2026-07-31

What a $101.5 Billion Trade Deficit Really Means for Americans in 2026

America's shrinking trade deficit looks like good news until you trace who is actually winning and who is quietly absorbing the cost, and the answer shows up in steel mill records, empty freight trailers, and a consumer sentiment index near historic lows.

247wallst.com2026-07-31

Nucor Outshines Albemarle in Charlotte Stock Duel

Albemarle (NYSE:ALB | ALB Price Prediction) and Nucor (NYSE:NUE) both call Charlotte home, and both sell commodities the industrial economy cannot function without.

zacks.com2026-07-30

Here's Why Nucor (NUE) is a Strong Momentum Stock

The Zacks Style Scores offers investors a way to easily find top-rated stocks based on their investing style. Here's why you should take advantage.

zacks.com2026-07-29

NUE Q2 Earnings Call Highlights Growth Projects And Demand

Nucor highlights record steel mill shipments, major growth projects and a stronger second-half 2026 outlook as demand remains resilient.

investors.com2026-07-28

Dow Leaps In Mixed Stock Market Ahead Of Fed Decision; Nucor Jumps On Earnings, Nears Entry

The Dow Jones Industrial Average stands out Tuesday by soaring more than 500 points.

seekingalpha.com2026-07-28

Nucor Corporation (NUE) Q2 2026 Earnings Call Transcript

Nucor Corporation (NUE) Q2 2026 Earnings Call Transcript

marketbeat.com2026-07-28

Nucor Q2 Earnings Call Highlights

Nucor NYSE: NUE reported stronger second-quarter earnings as record steel mill shipments, higher selling prices and improved performance across all three operating segments lifted results above the midpoint of the company's guidance range.

zacks.com2026-07-28

Nucor's Q2 Earnings and Revenues Surpass Estimates on Higher Prices

NUE beat second-quarter earnings and sales estimates as higher prices and volumes lifted results, while it expects stronger consolidated earnings in Q3.

zacks.com2026-07-27

Compared to Estimates, Nucor (NUE) Q2 Earnings: A Look at Key Metrics

While the top- and bottom-line numbers for Nucor (NUE) give a sense of how the business performed in the quarter ended June 2026, it could be worth looking at how some of its key metrics compare to Wall Street estimates and year-ago values.

zacks.com2026-07-27

Nucor (NUE) Tops Q2 Earnings and Revenue Estimates

Nucor (NUE) came out with quarterly earnings of $4.84 per share, beating the Zacks Consensus Estimate of $4.57 per share. This compares to earnings of $2.6 per share a year ago.

benzinga.com2026-07-27

Nucor Shares Flat Despite Q2 Earnings Beat: Details

Nucor Corp. (NYSE:NUE) posted its second-quarter results after Monday's closing bell. Here's a look at the details inside the report.

prnewswire.com2026-07-27

Nucor Reports Results for the Second Quarter of 2026

Second Quarter of 2026 Highlights Net earnings attributable to Nucor stockholders of $1.16 billion, or $5.04 per diluted share Adjusted net earnings attributable to Nucor stockholders of $1.11 billion, or $4.84 per diluted share Net sales of $10.40 billion Net earnings before noncontrolling interests of $1.28 billion; EBITDA of $2.02 billion CHARLOTTE, N.C., July 27, 2026 /PRNewswire/ -- Nucor Corporation (NYSE: NUE) today announced consolidated net earnings attributable to Nucor stockholders of $1.16 billion, or $5.04 per diluted share, for the second quarter of 2026.

defenseworld.net2026-07-27

Dai ichi Life Insurance Company Ltd Sells 7,200 Shares of Nucor Corporation $NUE

Dai ichi Life Insurance Company Ltd cut its holdings in Nucor Corporation (NYSE: NUE) by 36.7% during the undefined quarter, according to its most recent disclosure with the SEC. The institutional investor owned 12,404 shares of the basic materials company's stock after selling 7,200 shares during the period. Dai ichi Life Insurance Company

benzinga.com2026-07-27

Nucor, Celestica And 3 Stocks To Watch Heading Into Monday

With U.S. stock futures trading higher this morning on Monday, some of the stocks that may grab investor focus today are as follows:

benzinga.com2026-07-27

Nucor Gears Up For Q2 Print; Here Are The Recent Forecast Changes From Wall Street's Most Accurate Analysts

Nucor Corporation (NYSE:NUE) will release its second quarter earnings report after the closing bell on Monday, July 27.

📊 AI Financial Analysis

Powered by StockMarketInfo
Earnings Data: Q Ending 2026-06-30

"Headline (2026-06-30, Q2): Revenue $10.40B and Net Income $1.16B, with EPS $5.05. YoY (vs 2025-07-05): Revenue rose 22.9% (from $8.46B) and Net Income rose 91.8% (from $0.60B). QoQ (vs 2026-04-04): Revenue increased 9.4% (from $9.50B) and Net Income increased 55.6% (from $0.74B). Profitability improved meaningfully. Gross margin expanded to 19.6% (up from 14.5% YoY and 15.8% QoQ), and net margin climbed to 11.1% (from 7.1% YoY and 7.8% QoQ). Operating income and operating margin similarly improved (operating margin 15.7% vs 10.9% YoY and 11.5% QoQ), indicating stronger pricing and/or better cost absorption. Cash flow was strong: operating cash flow was $1.40B and free cash flow was $0.83B in Q2, supported by higher earnings and a modest working-capital drag. The company returned capital via buybacks ($0.35B) and dividends ($0.13B), while maintaining balance sheet resilience for a cyclicals business: total assets increased to $36.95B and equity rose to $22.11B. Total shareholder returns appear highly positive given strong momentum (1Y price change +79.8%). Dividend yield is low (~0.25%), but buybacks likely contributed to total return."

Revenue Growth

Strong

Q2 revenue grew +9.4% QoQ and +22.9% YoY, accelerating from the prior quarter.

Profitability

Strong

Margins expanded sharply: gross margin 19.6% vs 15.8% QoQ and 14.5% YoY; net margin 11.1% vs 7.8% QoQ and 7.1% YoY.

Cash Flow Quality

Good

Operating cash flow $1.40B and free cash flow $0.83B in Q2; continued shareholder payouts via dividends and buybacks.

Leverage & Balance Sheet

Good

Equity increased to ~$22.1B with assets up to ~$37.0B; total debt ~$7.1B and net debt ~$4.6B remain manageable with strong earnings.

Shareholder Returns

Strong

Strong price momentum (+79.8% 1Y) plus buybacks ($0.35B) and dividends (~$0.13B); yield is modest.

Analyst Sentiment & Valuation

Neutral

Consensus target ($267.5) is above the current price (~$195.9), suggesting upside, but fundamentals remain cyclical.

Disclaimer:This analysis is AI-generated for informational purposes only. Accuracy is not guaranteed and this does not constitute financial advice.

Fundamentals Overview

Loading fundamentals overview...

Nucor’s Q2 2026 print was a solid execution-and-demand story: $5.04 EPS ($4.84 adjusted) exceeded guidance midpoint by $0.29, backed by ~$2B EBITDA and strong segment beats. Steel mills delivered $1.6B pretax earnings (+>35% QoQ) driven by higher realized pricing in sheet/plate plus $130M cash refunds (pig iron-related) that management flagged as not repeating in Q3. Steel Products posted $353M (+>$75M QoQ) with volumes up 11% on stable pricing, led by Tube. Raw materials rebounded to $146M pretax (+$101M QoQ) from higher DRI transfer prices and improved scrap processing. On the growth engine, the West Virginia greenfield sheet mill remains on time/budget with commissioning milestones completed and ramp targeted for early 2027; elevated preop/start-up costs ($120M) persist through 2027. Capital returns were strong ($479M; 41% of net earnings) alongside maintained ~$2.5B CapEx guidance. Management’s main risk signal is Q3 normalization of cash refunds and raw-material margin headwinds from scrap/iron ore.

AI IconGrowth Catalysts

  • Sheet mill project (West Virginia): ran first coil through pickle line in June; began commissioning melt shop for automotive and construction galv lines; remaining commissioning through end of year with ramp to commercial shipments in early 2027
  • Berkeley galv line completion timing: expects later Q3 (end of year/early Q1) as a faster-than-first galvanizing line ramp to capture strong end-market demand
  • Brandenburg plate growth: shipped >230,000 tons; benefited from expanded qualifying grades/sizes from the new core plate group, including API line pipe, armor grades, and ABS shipbuilding/bridge applications
  • Towers & Structures ramp: Lexington micromill and Kingman melt shop already at EBITDA-positive run rates; Alabama Towers & Structures expected EBITDA-positive later in 2026; Summit facility in Pennsylvania added via small acquisition; Utah Towers and structures targeted mid-2027 full production
  • Steel Products demand strength: Tube group posted second consecutive quarterly shipment record with strong earnings; Steel Products shipments up 11% vs Q1

Business Development

  • Downstream expansion via acquisitions: CHI Overhead Doors and Ridetech referenced as part of the 'expand beyond' growth bucket (differentiated customer value proposition)

AI IconFinancial Highlights

  • Reported EPS: $5.04 ($4.84 adjusted) with $0.20 noncash benefit from increased value of Helion investment; beat midpoint of guidance by $0.29
  • Q2 EBITDA: approximately $2.0B; net earnings $1.2B
  • Steel mills earnings: $1.6B pretax, up >35% QoQ; drivers included higher average selling prices in sheet and plate and cash refunds of $130M associated with prior-period raw material procurement (pig iron)
  • Steel Products: $353M pretax, up >$75M QoQ; volumes +11% on stable pricing across major product lines
  • Raw materials: $146M pretax vs $45M prior quarter; DRI benefited from higher transfer price (pig iron-based) and improved scrap processing
  • Capital allocation: returned $479M to shareholders via dividends + share repurchases (41% of quarterly net earnings); increased >$200M vs Q1
  • Liquidity & leverage: ~$2.7B cash and $3.4B cash+liquidity; total debt as % of capital at 23%; credit ratings described as strongest among North American steel producers
  • Q3 outlook: higher consolidated earnings; steel mills expected to lose the $130M cash-refund tailwind (no further cash refunds materially benefit beyond Q2); margin improvement expected from expanding metal margins and stable volumes; raw materials earnings expected lower due to lower realized scrap pricing and higher iron ore costs from idling some pellet capacity in the Middle East
  • Import policy impact: finished steel imports down 25% YoY attributed to strengthening of the 232 program plus antidumping/countervailing duties on corrosion-resistant steel and other products (trade-law enforcement referenced as measurable)

AI IconCapital Funding

  • Shareholder returns: $479M returned in Q2 (dividends + buybacks); $730M+ returned YTD
  • Free cash flow: $829M in Q2 (strongest quarter since 2023) on CapEx $571M
  • 2026 CapEx outlook maintained at ~$2.5B; Q2 pacing described as ~50% of annual estimate
  • Balance sheet runway: $2.7B cash; $3.4B cash and liquidity; leverage 23% debt/capital

AI IconStrategy & Ops

  • Commissioning milestones at West Virginia sheet mill: first coil through pickle line; commissioning melt shop in automotive and construction galv lines; cold mill and hot mill commissioning expansion later in 2026; complete commissioning/testing by end of year
  • Preoperating/start-up costs: $120M in Q2; expected elevated through rest of 2026 and throughout 2027 as greenfield sheet mill ramps
  • CSP (hot-rolled pricing) discipline: management claimed transparent weekly HRC pricing and reduced speculation versus typical past cycles; imports described as remaining low partly due to customers being able to buy when needed
  • Production flexibility: raw materials strategy emphasizes building flexibility in supply chain (recycling yards and DRI) to capture margin opportunities

AI IconMarket Outlook

  • 2026 shipment growth guidance tightened: now expects closer to the high end of previously suggested 5% to 10% range
  • Sheet imports (Noah Hanners detail): 2024 sheet imports 9M tons; expected ~4.5M tons in 2026 (implying 4.5M tons additional addressable market for domestic suppliers)
  • Additional ADC: management cited a couple million tons increase in ADC, implying ~6.5M tons total addressable market for domestic suppliers
  • Back half of 2026: expects continued momentum across Steel Products group and further margin expansion over time
  • Seasonality/ship days: asked about Q4 shipping profile; management response cited 91 days in Q3 and 89 days in Q4
  • Flat products demand: sheet demand expected to continue into 2027, led by energy, advanced manufacturing, and data centers; board defense, energy, data centers cited as multi-year consumption

AI IconRisks & Headwinds

  • Q3 mix shift risk: steel mills cash refunds tied to prior-period raw material procurement ($130M) expected not to recur materially in Q3 or beyond
  • Raw materials margin pressure risk in Q3: lower expected realized scrap pricing and elevated iron ore costs due to idling some pellet capacity in the Middle East
  • Preoperating/start-up cost burden: $120M in Q2 expected to remain elevated through rest of 2026 and throughout 2027 during greenfield sheet mill ramp
  • Import and policy uncertainty: trade environment includes USMCA non-renewal decision and annual review process unless changes are made; management hopes for melted/poured North America requirement effective immediately for automotive-related purchases
  • Operational/execution risk: towers/structures and other construction/ramp programs require timely commissioning to achieve expected EBITDA-positive contributions (timing explicitly noted for Q3 vs early Q1 vs Q1 next year)

Q&A: Analyst Interest

  • Sheet pricing vs imports: Management attributed low imports to demand strength rather than pricing delta, pointing to record backlogs/order entry and CSP discipline reducing speculation. They emphasized customers buying when needed and multi-year end-market drivers, despite a Q2 QoQ import tick-up.
  • Capacity utilization modeling for Brandenburg: Management did not push back on 75% as a starting point and said Brandenburg could “creep up.” They cited that ~1/3 of Q2 shipments were grades/sizes previously unavailable, including API line pipe (fully qualified), armor, and ABS applications, enabling upside into 2027.
  • Downstream project ramp and timing: Management linked Lexington and Kingman micromill/melt shop to already EBITDA-positive contributions. For towers and structures, they flagged late-year balance sheet/cash-flow impacts, Berkeley galv line near end-of-year/early Q1, and Utah Towers ramp into 2027, with an expectation that contributions accelerate quickly.

Sentiment: POSITIVE

Note: This summary was synthesized by AI from the NUE Q2 2026 earnings transcript. Financial data is complex; please verify all metrics against official SEC filings before making investment decisions.

📋 Official Regulatory 10-K / 10-Q SEC Filings

Direct authenticated documentation links to audited SEC database reports for NUE.

SEC EDGAR Live Feed
Loading financial data and tables...
📁

SEC Filings (NUE)

© 2026 Stock Market Info — Nucor Corporation (NUE) Financial Profile