NVE Corporation

NVE Corporation (NVEC) Market Cap

NVE Corporation has a market capitalization of $493.9M.

Price: $102.11

β–Ό -6.97 (-6.39%)

Market Cap: 493.92M

NASDAQ Β· time unavailable

CEO: Daniel A. Baker

Sector: Technology

Industry: Semiconductors

IPO Date: 1995-05-23

Website: https://www.nve.com

NVE Corporation (NVEC) - Company Information

Market Cap: 493.92M|Sector: Technology

Company Profile

NVE Corporation develops and sells devices that use spintronics, a nanotechnology that relies on electron spin to acquire, store, and transmit information in the United States and internationally. The company manufactures spintronic products, including sensors and couplers for use in acquiring and transmitting data. Its products comprise standard sensors to detect the presence of a magnetic or metallic material to determine position or speed primarily for the factory automation market; and custom and medical sensors for medical devices to replace electromechanical magnetic switches. The company also offers spintronic couplers for industrial Internet of Things market. In addition, it undertakes contracts for research and development, and licensing of spintronic magnetoresistive random access memory technology. NVE Corporation was founded in 1989 and is headquartered in Eden Prairie, Minnesota.

Analyst Sentiment

50%
Hold

From 1 Active Polls

Consensus Target Matrix

Data feed parsing pending...

Price & Moving Averages

Loading chart...

🎯 Wall Street Analyst Intelligence Report

1-Year structural target targets, chart projections, and sentiment maps.

Average 1Y Target
$107.22
β–² +5.00% Upside
Low Target
$76.58
-25% Risk
Median Target
$104.15
2% Mid
High Target
$127.64
25% Max

Consensus Trend Projection

Trailing closures vs. 12-month metrics map.

Analyst Vote Distribution

Aggregate institutional coverage sentiment weights.

Sentiment volume allocation data unavailable.

πŸ“Š Historical Valuation Multiples

Real-time Trailing Twelve Month (TTM) momentum side-by-side with discrete quarterly metrics.

Fiscal QuarterTTMQ1 2026Q4 2025Q3 2025Q2 2025Q1 2025Q4 2024Q3 2024Q2 2024
Period EndingTrailing 12MMar 31, 2026Dec 31, 2025Sep 30, 2025Jun 30, 2025Mar 31, 2025Dec 31, 2024Sep 30, 2024Jun 30, 2024
Market Cap ($M)494317287316356308394386349
Enterprise Value ($M)493316285312354301389383344
Price to Earnings Ratio (P/E)32.5016.0721.2023.8424.8919.8032.2923.9721.32
Price/Earnings-to-Growth Ratio (PEG)β€”0.70β€”6.01β€”0.45β€”β€”β€”
Price to Sales Ratio (P/S)18.7641.3946.1049.7458.3342.4177.7757.1251.52
Price to Book Ratio (P/B)8.485.444.925.295.834.956.255.955.39
Price to Free Cash Flow Ratio (P/FCF)34.1470.7891.45115.9986.17129.11103.48200.6270.80
Enterprise Value to Sales (EV/Sales)β€”41.2845.8349.0957.9441.4376.8756.7150.68
Enterprise Value to EBITDA (EV/EBITDA)30.1064.1574.3283.1591.4469.54127.8185.5977.00
Debt to Equity Ratio-0.050.020.030.020.010.010.020.000.00

⚑ NVEC Growth Runway Model

Standard long term linear growth fade

Multi-Stage Discounted Cash Flow Sandbox

Market Price$102.11
Intrinsic Value$102.04
Market Alignment
Overvalued by 0.1%relative to calculated intrinsic value
9.00%
Exp: 2%2%
i

Growth runway slowdown

This value provides a time window for the growth rate to decline beyond Stage 1 toward the terminal rate. Longer windows are most useful for companies with high growth starting conditions or strong competitive advantages. This option stretches out the growth rate slowdown across 5, 10, or 15-year steps. A high-growth starting condition (exceeding a 25% initial growth rate) automatically applies a curve decay to simulate realistic, rapid market saturation.
i

Terminal growth rate

With long-term inflation between 3-5%, revenue must grow by that baseline to maintain flat real-world market share. This value sets the permanent terminal growth rate to factor into the valuation beyond the growth slowdown runway toward maturity.

3-Stage Financial Runway Horizon

🧠 Perpetuity Horizon Engine (Stage 3: Post-2036)

Terminal FCF Base$0.02B
Perpetuity TV Value$0.31B
Discounted TV (PV)$0.12B
TV Weighting %55.6%
⚠️
Financial Model Disclaimer & Risk Disclosure: This interactive scenario simulator is an educational sandbox provided strictly for informational and analytical research purposes. Core historical financial statements and consensus estimates are sourced directly via Financial Modeling Prep (FMP). All downstream outputs are entirely deterministic, hypothetical projections generated by combining automated mathematical formulas (including linear interpolation and Gaussian bell-curve decay models) with user-selected variables and third-party financial data inputs. Users assume all liability for trading decisions executed based on these sandbox calculations.

πŸ“˜ Full Research Report

ℹ️

AI-Generated Research: This report is for informational purposes only.

πŸ“˜ NVE CORP (NVEC) β€” Investment Overview

🧩 Business Model Overview

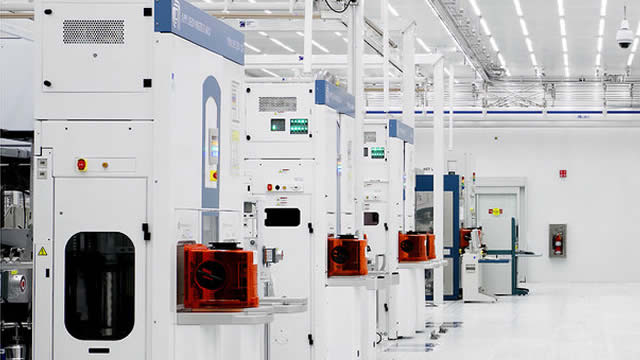
NVE CORP designs and manufactures specialized sensing and magnetics-related components that are embedded into customers’ equipment and end systems. The core β€œhow it works” is a design-in process: engineers select NVE’s sensing technology during product development, and the component is then qualified for production use within a customer’s platform. Once qualified, NVE benefits from long qualification cycles, repeat supply requirements, and ongoing purchases tied to bill-of-materials (BOM) content and platform longevity.

This model is characterized less by one-off orders and more by recurring demand tied to established industrial and electronics programs, where suppliers must meet stringent performance, reliability, and quality requirements.

πŸ’° Revenue Streams & Monetisation Model

Revenue is primarily generated from product sales of proprietary sensing/magnetics technologies. Monetisation is driven by:

  • Mix of higher-value custom/qualified components: specialized configurations and application-specific designs tend to support better margins than commodity-like parts.
  • Production replacement and platform refresh cycles: once a design is adopted, demand often persists through multi-year production runs.
  • Scale-to-margin dynamics: incremental volume can spread manufacturing and R&D costs over a larger output base, subject to yield and supply constraints.

While revenue is ultimately transactional at the unit level, the customer lifecycle creates semi-recurring characteristics through continued BOM inclusion, including reorders and secondary programs derived from the same underlying technology.

🧠 Competitive Advantages & Market Positioning

NVE’s moat is primarily Intangible Assets combined with Switching Costs.

  • Switching Costs (Design-in and Qualification): Customers face engineering effort, validation/testing, safety/reliability requirements, and production re-qualification if a sensing technology is replaced. These hurdles make supplier changes costly and slow.
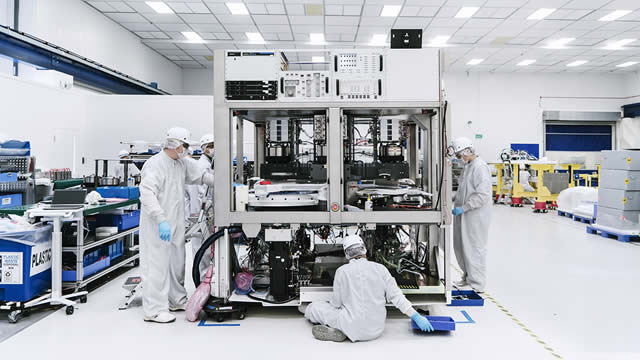
  • Intangible Assets (Proprietary Technology & Manufacturing Know-How): The company’s competitive position depends on specialized technology and process control that are difficult to replicate without significant time and capital investment.
  • Application Depth: Performance requirements in sensing applications (accuracy, stability, temperature/field behavior, and long-term reliability) favor suppliers with proven design support and manufacturing consistency.

Competitive benchmarking

  • Allegro MicroSystems (now part of MiV/TTM ecosystem depending on consolidation context) β€” broader sensing portfolio with heavy exposure to Hall-effect and power/automotive measurement use cases.
  • Infineon Technologies β€” strong in power management and automotive electronics, often competing on integrated solutions and mainstream sensing technologies.
  • Melexis β€” deep automotive sensing footprint with differentiated signal processing and system-level integration in certain applications.

Industry focus contrast: NVE competes most directly where customers value precision sensing performance and proprietary magnetics-based capabilities that require tight manufacturing control and proven qualification. In contrast, larger competitors frequently emphasize broader sensor families (often including Hall-effect) and integrated power/signal platforms, which can be advantageous where application requirements align with their mainstream offerings.

πŸš€ Multi-Year Growth Drivers

Over a 5–10 year horizon, demand tailwinds for specialized sensing and magnetics components typically follow electrification, miniaturization, and increased sensing density in engineered systems. Key drivers include:

  • Electrification across automotive and industrial equipment: higher current control, position measurement, and protection functions increase sensor content per vehicle or machine.
  • Higher reliability and safety requirements: increasing emphasis on durable, stable sensing under harsh operating conditions favors qualified suppliers.
  • Process and integration trends: manufacturers seek components that reduce system complexity while meeting accuracy and performance targetsβ€”supporting continued design-in opportunities.
  • Long platform lifecycles: once designs are adopted, production continuity can extend demand visibility and reduce revenue cyclicality relative to pure commodity electronics.

The company’s total addressable market expands primarily through incremental design wins and platform extensions rather than through rapid, high-volatility end-market substitution.

⚠ Risk Factors to Monitor

  • Customer qualification and program timing risk: delays in engineering projects or certification processes can postpone revenue recognition tied to new design wins.
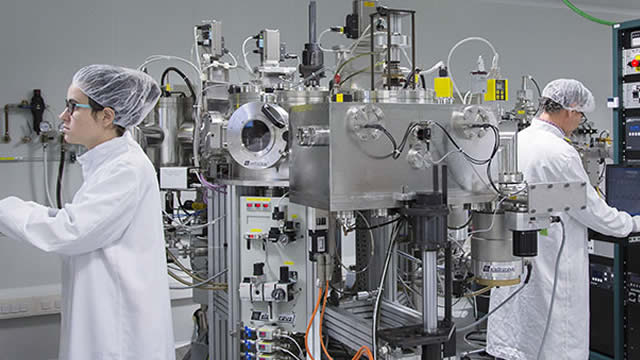
  • Manufacturing yield, supply continuity, and cost inflation: specialized semiconductor/magnetics manufacturing can be sensitive to yield performance and input cost swings.
  • Competitive technology shift: breakthroughs in alternative sensing methods or more integrated sensor architectures could reduce addressable share in specific niches.
  • Customer concentration and platform exposure: a smaller number of high-impact programs can influence revenue variability.
  • IP and execution risk: the moat depends on continued innovation and protection of proprietary processes and know-how.

πŸ“Š Valuation & Market View

Specialty semiconductor and components companies are typically valued using a combination of EV/EBITDA and P/S, with the dominant debate centering on (1) normalized gross margin durability and (2) the sustainability of growth from design wins and production ramping.

Key valuation drivers include:

  • Gross margin trajectory (mix, yield, and scale)
  • Revenue quality (BOM depth, platform persistence, and customer repeatability)
  • Operating leverage from R&D and fixed-cost absorption
  • Balance-sheet strength and cash conversion given working capital needs in component businesses

πŸ” Investment Takeaway

NVE CORP’s long-term investment case rests on a structural advantage in specialized sensing technology supported by switching costs from design-in/qualification and intangible process expertise. Rather than relying on short-cycle demand, the business model tends to benefit from multi-year platform inclusion and incremental design-win expansion. The main path to durable outcomes is continued technology relevance, manufacturing execution, and conversion of engineering adoption into sustained production demand.


⚠ AI-generated β€” informational only. Validate using filings before investing.

πŸ“° Market News & Coverage

14 Stories Available

Real-time institutional reporting and market updates for NVEC.

gurufocus.comβ€’2026-05-22

Is NVE Corp (NVEC) Overvalued After 4.2% Rally? GF Value Says Overvalued

On May 22, 2026, NVE Corp (NVEC) shares rose 4.2% to a current price of $91.20. This price movement comes amidst a broader performance trend where NVEC has seen

zacks.comβ€’2026-05-13

NVEC Reports Solid Y/Y Earnings Growth in Q4, Unveils Strong Outlook

NVE reports a 27% increase in Q4 net income, driven by strong product sales and an optimistic outlook for growth in the semiconductor and robotics markets.

seekingalpha.comβ€’2026-05-06

NVE Corporation (NVEC) Q4 2026 Earnings Call Transcript

NVE Corporation (NVEC) Q4 2026 Earnings Call Transcript

gurufocus.comβ€’2026-05-01

Chuck Royce Reduces Holdings in NVE Corp: A Strategic Portfolio Adjustment

Transaction Overview On March 31, 2026, Chuck Royce (Trades, Portfolio) executed a strategic reduction in holdings of NVE Corp (NVEC). This transaction involved

defenseworld.netβ€’2026-04-15

Cirrus Logic (NASDAQ:CRUS) & NVE (NASDAQ:NVEC) Financial Review

NVE (NASDAQ: NVEC - Get Free Report) and Cirrus Logic (NASDAQ: CRUS - Get Free Report) are both computer and technology companies, but which is the better investment? We will compare the two companies based on the strength of their dividends, risk, institutional ownership, analyst recommendations, earnings, valuation and profitability. Insider and Institutional Ownership 66.0% of NVE

defenseworld.netβ€’2026-04-08

NVE (NASDAQ:NVEC) Stock Price Passes Above 200-Day Moving Average – Here’s Why

NVE Corporation (NASDAQ: NVEC - Get Free Report) shares passed above its 200-day moving average during trading on Tuesday. The stock has a 200-day moving average of $67.03 and traded as high as $71.63. NVE shares last traded at $71.49, with a volume of 89,761 shares trading hands. Wall Street Analyst Weigh In Separately, Weiss

defenseworld.netβ€’2026-04-06

Lam Research (NASDAQ:LRCX) & NVE (NASDAQ:NVEC) Head to Head Comparison

Lam Research (NASDAQ: LRCX - Get Free Report) and NVE (NASDAQ: NVEC - Get Free Report) are both computer and technology companies, but which is the superior business? We will compare the two businesses based on the strength of their dividends, analyst recommendations, earnings, risk, valuation, profitability and institutional ownership. Analyst Recommendations This is a summary of

defenseworld.netβ€’2026-03-26

Comparing indie Semiconductor (NASDAQ:INDI) and NVE (NASDAQ:NVEC)

NVE (NASDAQ: NVEC - Get Free Report) and indie Semiconductor (NASDAQ: INDI - Get Free Report) are both small-cap computer and technology companies, but which is the superior stock? We will compare the two businesses based on the strength of their risk, dividends, institutional ownership, valuation, analyst recommendations, profitability and earnings. Analyst Recommendations This is a summary

defenseworld.netβ€’2026-03-11

NVE (NASDAQ:NVEC) Stock Price Passes Above 200 Day Moving Average – Should You Sell?

NVE Corporation (NASDAQ: NVEC - Get Free Report)'s share price passed above its 200-day moving average during trading on Tuesday. The stock has a 200-day moving average of $66.76 and traded as high as $70.72. NVE shares last traded at $68.17, with a volume of 51,244 shares changing hands. Wall Street Analysts Forecast Growth Separately,

defenseworld.netβ€’2026-03-03

Contrasting Mobix Labs (NASDAQ:MOBX) and NVE (NASDAQ:NVEC)

NVE (NASDAQ: NVEC - Get Free Report) and Mobix Labs (NASDAQ: MOBX - Get Free Report) are both small-cap computer and technology companies, but which is the better investment? We will compare the two businesses based on the strength of their dividends, risk, analyst recommendations, profitability, institutional ownership, valuation and earnings. Analyst Ratings This is a breakdown

zacks.comβ€’2026-02-10

NVEC vs. AOSL: Which Small-Cap Chip Stock Is the Better Buy?

NVE Corp's niche model, debt-free balance sheet, and lower valuation give it a risk-adjusted edge over Alpha and Omega despite slower growth prospects.

gurufocus.comβ€’2026-02-02

Market Today: Palantir beats, Disney warns; oil slides

Guru Stock PicksSteven Romick has made the following transactions:Reduce in ADI by 5.61%Sold out in XSWX:AMRZAdd in FBIN by 19.9%New position in TMOYacktman Fun

zacks.comβ€’2026-01-26

NVEC's Q3 Earnings Rise 11% Y/Y, Highlight Growth Momentum

NVEC reports strong quarterly results, with revenue and earnings growth driven by higher product sales, contract R&D strength and improving end-market demand.

defenseworld.netβ€’2026-01-23

NVE Q3 Earnings Call Highlights

NVE (NASDAQ: NVEC) reported year-over-year growth in revenue and earnings for its third fiscal quarter ended December 31, 2025, citing broad-based gains across defense and non-defense demand as well as both direct and distributor channels. On the company's earnings call, President and CEO Dan Baker said revenue increased 23% and earnings rose 11% versus the prior-year

πŸ“Š AI Financial Analysis

Powered by StockMarketInfo
Earnings Data: Q Ending 2026-03-31

"NVEC reported Q4 2026 (ended 2026-03-31) revenue of $7.65M and net income of $4.93M (EPS $1.02). Revenue increased YoY versus Q4 2025 (from $7.27M to $7.65M, +5.3% YoY), and net income grew from $3.89M to $4.93M (+26.6% YoY). QoQ, revenue rose from $6.22M (Q3 2026) to $7.65M (+23.1%), while net income climbed from $3.38M to $4.93M (+45.7%). Profitability expanded: net margin improved to 64.4% from 54.4% YoY, and operating margin rose to 61.9%. Cash flow quality remained strong, with operating cash flow of $4.49M and free cash flow of $4.48M. The company paid $4.84M in dividends in the quarter, closely tracking earnings and resulting in a high payout ratio (~98%), but the balance sheet is highly liquid with $19.84M cash & short-term investments and modest debt ($0.74M), keeping net debt negative (net cash) at -$0.97M. Total shareholder returns look favorable given the stock’s +44.6% 1-year change, indicating strong capital appreciation to complement the ~1.5% dividend yield."

Revenue Growth

Positive

Revenue grew +23.1% QoQ (Q3 to Q4 2026) and +5.3% YoY (Q4 2025 to Q4 2026), showing re-acceleration after a weaker prior quarter.

Profitability

Strong

Net margin expanded to 64.4% in Q4 2026 from 54.4% YoY and operating margin rose to 61.9%, with net income +26.6% YoY and +45.7% QoQ.

Cash Flow Quality

Good

Operating cash flow was $4.49M and free cash flow $4.48M, near earnings. Dividends paid were $4.84M, implying a ~98% payout ratioβ€”high, but supported by cash generation.

Leverage & Balance Sheet

Strong

Balance sheet is resilient: $19.84M cash & short-term investments, total assets $60.4M, and only $0.74M total debt (net debt -$0.97M). Equity remains strong at ~$58.2M.

Shareholder Returns

Good

Stock price momentum is strong with +44.6% 1-year change. Dividend yield is ~1.5%, so total return is likely supported by both capital appreciation and yield.

Analyst Sentiment & Valuation

Neutral

No explicit analyst price target provided. Valuation appears premium on earnings/cash flow multiples (e.g., P/E ~16.1; price-to-free-cash-flow very high), which can cap upside even with strong execution.

Disclaimer:This analysis is AI-generated for informational purposes only. Accuracy is not guaranteed and this does not constitute financial advice.

Fundamentals Overview

Loading fundamentals overview...

So what: NVEC delivered a strong Q4 profit and revenue mix shift, with net income up 27% and diluted EPS at $1.02, supported by a sharp acceleration in nondefense product sales (+34% YoY) and cost reductions (-19% operating expenses). The quarter also benefited from a major tax-rate drop to 5% (from 18%) tied to advanced manufacturing investment tax credits tied to equipment placed in service. Product momentum is being underwritten by capacity expansion: new wafer-level chip-scale packaging capability and extremely precise spintronic deposition (within one atomic layer) are now translating into orders for high-performance TMR sensors. However, margin and mix are not uniformly improvingβ€”gross margin slipped 79% to 78% (implied -100 bps) and defense and contract R&D remain volatile (defense -79% YoY; contract R&D -19%). Fiscal 2027 optimism is clear, especially for defense and contract R&D increases, but the tax credit tailwind is expected to fade as equipment purchases normalize post-expansion.

AI IconGrowth Catalysts

  • 34% YoY increase in nondefense product sales
  • New high-performance TMR sensor orders supported by in-place expansion equipment
  • Medical/industrial wafer-level chip-scale sensor launch (0.65mm side; ~1/3 conventional packaged area) supporting miniaturization demand
  • Capacity/capability expansion enables smaller, more precise wafer-level chip-scale package parts in-house
  • Optimized spintronic materials deposition control to well within one atomic layer to improve device precision and expand product capability

Business Development

  • Named isolator distributor: Semitech Incorporated (supports electronics contract manufacturers/EMSs)
  • Trade show lead generation: Medical Design & Manufacturing West (Anaheim) exhibited wafer-level chip-scale parts and MRI-safe/tolerant sensors and electrical isolators
  • Trade show focus: Sensors Converge (Silicon Valley) for robotics and AIoT; Sensor+Test (Germany) for sensors plus highlighting power conversion for cars and charging stations

AI IconFinancial Highlights

  • Net income +27% YoY to $4.9M; $1.02 diluted EPS vs $0.80 prior year quarter
  • Revenue +5% YoY to $7.65M; product sales +6% driven by nondefense product sales +34% and defense sales -79%
  • Contract R&D revenue -19% YoY
  • Quarter gross margin 78% of revenue vs 79% prior year (79% -> 78% YoY; -100 bps implied)
  • Operating expenses -19% YoY (R&D -26%; SG&A -5%) due to completion of some wafer-level chip-scale packaging activities and reassignment of resources to manufacturing
  • Effective tax rate decreased to 5% from 18% YoY due to advanced manufacturing investment tax credit
  • Operating margin 62%, pretax margin 68%, net margin 64% (quarter profitability metrics)

AI IconCapital Funding

  • Dividends referenced as covered by earnings: $1 per share dividend in the past quarter (amount not further specified)
  • No explicit buyback or debt figures disclosed in transcript
  • Cash flow from operations: $16.7M for fiscal year (+16% YoY); cash flow $1.5M more than net income
  • Fixed asset purchases $2.19M in fiscal 2026; management expects fixed asset purchases to decrease significantly in fiscal 2027 after expansion completion
  • Inventories decreased 5% in fiscal year; finished goods increased to support demand

AI IconStrategy & Ops

  • Completed major expansion; last major equipment cluster put into service in the past quarter as planned
  • New equipment enables extremely precise control of spintronic materials deposition to within one atomic layer
  • R&D resource shift: completion of some wafer-level chip-scale packaging activities; reassignment of R&D to manufacturing reduced R&D expense
  • Marketing/sales execution: first-time exhibiting at Medical Design & Manufacturing West; exhibiting at Sensors Converge and Sensor+Test; reliance on distributor partner event coverage for spring season

AI IconMarket Outlook

  • Management does not give specific guidance; qualitative outlook: β€œcontinued bright outlook for product sales” and β€œoptimistic” given improving global semiconductor market and ample inventories
  • Defense sales expectation: defense sales to β€œincrease significantly” in fiscal 2027 (year ending Mar 31, 2027)
  • Contract R&D expectation: contract R&D to increase in fiscal 2027
  • Tax credit outlook: advanced manufacturing investment tax credits expected to decrease significantly in fiscal 2027 due to reduced manufacturing equipment purchases after expansion completion
  • Next earnings call date: July for first quarter fiscal 2027 earnings call

AI IconRisks & Headwinds

  • Defense procurement cycle volatility: defense sales can be volatile (defense sales -79% YoY in quarter; management expects recovery in FY27)
  • Contract R&D unevenness: primarily defense/government related; -19% YoY in quarter and described as uneven
  • Gross margin slightly down: 79% -> 78% YoY (-100 bps implied)
  • Tax rate benefit timing risk: effective tax rate benefit driven by advanced manufacturing investment tax credits; credits expected to decrease significantly in fiscal 2027
  • Limited direct data center sales visibility: company sells to subassembly manufacturers, making data center share attribution difficult

Q&A: Analyst Interest

  • Data center isolator relevance: Management (Pete Eames/Daniel Baker) framed higher-frequency operation vs competitors as driving efficiency improvements; they characterized savings as β€œsmall percentage, maybe a few percent” but meaningful at data-center scale. Dan Baker added Semitech’s EMS/volume design-ins pathway supports adoption into AI infrastructure rack designs.
  • Capacity-to-revenue expectations: Management (Daniel Baker) was asked whether effectively doubling capacity would cause revenue to double. They declined specific guidance, reiterated growth intent, cited improving global semiconductor market conditions, β€œample inventories,” and β€œexciting new products,” concluding with an optimistic outlook rather than quantifying revenue impact.
  • Quantifying data center opportunity: Management (Ittai Eden/Pete Eames) sought % of business and timing. Pete Eames said difficult to quantify because NVEC does not sell directly to data centers; they sell to subassembly manufacturers building systems for data centers. This limited direct linkage from data-center growth to isolator volumes or near-term revenue share.

Sentiment: MIXED

Note: This summary was synthesized by AI from the NVEC Q4 2026 earnings transcript. Financial data is complex; please verify all metrics against official SEC filings before making investment decisions.

πŸ“‹ Official Regulatory 10-K / 10-Q SEC Filings

Direct authenticated documentation links to audited SEC database reports for NVEC.

SEC EDGAR Live Feed
Loading financial data and tables...
πŸ“

SEC Filings (NVEC)

Β© 2026 Stock Market Info β€” NVE Corporation (NVEC) Financial Profile