Omega Flex, Inc.

Omega Flex, Inc. (OFLX) Market Cap

Omega Flex, Inc. has a market capitalization of $304.3M.

Price: $30.15

0.03 (0.10%)

Market Cap: 304.34M

NASDAQ · time unavailable

CEO: Dean W. Rivest

Sector: Industrials

Industry: Industrial - Machinery

IPO Date: 2005-08-01

Website: https://www.omegaflexcorp.com

Omega Flex, Inc. (OFLX) - Company Information

Market Cap: 304.34M|Sector: Industrials

Company Profile

Omega Flex, Inc., together with its subsidiaries, manufactures and sells flexible metal hoses and accessories in North America and internationally. It offers flexible gas piping for use in residential and commercial buildings, as well as its fittings; and corrugated medical tubing for use in hospitals, ambulatory care centers, dental, physician and veterinary clinics, laboratories, and other facilities. The company sells its products under the TracPipe, CounterStrike, AutoSnap, AutoFlare, DoubleTrac, DEF-Trac, and MediTrac brand names. It serves various markets, including construction, manufacturing, transportation, petrochemical, pharmaceutical, and other industries. The company sells its products through independent sales representatives, distributors, original equipment manufacturers, and direct sales, as well as through its website. The company was formerly known as Tofle America, Inc. and changed its name to Omega Flex, Inc. in 1996. Omega Flex, Inc. was incorporated in 1975 and is based in Exton, Pennsylvania.

Analyst Sentiment

50%
Hold

From 0 Active Polls

Consensus Target Matrix

Data feed parsing pending...

Price & Moving Averages

Loading chart...

🎯 Wall Street Analyst Intelligence Report

1-Year structural target targets, chart projections, and sentiment maps.

Average 1Y Target
$31.66
▲ +5.00% Upside
Low Target
$22.61
-25% Risk
Median Target
$30.75
2% Mid
High Target
$37.69
25% Max

Consensus Trend Projection

Trailing closures vs. 12-month metrics map.

Analyst Vote Distribution

Aggregate institutional coverage sentiment weights.

Sentiment volume allocation data unavailable.

📊 Historical Valuation Multiples

Real-time Trailing Twelve Month (TTM) momentum side-by-side with discrete quarterly metrics.

Fiscal QuarterTTMQ1 2026Q4 2025Q3 2025Q2 2025Q1 2025Q4 2024Q3 2024Q2 2024
Period EndingTrailing 12MMar 31, 2026Dec 31, 2025Sep 30, 2025Jun 30, 2025Mar 31, 2025Dec 31, 2024Sep 30, 2024Jun 30, 2024
Market Cap ($M)304313297315327351424504515
Enterprise Value ($M)259268249270281307377464475
Price to Earnings Ratio (P/E)22.8237.7121.7621.3419.6624.6022.6227.2828.63
Price/Earnings-to-Growth Ratio (PEG)5.422.092.7025.84
Price to Sales Ratio (P/S)3.1013.5711.7912.9912.8015.0515.7120.2520.91
Price to Book Ratio (P/B)3.673.783.533.743.894.225.106.156.39
Price to Free Cash Flow Ratio (P/FCF)21.36-3102.1640.73154.4865.19350.0246.06138.20136.76
Enterprise Value to Sales (EV/Sales)11.619.8711.1611.0213.1613.9918.6419.28
Enterprise Value to EBITDA (EV/EBITDA)15.89111.5157.3660.0455.5569.9261.5380.2285.20
Debt to Equity Ratio-2.770.050.060.060.060.060.060.070.07

OFLX Growth Runway Model

Standard long term linear growth fade

Multi-Stage Discounted Cash Flow Sandbox

Market Price$30.15
Intrinsic Value$30.12
Market Alignment
Overvalued by 0.1%relative to calculated intrinsic value
9.00%
Exp: -3%-3%
i

Growth runway slowdown

This value provides a time window for the growth rate to decline beyond Stage 1 toward the terminal rate. Longer windows are most useful for companies with high growth starting conditions or strong competitive advantages. This option stretches out the growth rate slowdown across 5, 10, or 15-year steps. A high-growth starting condition (exceeding a 25% initial growth rate) automatically applies a curve decay to simulate realistic, rapid market saturation.
i

Terminal growth rate

With long-term inflation between 3-5%, revenue must grow by that baseline to maintain flat real-world market share. This value sets the permanent terminal growth rate to factor into the valuation beyond the growth slowdown runway toward maturity.

3-Stage Financial Runway Horizon

🧠 Perpetuity Horizon Engine (Stage 3: Post-2035)

Terminal FCF Base$0.02B
Perpetuity TV Value$0.30B
Discounted TV (PV)$0.13B
TV Weighting %55.5%
⚠️
Financial Model Disclaimer & Risk Disclosure: This interactive scenario simulator is an educational sandbox provided strictly for informational and analytical research purposes. Core historical financial statements and consensus estimates are sourced directly via Financial Modeling Prep (FMP). All downstream outputs are entirely deterministic, hypothetical projections generated by combining automated mathematical formulas (including linear interpolation and Gaussian bell-curve decay models) with user-selected variables and third-party financial data inputs. Users assume all liability for trading decisions executed based on these sandbox calculations.

📘 Full Research Report

ℹ️

AI-Generated Research: This report is for informational purposes only.

📘 OMEGA FLEX INC (OFLX) — Investment Overview

🧩 Business Model Overview

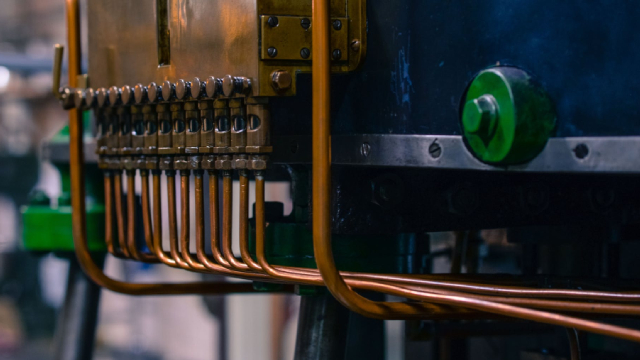
Omega Flex designs and manufactures corrugated metal hose assemblies used to connect and safely flex piping systems across plumbing, HVAC, and industrial applications. The value chain is primarily engineering-led manufacturing: customers specify a flexible connector to handle thermal expansion, vibration, and movement while meeting plumbing and gas-safety standards. Products are then distributed through a network of wholesalers, specialty channel partners, and contractors, with additional business from OEM-style or specification-driven orders where performance and compliance matter more than lowest cost.

Customer stickiness is driven by specification and installation practices: once a project’s design standards and approved materials are set, switching suppliers can require re-qualification, code verification, and field rework risk.

💰 Revenue Streams & Monetisation Model

Revenue is largely generated through shipment of engineered components rather than recurring subscriptions. Monetisation comes from:

  • Product sales (primary driver): standard and custom corrugated hose assemblies and related fittings/assemblies.
  • Specification/repair-driven demand: aftermarket replacement and service work tied to aging building and industrial infrastructure.
  • Mix-driven profitability: margin tends to improve with higher-complexity engineered assemblies, better utilization, and favorable order mix versus highly standardized SKUs.

The key margin drivers are manufacturing yield and efficiency, material pass-through and procurement terms for stainless and other inputs, and product mix toward configurations that require more engineering and fabrication.

🧠 Competitive Advantages & Market Positioning

Omega Flex’s moat is primarily high switching costs plus code and compliance credibility (intangible/structural barriers). Flexible connectors are not fungible commodities: proper performance depends on pressure ratings, material specifications, and installation requirements. Approved-equivalent substitution can be non-trivial for specifiers and installers.

Why competitors have difficulty taking share:

  • Specification lock-in: architects, mechanical engineers, and code-compliant installers often standardize on approved products; changing suppliers can require re-approval and documentation work.
  • Technical execution and QA reputation: product performance under vibration, movement, and pressure conditions creates credibility advantages that are hard to replicate quickly.
  • Distribution and project continuity: established stocking and familiarity reduce adoption friction for approved products.
Competitive benchmarking (industry peers):
  • Watts Water Technologies — broader plumbing and flow-control systems; less concentrated on corrugated flexible hose assemblies as the core differentiator.
  • Viega — strong in piping and fitting ecosystems; competitive overlap exists in connection solutions, but Omega Flex’s positioning centers on engineered metal flexible hose performance for movement and safety.
  • Swagelok (Parker Hannifin) — industrial connection products; competes for specific industrial connector use cases, but Omega Flex’s end-market focus and product specialization emphasize flexible hose assemblies for building and gas/plumbing-related applications.

Omega Flex’s industry focus is narrower and more engineering-specific than broad plumbing ecosystems, which supports durability of margins when specifications favor performance and compliance over commoditized pricing.

🚀 Multi-Year Growth Drivers

Over a 5–10 year horizon, growth is supported by structural demand for safer, more reliable connections in aging and expanding infrastructure:

  • Infrastructure and retrofit cycles: replacement of aging plumbing, HVAC, and industrial piping connections increases replacement connector penetration.
  • Building and industrial safety requirements: regulatory and design standards that address vibration, thermal expansion, and leak risk favor flexible connectors with proven performance.
  • Energy infrastructure and fuel systems expansion: ongoing development and modernization of fuel-delivery and utility-adjacent piping systems creates demand for code-compliant connectors.
  • Manufacturing scale with engineering depth: capacity expansion and operational discipline can support volume growth without proportionate quality or warranty risk.

TAM expansion is driven less by market share shifts within commodity fittings and more by the continued need to specify reliable flexible connections where movement and pressure integrity are safety-critical.

⚠ Risk Factors to Monitor

  • Input cost volatility: stainless and related material costs can pressure gross margins if not offset by pricing power and procurement.
  • Construction and industrial cycle sensitivity: demand can soften when new-build activity declines or project timelines stretch.
  • Regulatory and code changes: alterations in safety standards, certifications, or installation requirements can affect product qualification and customer adoption timing.
  • Quality and liability exposure: any defect or installation misapplication can lead to warranty and product liability costs; maintaining QA and traceability is critical.
  • Competitive substitution and commoditization pressure: competitors or private-label offerings may attempt to compete on price; Omega Flex’s durability depends on sustaining specification-driven differentiation.

📊 Valuation & Market View

Industrial manufacturers like Omega Flex are typically valued on EV/EBITDA and P/E, with revenue quality, operating margin durability, and return on invested capital acting as key drivers. Market expectations often improve when investors see:

  • Resilient gross margins despite material/input fluctuations.
  • Operating leverage supported by efficient utilization and mix.
  • Working capital discipline that reduces earnings volatility.
  • Evidence of specification-driven demand rather than purely end-market cycle exposure.

Because earnings are tied to engineered manufacturing and project-based demand, multiple expansion tends to require confidence in sustained margins and in the durability of compliant, specification-oriented demand.

🔍 Investment Takeaway

OMEGA FLEX is positioned as an engineering-centric manufacturer of code-relevant corrugated metal hose assemblies, with durability derived from high switching costs (specification and re-qualification friction) and compliance/quality credibility. The investment case rests on the structural need for safe, reliable flexible connections in building and industrial piping systems, supported by retrofit demand and standards-driven specification behavior.


⚠ AI-generated — informational only. Validate using filings before investing.

📰 Market News & Coverage

15 Stories Available

Real-time institutional reporting and market updates for OFLX.

zacks.com2026-05-07

OFLX Downgraded to Underperform on Margin Pressure, Weak Cash Flows

Omega Flex's downgrade rating reflects shrinking margins, rising costs and weakening profitability, raising concerns over its near-term growth outlook.

zacks.com2026-05-05

Omega Flex Stock Down 16% as Q1 Earnings Tumble Y/Y on High Costs

OFLX reports a year-over-year decline in Q1 earnings per share as rising material costs and higher expenses weigh on margins.

globenewswire.com2026-04-29

Omega Flex, Inc. Announces First Quarter 2026 Earnings

EXTON, Pa., April 29, 2026 (GLOBE NEWSWIRE) -- Dean W. Rivest, CEO, announced that net sales of Omega Flex, Inc. (the “Company”) for the first quarters of 2026 and 2025 were $23,093,000 and $23,330,000, respectively, decreasing $237,000 or 1.0%.  Net income for the first quarters of 2026 and 2025 were $2,007,000 and $3,568,000, respectively, decreasing $1,491,000 or 41.8%. The decrease in net income was mainly due to rising raw material costs, including tariffs, marketing efforts, and product enhancement and certification related expenses.

defenseworld.net2026-03-31

Omega Flex, Inc. (NASDAQ:OFLX) Short Interest Down 26.8% in March

Omega Flex, Inc. (NASDAQ: OFLX - Get Free Report) saw a significant decline in short interest in March. As of March 13th, there was short interest totaling 56,397 shares, a decline of 26.8% from the February 26th total of 77,084 shares. Based on an average daily trading volume, of 61,536 shares, the short-interest ratio is currently

globenewswire.com2026-03-25

Omega Flex, Inc. Announces Regular Quarterly Dividend for the First Quarter 2026

EXTON, Pa., March 25, 2026 (GLOBE NEWSWIRE) -- Omega Flex, Inc. (the “Company”) (NASDAQ: OFLX) today announced that the Board of Directors declared a regular quarterly dividend of $0.34 per share payable on April 21, 2026, to shareholders of record on April 9, 2026.   In determining the amount of future regular quarterly dividends, the Board will review the cash needs of the Company, and based on results of operations, financial condition, capital expenditure plans, and consideration of possible acquisitions, as well as such other factors as the Board of Directors may consider relevant, determine on a quarterly basis the amount of a regular quarterly dividend.

zacks.com2026-03-10

Omega Flex Q4 Earnings Fall Y/Y on Weak Housing Demand

OFLX reports a year-over-year decline in Q4 earnings as declining housing starts weighed on sales volumes, while higher product development and certification costs pressured profitability.

zacks.com2026-01-29

The Zacks Analyst Blog Johnson & Johnson, Netflix, Arista Networks, Omega and AXIL

Johnson & Johnson leads Zacks' latest Analyst Blog as new research highlights earnings beats, growth drivers, and risks across major and micro-cap stocks.

defenseworld.net2025-12-25

Omega Flex (NASDAQ:OFLX) Share Price Passes Below 200 Day Moving Average – Here’s What Happened

Shares of Omega Flex, Inc. (NASDAQ: OFLX - Get Free Report) passed below its 200-day moving average during trading on Wednesday. The stock has a 200-day moving average of $31.49 and traded as low as $28.51. Omega Flex shares last traded at $29.35, with a volume of 70,522 shares changing hands. Analyst Ratings Changes Separately,

globenewswire.com2025-12-05

Omega Flex, Inc. Announces Regular Quarterly Dividend for the Fourth Quarter 2025

EXTON, Pa., Dec. 05, 2025 (GLOBE NEWSWIRE) -- Omega Flex, Inc. (the “Company”) (NASDAQ: OFLX) today announced that the Board of Directors declared a regular quarterly dividend of $0.34 per share payable on January 7, 2026, to shareholders of record on December 19, 2025.   In determining the amount of future regular quarterly dividends, the Board will review the cash needs of the Company, and based on results of operations, financial condition, capital expenditure plans, and consideration of possible acquisitions, as well as such other factors as the Board of Directors may consider relevant, determine on a quarterly basis the amount of a regular quarterly dividend.

zacks.com2025-11-04

Omega Flex's Q3 Earnings Slip Y/Y Due to Elevated Costs

OFLX's Q3 earnings and revenues decline year over year as higher staffing costs and tariffs pressure margins, while weak housing demand keep sales under pressure despite a solid cash position.

globenewswire.com2025-09-12

Omega Flex, Inc. Announces Regular Quarterly Dividend for the Third Quarter 2025

EXTON, Pa., Sept. 12, 2025 (GLOBE NEWSWIRE) -- Omega Flex, Inc. (the “Company”) (NASDAQ: OFLX) today announced that the Board of Directors declared a regular quarterly dividend of $0.34 per share payable on October 8, 2025, to shareholders of record on September 25, 2025. In determining the amount of future regular quarterly dividends, the Board will review the cash needs of the Company, and based on results of operations, financial condition, capital expenditure plans, and consideration of possible acquisitions, as well as such other factors as the Board of Directors may consider relevant, determine on a quarterly basis the amount of a regular quarterly dividend.

seekingalpha.com2025-08-07

Omega Flex: A Robust Business, But Fairly Valued

Omega Flex delivered solid H1 results, with stable revenues and strong free cash flow, fully covering its dividend payouts. The company boasts a fortress-like balance sheet, holding over $50 million in cash and zero debt, supporting financial stability. Despite a reasonable valuation and niche market strength, shares trade at about 20x earnings and a double-digit EV/EBITDA, limiting upside.

zacks.com2025-08-05

OFLX's Q2 Earnings Slip Y/Y Amid Housing Market Slowdown

Despite higher sales, Omega Flex sees a year-over-year drop in Q2 earnings as rising costs and a weak housing market pressured margins.

fool.com2025-07-31

Omega Flex (OFLX) Q2 Revenue Rises 4%

Omega Flex (OFLX -0.96%), a supplier of flexible metal hoses and piping systems for construction, medical, and industrial end markets, released its second quarter 2025 financial results on July 30, 2025. The earnings announcement showed revenue (GAAP) of $25.5 million, up 3.7% from the prior year.

globenewswire.com2025-07-30

Omega Flex, Inc. Announces Second Quarter 2025 Earnings

EXTON, Pa., July 30, 2025 (GLOBE NEWSWIRE) -- Dean W. Rivest, CEO, announced that net sales of Omega Flex, Inc. (the “Company”) for the first six months of 2025 and 2024 were $48,855,000 and $49,836,000, respectively, decreasing $981,000 or 2.0%.  Net Sales for the three months ended June 30, 2025 were 3.7% higher than the second quarter of 2024.

📊 AI Financial Analysis

Powered by StockMarketInfo
Earnings Data: Q Ending 2026-03-31

"OFLX reported Q1 2026 revenue of $23.09M and net income of $2.08M (EPS $0.21). On a YoY basis, revenue was slightly lower vs Q1 2025 ($23.09M vs $23.33M, -1.1%), while net income rose ($2.08M vs $3.57M, -41.8%), indicating earnings pressure despite roughly flat top-line. On a QoQ basis, revenue declined from Q4 2025 ($25.21M to $23.09M, -8.4%) and net income also fell ($3.42M to $2.08M, -39.2%). Profitability contracted across the quarter: gross margin dropped to 56.7% from 44.3% in Q4, but net margin declined to 9.0% from 13.5% as operating income and below-the-line items weakened (operating margin 10.0% vs 15.8%). Over the last four quarters, margins appear volatile—strong Q2/Q3 and Q4 performance was not sustained into Q1. Cash flow quality was mixed. Q1 operating cash flow was only $0.61M and free cash flow was negative (-$0.10M) after capex, despite continued dividend payments of $3.43M (implying payout pressure versus operating cash). Balance sheet resilience remains strong: cash was $49.8M and net debt was deeply negative (~-$45.2M), with equity broadly stable (~$82.6M). Total shareholder return is moderate: price is up 11.5% over 1Y (below the >20% momentum threshold) with a low dividend yield (~1.1%)."

Revenue Growth

Caution

Revenue was -1.1% YoY (Q1 2026: $23.09M vs $23.33M) and -8.4% QoQ (vs Q4 2025: $25.21M), indicating mild contraction and a softer sequential trajectory.

Profitability

Neutral

Net income fell -41.8% YoY and -39.2% QoQ. Net margin contracted to 9.0% in Q1 2026 from 13.5% in Q4 2025; operating margin also declined (10.0% vs 15.8%). Margins were volatile over the last four quarters.

Cash Flow Quality

Caution

Operating cash flow in Q1 2026 was low ($0.61M) and free cash flow turned negative (-$0.10M) despite positive net income. Dividends were paid (-$3.43M), suggesting near-term cash coverage is weaker than earnings alone would imply.

Leverage & Balance Sheet

Good

Strong liquidity with cash $49.8M and net debt around -$45.2M. Total assets were stable-to-up slightly vs prior quarters, and equity remained resilient (~$82.6M in Q1 2026).

Shareholder Returns

Fair

Price appreciation was moderate (+11.53% 1Y) with a low dividend yield (~1.1%). No evidence of strong buyback-driven compounding from the provided cash flow (repurchases = $0).

Analyst Sentiment & Valuation

Neutral

No price target provided. Valuation metrics shown indicate elevated earnings multiple (price/earnings ~37.7), while free cash flow was negative in Q1 2026, adding uncertainty to forward value.

Disclaimer:This analysis is AI-generated for informational purposes only. Accuracy is not guaranteed and this does not constitute financial advice.

Fundamentals Overview

Loading fundamentals overview...

📋 Official Regulatory 10-K / 10-Q SEC Filings

Direct authenticated documentation links to audited SEC database reports for OFLX.

SEC EDGAR Live Feed
Loading financial data and tables...
📁

SEC Filings (OFLX)

© 2026 Stock Market Info — Omega Flex, Inc. (OFLX) Financial Profile