Universal Display Corporation

Universal Display Corporation (OLED) Market Cap

Universal Display Corporation has a market capitalization of $4.03B.

Price: $86.11

-4.09 (-4.53%)

Market Cap: 4.03B

NASDAQ · time unavailable

CEO: Steven V. Abramson

Sector: Technology

Industry: Hardware, Equipment & Parts

IPO Date: 1996-04-11

Website: https://oled.com

Universal Display Corporation (OLED) - Company Information

Market Cap: 4.03B|Sector: Technology

Company Profile

Universal Display Corporation engages in the research, development, and commercialization of organic light emitting diode (OLED) technologies and materials for use in display and solid-state lighting applications. It owns, exclusively licenses, or has sole rights to sublicense approximately 5,500 issued and pending patents worldwide. The company supplies its proprietary UniversalPHOLED materials to display and lighting manufacturers, and others. It is also involved in the research, development, and commercialization of other OLED device and manufacturing technologies, including FOLED that are flexible OLEDs for the fabrication of OLEDs on flexible substrates; OVJP, an organic vapor jet printing technology; thin-film encapsulation technology for the packaging of flexible OLEDs and other thin-film devices, as well as for use as a barrier film for plastic substrates; and UniversalP2OLED, which are printable phosphorescent OLEDs. In addition, the company provides technology development and support services, including third-party collaboration and support to third parties for the commercialization of their OLED products. Further, it provides contract research services in the areas of chemical materials synthesis research, development, and commercialization for non-OLED applications. Universal Display Corporation was founded in 1985 and is headquartered in Ewing, New Jersey.

Analyst Sentiment

84%
Strong Buy

From 9 Active Polls

1Y Forecast: $141.00

▲ +63.7% Potential Upside

Consensus Target Metrics

Low Bound

$120

Median

$135

High Bound

$168

Average

$141

Price & Moving Averages

Loading chart...

🎯 Wall Street Analyst Intelligence Report

1-Year structural target targets, chart projections, and sentiment maps.

Average 1Y Target
$141.00
▲ +63.74% Upside
Low Target
$120.00
39% Risk
Median Target
$135.00
57% Mid
High Target
$168.00
95% Max
Consensus
Buy
12 / 19 Buys

Consensus Trend Projection

Trailing closures vs. 12-month metrics map.

Analyst Vote Distribution

Aggregate institutional coverage sentiment weights.

📊 Historical Valuation Multiples

Real-time Trailing Twelve Month (TTM) momentum side-by-side with discrete quarterly metrics.

Fiscal QuarterTTMQ1 2026Q4 2025Q3 2025Q2 2025Q1 2025Q4 2024Q3 2024Q2 2024
Period EndingTrailing 12MMar 31, 2026Dec 31, 2025Sep 30, 2025Jun 30, 2025Mar 31, 2025Dec 31, 2024Sep 30, 2024Jun 30, 2024
Market Cap ($M)4,0264,3155,5546,8307,3516,6356,9529,9799,919
Enterprise Value ($M)3,8884,1785,4596,7297,2736,4966,8729,9209,848
Price to Earnings Ratio (P/E)18.9930.0520.9338.7927.3225.7437.8337.3147.38
Price/Earnings-to-Growth Ratio (PEG)0.888.2310.4891.8018.94
Price to Sales Ratio (P/S)6.4330.3432.1248.9242.7939.9042.8361.7462.58
Price to Book Ratio (P/B)2.382.533.153.914.294.004.306.296.50
Price to Free Cash Flow Ratio (P/FCF)16.9843.04368.7780.99196.25379.06315.47150.67171.36
Enterprise Value to Sales (EV/Sales)29.3831.5748.2042.3439.0742.3461.3762.13
Enterprise Value to EBITDA (EV/EBITDA)14.2874.1967.53121.9290.9379.84108.23127.25145.97
Debt to Equity Ratio-0.500.010.020.010.010.010.010.010.01

OLED Growth Runway Model

Standard long term linear growth fade

Multi-Stage Discounted Cash Flow Sandbox

Market Price$86.11
Intrinsic Value$54.97
Market Alignment
Overvalued by 36.2%relative to calculated intrinsic value
9.00%
Exp: 0%0%
i

Growth runway slowdown

This value provides a time window for the growth rate to decline beyond Stage 1 toward the terminal rate. Longer windows are most useful for companies with high growth starting conditions or strong competitive advantages. This option stretches out the growth rate slowdown across 5, 10, or 15-year steps. A high-growth starting condition (exceeding a 25% initial growth rate) automatically applies a curve decay to simulate realistic, rapid market saturation.
i

Terminal growth rate

With long-term inflation between 3-5%, revenue must grow by that baseline to maintain flat real-world market share. This value sets the permanent terminal growth rate to factor into the valuation beyond the growth slowdown runway toward maturity.

3-Stage Financial Runway Horizon

🧠 Perpetuity Horizon Engine (Stage 3: Post-2035)

Terminal FCF Base$0.20B
Perpetuity TV Value$3.70B
Discounted TV (PV)$1.56B
TV Weighting %57.5%
⚠️
Financial Model Disclaimer & Risk Disclosure: This interactive scenario simulator is an educational sandbox provided strictly for informational and analytical research purposes. Core historical financial statements and consensus estimates are sourced directly via Financial Modeling Prep (FMP). All downstream outputs are entirely deterministic, hypothetical projections generated by combining automated mathematical formulas (including linear interpolation and Gaussian bell-curve decay models) with user-selected variables and third-party financial data inputs. Users assume all liability for trading decisions executed based on these sandbox calculations.

📘 Full Research Report

ℹ️

AI-Generated Research: This report is for informational purposes only.

📘 UNIVERSAL DISPLAY CORP (OLED) — Investment Overview

🧩 Business Model Overview

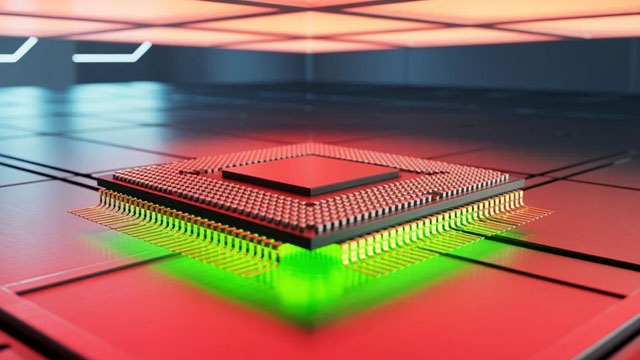
Universal Display Corp (UDC) participates in the OLED value chain through two tightly linked channels: (1) the supply of proprietary OLED materials and (2) the licensing of underlying phosphorescent OLED technology. UDC’s technology enables efficient light emission in OLED stacks by leveraging advanced emitter concepts and device-architecture know-how.

Customer adoption typically follows a design-and-qualification pathway: display and lighting manufacturers incorporate UDC’s materials and/or pay for technology rights that support device performance targets (efficiency, brightness, lifetime, and color quality). Once embedded into product platforms, UDC benefits from recurring royalty economics tied to OLED production volumes alongside ongoing materials demand for qualifying product generations.

💰 Revenue Streams & Monetisation Model

UDC’s monetisation is primarily driven by two revenue types:

  • Technology licensing (royalties): Royalties are generated when customers manufacture OLED devices using UDC’s licensed intellectual property. This portion tends to be structurally recurring because it scales with OLED adoption and customer platform throughput.
  • Materials sales (phosphorescent components): UDC supplies key materials used in OLED stacks. Materials revenue is more directly tied to unit volumes and product refresh cycles, with pricing and mix linked to performance requirements and qualification status.

Margin structure typically reflects a blend of high incremental economics from IP licensing and product/mix-dependent economics from materials. Licensing revenue often carries stronger incremental margins because it does not require proportionate increases in manufacturing capacity, while materials revenue contributes to total gross profit through volumes and product mix.

🧠 Competitive Advantages & Market Positioning

UDC’s moat is anchored less in scale manufacturing and more in intellectual property and performance-critical device chemistry. The company’s competitive position is supported by:

  • Intangible asset moat (patent and process portfolio): UDC’s core technology rights and associated know-how create legal and technical barriers that make it difficult for competitors to replicate performance without access to comparable intellectual property or equivalent emission physics.
  • Qualification and design-in stickiness (practical switching costs): OLED materials and device technologies require engineering validation, reliability testing, and production ramp integration. Once a supplier is qualified for a product platform, switching carries technical risk and time/cost burdens.
  • Performance-positioning: OLED efficiency and lifetime are foundational economics for display makers. UDC’s technology and materials are positioned around meeting stringent device targets that are difficult to match using generic alternatives.

Competitive benchmarking (primary rivals):

  • Merck KGaA — prominent OLED materials supplier competing in the materials channel (hosts/emitter-related offerings), with emphasis on supplying chemicals used across OLED architectures.
  • Samsung Display — vertically integrated display manufacturer that may develop and commercialize internal know-how, competing for device-level technology utilization and platform decisions.
  • LG Display — similarly vertically integrated competitor influencing technology choices and supplier qualification cycles at the device/platform level.

Compared with these rivals, UDC’s focus is narrower and more IP-centric: it monetises technology through licensing while also supplying critical materials. That structure differs from materials-only competitors and from vertically integrated display OEMs whose primary business is device production rather than monetisation of external technology rights.

🚀 Multi-Year Growth Drivers

UDC’s growth profile is tied to the long-run substitution of display technologies and to incremental expansion of OLED into additional form factors. Over a 5–10 year horizon, key drivers include:

  • OLED penetration expansion vs. LCD: OLED’s competitive attributes—contrast, color performance, and design flexibility—support ongoing adoption across televisions and premium mobile devices.
  • High-end product refresh cycles and feature intensification: More demanding brightness, efficiency, and lifetime requirements raise the value of proven emitter/technology solutions and reinforce supplier qualification dynamics.
  • Growth in specialty displays: OLED adoption in automotive, industrial, and microdisplay applications can enlarge the total addressable market for both materials and licensed architectures.
  • Platform share through design-in economics: As customers standardize on OLED technology stacks, royalty-bearing technology rights can scale with device output, while materials usage persists for qualifying generations.

⚠ Risk Factors to Monitor

  • Patent and IP durability risk: Technology licensing economics depend on sustained IP strength, enforceability, and continued relevance to device architectures. Any weakening of the effective patent estate—through expiration, invalidation, or licensing scope restrictions—can reduce royalty headroom.
  • Technology substitution risk: Advances in emission mechanisms or device architectures could reduce the relative utility of specific licensed approaches, potentially shifting customer preference toward alternative technical implementations.
  • Customer concentration and bargaining leverage: Licensing and materials demand are influenced by major OEM and panel supplier platform decisions. Concentrated relationships can increase negotiating pressure.
  • Litigation and royalty disputes: IP-driven business models face legal and commercial disputes over scope, interpretation, and royalty calculations.
  • Supply chain and qualification cycle risk (materials channel): Materials revenue can be impacted by customer qualifying schedules, substitution testing, and changes in formulation requirements.

📊 Valuation & Market View

Markets typically value OLED/IP-driven businesses using a blend of revenue-quality assessment and cash-flow durability rather than purely simple growth multiples. Key valuation frameworks often include:

  • EV/EBITDA or earnings power: Investors focus on sustainable margin structure and the stability of royalty-linked profitability.
  • Discounted economics of licensed IP: Royalty streams are evaluated based on OLED penetration assumptions, effective royalty rates, and IP longevity.
  • Scenario-based multiples tied to adoption: Because licensing scales with device output, valuation is sensitive to OLED unit growth, market mix, and the durability of design-in.

Drivers that typically move the needle include royalty scope clarity, evidence of continued technology relevance across device generations, and materials growth tied to platform standardization.

🔍 Investment Takeaway

UDC’s long-term investment case is centered on a hard-to-copy combination of intellectual property and practical switching costs created by OLED qualification and performance validation requirements. The company’s monetisation model—technology licensing with scalable recurring economics alongside materials sales—links financial outcomes to continued OLED adoption and platform standardization. The principal diligence focus should remain on IP durability, scope defensibility, and ongoing technical relevance of its licensed and material-enabled emission technologies.


⚠ AI-generated — informational only. Validate using filings before investing.

📰 Market News & Coverage

15 Stories Available

Real-time institutional reporting and market updates for OLED.

businesswire.com2026-06-04

Universal Display Corporation to Hold Virtual 2026 Annual Meeting of Shareholders

EWING, N.J.--(BUSINESS WIRE)---- $OLED #OLED--Universal Display Corporation to hold virtual 2026 Annual Meeting of Shareholders on June 18, 2026, at 10:00 a.m. ET.

gurufocus.com2026-06-02

Universal Display Corporation Expands China Presence with Grand Opening of Chengdu OLED Technology and Innovation Center

[url="]Universal Display Corporation[/url] (UDC) (Nasdaq: OLED), a global leader in energy-efficient OLED technologies and materials, today announced the grand

businesswire.com2026-06-02

Universal Display Corporation Expands China Presence with Grand Opening of Chengdu OLED Technology and Innovation Center

EWING, N.J. & CHENGDU, China--(BUSINESS WIRE)---- $OLED #OLED--UDC announced the grand opening of its OLED Technology and Innovation Center in Chengdu, China.

gurufocus.com2026-05-22

A Look at Universal Display Corp (OLED) After 3.1% Gain -- GF Value $152.63 vs Price $94.31

On May 22, 2026, Universal Display Corp (OLED) shares rose 3.1% to $94.31. The stock has experienced a volatile year, with a 52-week range between $83.64 and $1

gurufocus.com2026-05-20

A Look at Universal Display Corp (OLED) After 3.5% Gain -- GF Value $152.58 vs Price $90.69

On May 20, 2026, Universal Display Corp (OLED) shares rose 3.5% today, bringing the current price to $90.69. The stock has experienced a range between $83.64 an

businesswire.com2026-05-04

Universal Display Corporation Announces Participation at Upcoming Conferences

EWING, N.J.--(BUSINESS WIRE)---- $OLED #OLED--UDC announced its participation in investor and industry conferences taking place in May, June and July 2026.

zacks.com2026-05-04

International Markets and Universal Display (OLED): A Deep Dive for Investors

Examine the evolution of Universal Display's (OLED) overseas revenue trends and their effects on Wall Street's forecasts and the stock's prospects.

zacks.com2026-05-01

Universal Display Q1 Earnings Miss Estimate on Weak Demand Environment

OLED Q1 earnings and revenues miss as weak demand, mix shifts and lower volumes weigh, prompting a 2026 revenue outlook cut amid uncertainty.

fool.com2026-05-01

Why Universal Display Stock Jumped 13.7% Friday Morning

Universal Display missed earnings estimates by a mile and cut its guidance. So why did the stock jump 14%?

seekingalpha.com2026-04-30

Universal Display Corporation (OLED) Q1 2026 Earnings Call Transcript

Universal Display Corporation (OLED) Q1 2026 Earnings Call Transcript

zacks.com2026-04-30

Universal Display (OLED) Reports Q1 Earnings: What Key Metrics Have to Say

While the top- and bottom-line numbers for Universal Display (OLED) give a sense of how the business performed in the quarter ended March 2026, it could be worth looking at how some of its key metrics compare to Wall Street estimates and year-ago values.

zacks.com2026-04-30

Universal Display Corp. (OLED) Q1 Earnings and Revenues Miss Estimates

Universal Display Corp. (OLED) came out with quarterly earnings of $0.76 per share, missing the Zacks Consensus Estimate of $1.13 per share. This compares to earnings of $1.35 per share a year ago.

businesswire.com2026-04-30

Universal Display Corporation Announces $400 Million Share Repurchase Authorization and Quarterly Cash Dividend of $0.50 per Share

EWING, N.J.--(BUSINESS WIRE)---- $OLED #OLED--Universal Display Corporation today announced a $400 million share repurchase authorization and 2Q2026 cash dividend of $0.50 per share.

businesswire.com2026-04-30

Universal Display Corporation Announces First Quarter 2026 Financial Results

EWING, N.J.--(BUSINESS WIRE)---- $OLED #OLED--Universal Display Corporation (Nasdaq: OLED) today reported financial results for the first quarter ended March 31, 2026.

businesswire.com2026-04-29

Universal Display Corporation to Present High-Efficiency Blue Paper and Showcase OLED Technology Advancements at SID Display Week 2026

EWING, N.J.--(BUSINESS WIRE)---- $OLED #OLED--UDC announced that it will present an invited paper on high-efficiency blue and showcase OLED technology advancements at SID Display Week 2026.

📊 AI Financial Analysis

Powered by StockMarketInfo
Earnings Data: Q Ending 2026-03-31

"OLED reported Q1 2026 revenue of $142.2M and net income of $35.9M (EPS $0.76). On a YoY basis, revenue fell from $166.3M in Q1 2025 to $142.2M, a decline of -14.6%, while net income dropped from $64.4M to $35.9M, a -44.3% decline. Sequentially (QoQ), revenue decreased from $172.9M in Q4 2025 to $142.2M, -17.8%, and net income declined from $66.3M to $35.9M, -45.9%, indicating a sharp downshift in profitability. Margins weakened over the last four quarters: gross margin slipped to 74.6% in Q1 2026 from ~77% in Q1–Q2 2025, and net margin fell to 25.2% from 38.4% in Q4 2025. Operating cash flow remained strong at $108.9M, supporting free cash flow of $100.3M; however, Q1 cash flow was accompanied by heavy investing cash outflows for purchases of investments and continued shareholder payouts. Shareholder returns appear supported by capital returns: the company repurchased $67.1M of stock in the quarter and paid $23.5M in dividends. Despite buybacks/dividends, market performance has been negative over the last year (-12.4%). With dividend yield ~0.54% and valuation multiples elevated (P/E ~30x), the setup looks more defensive than momentum-driven."

Revenue Growth

Neutral

Q1 2026 revenue of $142.2M was -14.6% YoY (vs. $166.3M) and -17.8% QoQ (vs. $172.9M), signaling a clear demand/profitability reset.

Profitability

Neutral

Net income declined -44.3% YoY and -45.9% QoQ. Net margin compressed to 25.2% from 31.5% (Q3 2025) and 38.4% (Q4 2025), indicating contracting earnings power.

Cash Flow Quality

Positive

Q1 2026 operating cash flow was $108.9M and free cash flow $100.3M, both strong in absolute terms. Capital returns continued (buybacks and dividends), though investing cash flows were volatile.

Leverage & Balance Sheet

Positive

Balance sheet remains highly liquid: cash + short-term investments were $516.4M, and net debt is negative (-$159M). Total assets declined to $1.89B QoQ, but equity remains sizeable.

Shareholder Returns

Caution

Capital returns in Q1 2026 were notable (repurchases $67.1M; dividends $23.5M). However, the stock is down -12.4% over the last year and dividend yield is modest (~0.54%).

Analyst Sentiment & Valuation

Caution

Consensus price target is $157.5 vs. current ~$99.55 (implied upside ~58%). While targets are supportive, valuation remains rich (P/E ~30x; other multiples elevated), and near-term fundamentals are weakening.

Disclaimer:This analysis is AI-generated for informational purposes only. Accuracy is not guaranteed and this does not constitute financial advice.

Fundamentals Overview

Loading fundamentals overview...

Universal Display reported Q1 2026 softness: revenue fell to $142M (-14% YoY) with gross margin at 75% (~-200 bps) and operating margin at ~30% (~-1200 bps), driven by volume/mix shifts and higher input costs. Management revised full-year revenue guidance to $630M–$670M (from $650M–$700M), citing reduced near-term visibility from macro pressures, smartphone demand softness, and ongoing China lumpiness tied partly to tariff-driven prior-year buying. The company sees capacity plans as intact, expecting sequentially higher Q2 revenue and a stronger second half, with ~mid-to-high 40% of revenues in 1H. Catalysts center on phosphorescent blue: up to 25% energy-efficiency potential and SID Display Week technical updates, plus system-level architecture adoption (tandem/hybrid, PSF) evidenced by Visionox’s BT2020 green PSF use and LG Display hybrid tandem validation. Main risk is extended adoption timelines for blue hybrids and continued smartphone/mid-low-end exposure.

AI IconGrowth Catalysts

  • Phosphorescent blue roadmap: conviction it can deliver up to an initial 25% improvement in OLED panel energy efficiency; further technical detail to be shared at SID Display Week next week.
  • System-level architecture push (tandem/hybrid, advanced pixel layouts, PSF) emphasizing energy efficiency and broader performance requirements (brightness, power efficiency, lifetime, color).
  • Commercial PSF milestone: phosphorescent material incorporated into Visionox’s first commercial green PSF product targeting BT2020 specifications.

Business Development

  • Long-term agreements announced in Q1 with Tianma and LG Display.
  • Cited commercial/validated hybrid example: LG Display’s May 2025 SID Display Week showcasing a hybrid tandem tablet using UDC material (1 fluorescent layer + 1 phosphorescent layer) with commercial equipment validation.

AI IconFinancial Highlights

  • Revenue: $142M vs $166M prior-year (-14% YoY). Material volumes down ~4% YoY; revenue decline driven by customer mix and tariff-related purchasing in the prior-year Chinese period plus softer macro demand.
  • Gross margin: 75% in Q1 2026 vs 77% in Q1 2025 (~-200 bps YoY); still within full-year guidance range of 74%–76%.
  • Operating margin: ~30% vs ~42% in Q1 2025 (~-1200 bps YoY) due to lower volumes, mix, and higher input costs.
  • Net income: $36M or $0.76 diluted EPS vs $64M or $1.35 in Q1 2025.
  • Tax rate: Q1 effective tax rate 21%; full-year effective tax rate now expected ~20%.
  • Nonoperating items: $3M FX loss on tax receivable (Korean won) and $2.7M investment loss on marketable equity securities.

AI IconCapital Funding

  • Cash & investments: approx. $911M at end of March 2026.
  • Share repurchases: repurchased ~633,000 shares for ~$66M in the quarter; completed prior $100M authorization total repurchases of ~924,000 shares.
  • Capital return: authorized new $400M share repurchase program following full use of prior $100M authorization; declared cash dividend of $0.50/share for Q2 2026.

AI IconStrategy & Ops

  • Operating model: lean SG&A maintained while remaining cautious on spending; OpEx growth trending from February’s mid- to high-single-digit toward ‘mid’ for the year.
  • R&D acceleration: AI/ML applied at greater scale; cited ability to predict thermal processing stability up to 10,000x faster than traditional density functional theory with near-comparable accuracy.
  • Materials program alignment: blue development program aligned to increasingly complex phosphorescent-blue specifications; longer development path acknowledged but commercialization conviction unchanged.

AI IconMarket Outlook

  • Full-year revenue guidance revised to $630M–$670M from $650M–$700M.
  • Second-quarter revenue expected sequentially higher than Q1; second half expected stronger than first half.
  • Square-area growth assumption updated: now projecting roughly ~2% growth in OLED square area for 2026.
  • Revenue phasing expectation: mid- to high-40% of revenues in first half, balance in second half (implies continued ramp into 2H).
  • Materials-to-royalty/licensing revenue mix expected to average closer to ~1.3:1 for full year (current Q1 ratio ~1.5:1).

AI IconRisks & Headwinds

  • Lower near-term visibility from softer consumer demand, higher component costs, and supply constraints; smartphone cuts accelerated.
  • China demand purchasing volatility/lumpiness; tariff-driven stockpiling effects distorted prior-year comparisons.
  • Smartphone mix exposure: OLED has >65% penetration with exposure extending into mid and some low-end models affected by memory concerns.
  • Execution/ramp risk: hybrid-blue adoption timeline delayed due to more complex material matching when combining fluorescent and phosphorescent layers.

Q&A: Analyst Interest

  • Topic: Updated 2026 demand/mix and smartphone pressure transmission: guidance reflects a ~2% square-area growth outlook, while capacity plans remain unchanged. Management said OLED penetration puts mid/low-end at risk despite premium model insulation, and noted exposure to memory concerns increased over the last ~2.5 months.
  • Topic: China weakness and tariff stockpiling mechanics: management stated China revenues are historically ‘lumpy’ and that Q1 softness reflected both end-market demand/share dynamics and tariff-related purchasing distortion. Largest stockpiling occurred in April, with some toward end of Q1, following the U.S. tariff announcement.
  • Topic: Hybrid architectures and blue adoption timeline economics: management explained hybrid as phosphorescent + fluorescent layers to combine phosphorescent efficiency with fluorescence color/lifetime. They said complexities in matching multiple materials delay timelines, but addressed ‘when not if’ deployment and cited LG Display hybrid tandem validation.

Sentiment: CAUTIOUS

Note: This summary was synthesized by AI from the OLED Q1 2026 earnings transcript. Financial data is complex; please verify all metrics against official SEC filings before making investment decisions.

📋 Official Regulatory 10-K / 10-Q SEC Filings

Direct authenticated documentation links to audited SEC database reports for OLED.

SEC EDGAR Live Feed
Loading financial data and tables...
📁

SEC Filings (OLED)

© 2026 Stock Market Info — Universal Display Corporation (OLED) Financial Profile