PulteGroup, Inc.

PulteGroup, Inc. (PHM) Market Cap

PulteGroup, Inc. has a market capitalization of $22.55B.

Price: $118.40

0.18 (0.15%)

Market Cap: 22.55B

NYSE · time unavailable

CEO: Ryan R. Marshall

Sector: Consumer Cyclical

Industry: Residential Construction

IPO Date: 1980-03-17

Website: https://pultegroupinc.com

PulteGroup, Inc. (PHM) - Company Information

Market Cap: 22.55B|Sector: Consumer Cyclical

Company Profile

PulteGroup, Inc., through its subsidiaries, primarily engages in the homebuilding business in the United States. It acquires and develops land primarily for residential purposes; and constructs housing on such land. The company also offers various home designs, including single-family detached, townhomes, condominiums, and duplexes under the Centex, Pulte Homes, Del Webb, DiVosta Homes, American West, and John Wieland Homes and Neighborhoods brand names. As of December 31, 2021, it controlled 228,296 lots, of which 109,078 were owned and 119,218 were under land option agreements. In addition, the company arranges financing through the origination of mortgage loans primarily for homebuyers; sells the servicing rights for the originated loans; and provides title insurance policies, and examination and closing services to homebuyers. PulteGroup, Inc. was formerly known as Pulte Homes, Inc. and changed its name to PulteGroup, Inc. in March 2010. The company was founded in 1950 and is headquartered in Atlanta, Georgia.

Analyst Sentiment

70%
Buy

From 16 Active Polls

1Y Forecast: $141.22

▲ +19.3% Potential Upside

Consensus Target Metrics

Low Bound

$115

Median

$145

High Bound

$162

Average

$141

Price & Moving Averages

Loading chart...

🎯 Wall Street Analyst Intelligence Report

1-Year structural target targets, chart projections, and sentiment maps.

Average 1Y Target
$141.22
▲ +19.27% Upside
Low Target
$115.00
-3% Risk
Median Target
$145.00
22% Mid
High Target
$162.00
37% Max
Consensus
Hold
19 / 44 Buys

Consensus Trend Projection

Trailing closures vs. 12-month metrics map.

Analyst Vote Distribution

Aggregate institutional coverage sentiment weights.

📊 Historical Valuation Multiples

Real-time Trailing Twelve Month (TTM) momentum side-by-side with discrete quarterly metrics.

Fiscal QuarterTTMQ1 2026Q4 2025Q3 2025Q2 2025Q1 2025Q4 2024Q3 2024Q2 2024
Period EndingTrailing 12MMar 31, 2026Dec 31, 2025Sep 30, 2025Jun 30, 2025Mar 31, 2025Dec 31, 2024Sep 30, 2024Jun 30, 2024
Market Cap ($M)22,55422,54722,76525,96821,01220,77222,25329,67822,260
Enterprise Value ($M)23,15223,14523,15926,76822,11621,77222,93930,53223,147
Price to Earnings Ratio (P/E)11.1116.2411.3511.088.639.936.0910.636.88
Price/Earnings-to-Growth Ratio (PEG)2.43467.450.660.610.42
Price to Sales Ratio (P/S)1.346.614.945.904.775.344.526.634.84
Price to Book Ratio (P/B)1.751.741.752.021.671.691.842.571.98
Price to Free Cash Flow Ratio (P/FCF)13.72167817.1430.7739.8883.06198.5440.9771.1457.62
Enterprise Value to Sales (EV/Sales)6.795.026.085.025.594.666.825.03
Enterprise Value to EBITDA (EV/EBITDA)8.3249.7933.4633.7326.5730.8419.0032.8921.63
Debt to Equity Ratio0.220.190.190.180.190.180.190.200.21

PHM Growth Runway Model

Standard long term linear growth fade

Multi-Stage Discounted Cash Flow Sandbox

Market Price$118.40
Intrinsic Value$192.30
Market Alignment
Undervalued by 62.4%relative to calculated intrinsic value
9.00%
Exp: -2%-2%
i

Growth runway slowdown

This value provides a time window for the growth rate to decline beyond Stage 1 toward the terminal rate. Longer windows are most useful for companies with high growth starting conditions or strong competitive advantages. This option stretches out the growth rate slowdown across 5, 10, or 15-year steps. A high-growth starting condition (exceeding a 25% initial growth rate) automatically applies a curve decay to simulate realistic, rapid market saturation.
i

Terminal growth rate

With long-term inflation between 3-5%, revenue must grow by that baseline to maintain flat real-world market share. This value sets the permanent terminal growth rate to factor into the valuation beyond the growth slowdown runway toward maturity.

3-Stage Financial Runway Horizon

🧠 Perpetuity Horizon Engine (Stage 3: Post-2035)

Terminal FCF Base$2.62B
Perpetuity TV Value$49.23B
Discounted TV (PV)$20.79B
TV Weighting %55.9%
⚠️
Financial Model Disclaimer & Risk Disclosure: This interactive scenario simulator is an educational sandbox provided strictly for informational and analytical research purposes. Core historical financial statements and consensus estimates are sourced directly via Financial Modeling Prep (FMP). All downstream outputs are entirely deterministic, hypothetical projections generated by combining automated mathematical formulas (including linear interpolation and Gaussian bell-curve decay models) with user-selected variables and third-party financial data inputs. Users assume all liability for trading decisions executed based on these sandbox calculations.

📘 Full Research Report

ℹ️

AI-Generated Research: This report is for informational purposes only.

📘 PULTEGROUP INC (PHM) — Investment Overview

🧩 Business Model Overview

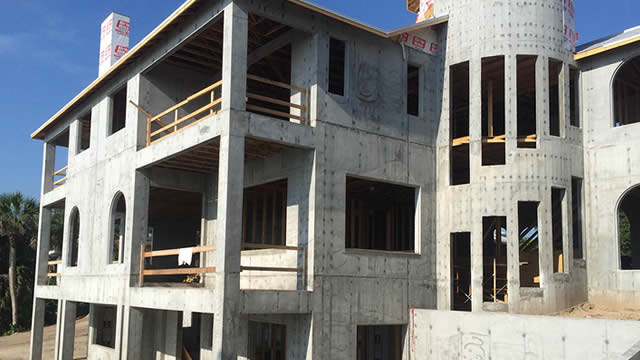
PulteGroup builds and sells homes through a vertically integrated development-and-construction platform. The company acquires and entitles land, develops it into viable homebuilding communities (including infrastructure and lot preparation), and then constructs homes to buyer specifications and market demand. Revenue is realized primarily at home closings, with additional income tied to community/lots and related activity. The core operational loop is land sourcing → planning/entitlement → development → construction → sale, with manufacturing-like execution that converts housing demand into cash flows over a relatively short build cycle once communities are underway.

💰 Revenue Streams & Monetisation Model

The monetisation profile is predominantly transactional rather than recurring:

  • Homebuilding revenue (primary): Recognized at closing for contracted homes. Margin depends on land cost basis, construction cost productivity, pricing power, incentives, and the mix of home types.
  • Community and land-related revenue (secondary): Includes activity tied to finished lots/communities and occasional ancillary fees, often less significant than home sales but helpful for smoothing variability.

Primary margin drivers center on (1) land economics and inventory management, (2) labor productivity and construction efficiency, (3) material and subcontractor pricing discipline, and (4) utilization of overhead across active communities. Because homebuilders carry meaningful fixed and semi-fixed cost structures (field supervision, operating overhead, and community development costs), margin tends to be sensitive to absorption when volumes fluctuate.

🧠 Competitive Advantages & Market Positioning

Homebuilding is competitive and cyclical, but PulteGroup can sustain an edge through a set of cost and supply advantages rather than customer “switching costs” or recurring revenue moats.

Key competitive advantages

  • Land acquisition and development capability (cost advantage + execution): Competence in sourcing buildable land, managing entitlements, and developing communities improves the effective cost of lots and the timing of inventory readiness. This can reduce risk during downturns by improving the cost basis and controllability of inventory.
  • Scale in operating infrastructure (cost of production discipline): Compared with smaller regional builders, larger operators can spread overhead, standardize processes, and negotiate better terms with certain suppliers and trades—supporting resilience when pricing weakens.
  • Community footprint and geographic concentration (operating learning curve): Concentrated presence in select markets can improve permitting familiarity, subcontractor availability, and schedule reliability, supporting better build outcomes versus less established players.

Competitive benchmarking

  • D.R. Horton: Broad national reach with strong scale economics; competes aggressively on price and volume. PulteGroup’s differentiation typically rests more on execution in developed communities and mix within its served markets rather than purely on the largest footprint.
  • Lennar: Known for product and operational approaches that can include design standardization and varied homebuilding strategies. PulteGroup competes in many overlapping geographies but must defend margins through land economics and construction productivity.
  • NVR (and other smaller regional builders): Often demonstrates disciplined land and build execution in specific markets. PulteGroup’s broader community base can provide diversification, though it requires consistent execution across a wide platform.

🚀 Multi-Year Growth Drivers

  • Housing supply constraints and demographic demand: Long-run demand is supported by household formation and replacement needs, while supply constraints have historically limited the responsiveness of housing inventory to demand.
  • Market share capture within constrained local markets: In environments where financing and labor availability limit marginal competitors, operators with superior land pipelines and field execution can capture share as peers rationalize inventory.
  • Community development as a mechanism for turning demand into buildable inventory: Master-planned communities and multi-phase neighborhoods create a pathway to replenish lot supply, enabling multi-year development cycles when capital markets and demand conditions are supportive.
  • Productivity initiatives and build-cycle improvements: Continuous improvement in planning, trade coordination, and construction workflow can translate into better schedule reliability and cost absorption over a full cycle.

⚠ Risk Factors to Monitor

  • Interest-rate and affordability sensitivity: Demand for new homes is closely linked to mortgage affordability and consumer credit conditions; pricing pressure and sales velocity can deteriorate quickly during tightening cycles.
  • Inventory and land carrying risk: Land and development costs are capital-intensive. Poor timing of acquisitions, delays in entitlement, or unfavorable market shifts can pressure returns.
  • Input cost and labor constraints: Material price swings and labor availability can compress margins, especially if pricing resets lag cost changes.
  • Regulatory and permitting exposure: Zoning, permitting lead times, and building code changes can alter feasibility, delay starts, and increase compliance costs.
  • Execution risk: Operational problems in planning, subcontractor performance, or quality control can affect warranty costs, customer satisfaction, and resale value of homes.

📊 Valuation & Market View

Homebuilders are typically valued through earnings power and normalized cash generation, with valuation outcomes driven by expected delivery volumes, margin durability, and capital efficiency. The market often focuses less on “steady-state” growth and more on:

  • Normalization of gross margin across the housing cycle (land cost basis and incentives behavior).
  • Return on invested capital via land development economics and inventory turnover.
  • Balance sheet resilience, including liquidity and how the company manages community development spending through different demand regimes.

Key model sensitivities include assumptions about home price trends, cancellation rates, sales pace, and the ability to control construction costs when the sales environment softens.

🔍 Investment Takeaway

PulteGroup’s long-term investment case rests on land and development execution, scale-driven cost discipline, and community pipeline management that can improve risk-adjusted returns across housing cycles. While the industry lacks a software-like recurring revenue moat, competitive positioning can still be defended through effective cost of supply and operational reliability—attributes that matter most when affordability tightens and selective share gain favors builders with superior inventory economics and execution discipline.


⚠ AI-generated — informational only. Validate using filings before investing.

📰 Market News & Coverage

15 Stories Available

Real-time institutional reporting and market updates for PHM.

marketwatch.com2026-06-01

These home-builder stocks look cheap after Berkshire's ‘vote of confidence' in the sector

Just being cheap isn't enough to attract hot money — there also has to be some belief that Wall Street vultures are circling. But now there's reason to think that, after two years of underperformance, more longer-term investors will be looking for bargains in the home-builder sector.

zacks.com2026-06-01

Here is What to Know Beyond Why PulteGroup, Inc. (PHM) is a Trending Stock

PulteGroup (PHM) has received quite a bit of attention from Zacks.com users lately. Therefore, it is wise to be aware of the facts that can impact the stock's prospects.

fool.com2026-05-29

Lennar vs. D.R. Horton: Which Consumer Stock Is a Better Buy in 2026?

Two homebuilding giants take different paths in scale, strategy, and financial strength, see how their latest numbers stack up for value-focused investors.

businesswire.com2026-05-21

PulteGroup's Second Quarter 2026 Earnings Release and Webcast Conference Call Scheduled for July 22, 2026

ATLANTA--(BUSINESS WIRE)--PulteGroup, Inc. (NYSE: PHM) today announced that it will release its second quarter 2026 financial results before the market opens on Wednesday, July 22, 2026. The Company will hold a conference call to discuss its second quarter results that same day at 8:30 a.m. (ET). A live audio webcast of the call will be available on PulteGroup's website. To listen to the webcast, log on five minutes prior to the call at www.pultegroup.com and select the Events & Presentatio.

gurufocus.com2026-05-20

PulteGroup Inc (PHM) Shares Surge 4.7% -- What GF Score of 95 Tells Investors

On May 20, 2026, PulteGroup Inc (PHM) shares rose 4.7% to a current price of $116.26. This increase comes amidst a 52-week trading range of $95.20 to $144.50, r

zacks.com2026-05-19

Is Trending Stock PulteGroup, Inc. (PHM) a Buy Now?

PulteGroup (PHM) has been one of the stocks most watched by Zacks.com users lately. So, it is worth exploring what lies ahead for the stock.

fool.com2026-05-15

Mortgage Applications Are Up 21% Year Over Year Despite Rising Interest Rates. These Homebuilder Stocks Could Benefit.

One explanation for rising mortgage applications is that many people are tired of waiting for lower rates. Many homebuilders may prosper -- but it may take a while.

youtube.com2026-05-08

Inside Out: Housing Market Fears Abating?

Alex Barron believes the bottom of the housing market is here. He says the "fear factor" from the Iran war has faded at this point as the summer home selling season ramps up.

zacks.com2026-05-08

Is Most-Watched Stock PulteGroup, Inc. (PHM) Worth Betting on Now?

PulteGroup (PHM) has received quite a bit of attention from Zacks.com users lately. Therefore, it is wise to be aware of the facts that can impact the stock's prospects.

247wallst.com2026-05-07

Nvidia Wants Your Next House to be a Mini Data Center

NVIDIA (NASDAQ:NVDA | NVDA Price Prediction) wants the next AI factory to sit in your garage.

youtube.com2026-05-05

Nvidia and PulteGroup are helping this startup put mini data centers on homes

Span, a California-based startup, has developed small, fractional data centers, or “nodes,” called XFRA units. The idea is to take advantage of unused electrical capacity on local grids, which the Span smart panels can pinpoint.

fool.com2026-05-01

Mortgage Rates Just Hit a Four-Week High Thanks to Iran. Are Homebuilder Stocks a Buy on the Dip?

Homebuilders had a rough first quarter. When will sales recover?

businesswire.com2026-04-29

PulteGroup Announces Quarterly Cash Dividend of $0.26 Per Share

ATLANTA--(BUSINESS WIRE)--PulteGroup, Inc. (NYSE: PHM) announced today that its Board of Directors has declared a quarterly dividend of $0.26 per common share payable July 2, 2026, to shareholders of record at the close of business on June 16, 2026. About PulteGroup PulteGroup, Inc. (NYSE: PHM), based in Atlanta, Georgia, is one of America's largest homebuilding companies with operations in more than 45 markets throughout the country. Through its brand portfolio that includes Pulte Homes, Cente.

defenseworld.net2026-04-29

Concurrent Investment Advisors LLC Buys 10,467 Shares of PulteGroup, Inc. $PHM

Concurrent Investment Advisors LLC lifted its stake in PulteGroup, Inc. (NYSE: PHM) by 166.5% in the fourth quarter, according to its most recent Form 13F filing with the Securities and Exchange Commission (SEC). The firm owned 16,753 shares of the construction company's stock after acquiring an additional 10,467 shares during the period. Concurrent

marketbeat.com2026-04-27

Homebuilder Earnings: D.R. Horton Sticks Out as Pulte & NVR Sales Tank

Homebuilders have been going through a rough patch as of late. Across top homebuilding stocks, analysts expected revenues and earnings to fall considerably in Q1 2026, and this is exactly what happened.

📊 AI Financial Analysis

Powered by StockMarketInfo
Earnings Data: Q Ending 2026-03-31

"In PHM’s most recent quarter (2026-03-31, Q1), revenue was $3.41B and net income was $347.0M (EPS $1.81). Revenue was down QoQ from $4.61B in Q4 2025 (-26.0%) but up YoY from $4.40B in Q1 2025 ($3.41B vs. $4.40B implies -22.5% YoY). Net income followed a similar pattern: down QoQ from $501.6M (-30.8%) and down YoY from $608.5M in Q1 year-ago quarter reference (-43.0% YoY using the provided prior-year quarter). Profitability softened across the quarter: gross margin declined to 24.1% from 24.8% in Q4 2025, and net margin fell to 10.2% from 10.9% (suggesting contracting profitability). Operating income also dropped QoQ to $440.4M (from $753.0M). Balance sheet resilience looks solid: total assets were $18.20B and equity was $12.95B, with net debt at ~$598M (higher than $394M in Q4, but still moderate). Cash flow quality was mixed: operating cash flow was about $160M in Q1 versus $771M in Q4, pressured by working capital. Still, shareholder returns appear supportive—PHM is up 36.3% over 1 year, with a small dividend yield (~0.23%) and continued buybacks (Q1 repurchased ~$308M)."

Revenue Growth

Neutral

Revenue fell QoQ (-26.0% from $4.61B to $3.41B) and was down YoY (about -22.5% using the provided Q1 year-ago quarter reference).

Profitability

Caution

Margins contracted in Q1: gross margin to 24.1% (from 24.8% in Q4) and net margin to 10.2% (from 10.9%). EPS dropped to $1.81 (vs. $2.58 in Q4).

Cash Flow Quality

Fair

Operating cash flow declined sharply to ~$160M QoQ (from ~$771M), with working capital drag (change in working capital negative). Dividends continue (~$52M) and buybacks remain active (~$308M).

Leverage & Balance Sheet

Good

Equity remained strong at ~$12.95B and total assets at ~$18.20B. Net debt increased to ~$598M from ~$394M, but leverage appears manageable for resilience.

Shareholder Returns

Strong

Strong capital appreciation: 1y change +36.3% (>20% momentum). Dividend yield is modest (~0.23%), but buybacks are meaningful (repurchased ~$308M in Q1).

Analyst Sentiment & Valuation

Neutral

Street consensus target (~$141) vs. current price (~$126.53) implies modest upside (~+11%). Target range ($115–$162) indicates some valuation dispersion.

Disclaimer:This analysis is AI-generated for informational purposes only. Accuracy is not guaranteed and this does not constitute financial advice.

Fundamentals Overview

Loading fundamentals overview...

PHM delivered Q1 strength on volume and cash discipline but with margin pressure driven by incentives. Home sale revenues were $3.3B and gross margin fell to 24.4% (from 27.5% in 2025) as incentives rose to 10.9% of gross sales price (+290 bps YoY; +100 bps sequential). Management expects Q2 gross margin of 24.1%–24.4% as the “low point,” explaining that spec homes sold earlier at higher incentives are now closing. The company continues inventory modernization: finished specs declined ~24% to 1,515, and average finished specs per community hit 1.4 within the 1.0–1.5 target. Order momentum remains supported by Florida (+18% statewide) and a BTO mix shift to 43% of net new orders (up from 40%). Capital deployment was sizable ($1.3B land spend) alongside buybacks ($308M in Q1; $1.5B authorization). Guidance was reaffirmed across closings, ASP, and gross margin, with emphasis that elevated incentives should normalize as product mix and spec clearance progress.

AI IconGrowth Catalysts

  • Build-to-order share of net new orders increased to 43% from 40% in Q1 prior year; management targeting a reversion toward 60% BTO / 40% spec over multiple quarters
  • Florida net new orders up 18% statewide; orders increased in every Florida market and drove overall 3% net new order growth to 8,034 homes
  • Spec inventory progress: average 1.4 finished specs per community (within 1.0–1.5 target); finished spec homes fell to 1,515 (down ~500 or -24% over ~90 days)

Business Development

    AI IconFinancial Highlights

    • Home sale revenues: $3.3B vs $3.7B prior year; closings -7% to 6,102 homes; ASP -5% to $542k
    • Gross margin: 24.4% in Q1 vs 27.5% in 2025; incentives reached 10.9% of gross sales price (+290 bps YoY; +100 bps sequentially vs Q4 2025)
    • Land impairments impact on Q1 home sale cost of revenues: ~$6M, ~20 bps
    • Expected Q2 gross margin: 24.1% to 24.4% (management: Q2 is low point for 2026); full-year 2026 gross margin guide reaffirmed at 24.5% to 25% (likely toward lower end)
    • Net income: $347M, $1.79 EPS vs $523M, $2.57 EPS prior year; diluted shares 193M (-5% YoY)
    • Financial Services: pretax income $13M vs $36M prior year; mortgage capture rate 85% vs 86% prior year

    AI IconCapital Funding

    • Share repurchases in Q1: $308M (2.4M shares); trailing 12-month repurchases: $1.2B for 10.3M shares
    • Board authorized additional $1.5B for repurchases; total availability $2.1B
    • Total shareholder returns in Q1: $360M (repurchases + dividends mentioned)
    • Land acquisition and development investment in Q1: $1.3B; full-year 2026 land spend projected at $5.4B
    • Capital structure: issued $800M senior notes (5-year and 10-year tranches); used ~$600M to repay existing notes and $200M for general corporate purposes
    • Debt metrics: debt to capital ratio 12.3%; ended Q1 with $1.8B cash; net debt to capital ratio effectively zero
    • Projected 2026 cash flow generation: approximately $1.0B (assumes BTO mix increasing and inventory behavior tied to build-to-order closings)

    AI IconStrategy & Ops

    • Starts pace discipline: started ~6,500 homes against ~8,000 orders in Q1 to help clear excess inventory while supporting full-year closing expectations
    • Inventory target and progress: ended quarter with average 1.4 finished specs per community (target range 1.0–1.5); specs under construction represent 45% of homes under construction
    • Production/cash deployment setup: expects increased BTO closings in Q3 and Q4 to improve gross margin recovery in back half of year

    AI IconMarket Outlook

    • Q2 2026 closing expectation: 6,700 to 7,100 homes
    • Full-year 2026 closing guidance reaffirmed: 28,500 to 29,000 homes
    • Q2 2026 ASP guidance: $540,000 to $550,000; full-year 2026 ASP reaffirmed at $550,000 to $560,000
    • Community count growth: 3% to 5% YoY in each remaining month of 2026 (reaffirmed)
    • Demand/rate sensitivity commentary: if interest rates return toward ~6%, management expects improved demand; noted mortgage rates dipping below 6% aided early Q1 traffic

    AI IconRisks & Headwinds

    • Competitive market dynamics sustaining elevated incentives; management indicates incentive levels remain higher and Q2 is impacted by higher-incentive spec inventory closing
    • Affordability pressure for first-time buyers; incentives reached 10.9% of gross sales price to stimulate demand
    • Inventory clearing risk: ongoing need to clear final spec inventory, especially referenced in California and Washington
    • Cost headwinds: potential lumber/metal/petchem-related increases tied to Middle East conflict, with management noting expected lag and monitoring fuel costs; avoids overreacting to whipsawing inputs
    • Land impairment risk: ~20 bps impact from ~$6M impairments triggered in two communities due to competitive dynamics and finished spec clearance

    Q&A: Analyst Interest

    • Incentives/Gross margin walk: Management said full-year gross margin bridge assumes higher incentives than 2025, but expects incentive load to come down due to higher build-to-order and higher move-up/active adult mix plus reduced finished spec sold at higher incentive loads. Q2 is a low point because higher-incentive spec sold in Q1 closes in Q2.
    • Land banking exposure/structure: Management quantified land banking at ~8% of controlled lots (18,000 of 229,000). They described a risk-transfer objective, with most optionality via underlying land sellers (>85% of 127,000 lots under option). Deposits with bankers were described as typically ~15% with low double-digit rate carry; companywide deposits average ~7.5% and ~$7,000/unit.
    • Free cash flow conversion and BTO ramp: Management reaffirmed free cash flow generation of about $1B in 2026, noting it is not driven by increasing owned land supply. They attributed the gap to “house side” timing as inventory rebuild shifts toward more BTO in the back half. They expect 60% BTO target mix to be reached around late next year (not necessarily end of 2026).

    Sentiment: POSITIVE

    Note: This summary was synthesized by AI from the PHM Q1 2026 earnings transcript. Financial data is complex; please verify all metrics against official SEC filings before making investment decisions.

    📋 Official Regulatory 10-K / 10-Q SEC Filings

    Direct authenticated documentation links to audited SEC database reports for PHM.

    SEC EDGAR Live Feed
    Loading financial data and tables...
    📁

    SEC Filings (PHM)

    © 2026 Stock Market Info — PulteGroup, Inc. (PHM) Financial Profile