Royal Caribbean Cruises Ltd.

Royal Caribbean Cruises Ltd. (RCL) Market Cap

Royal Caribbean Cruises Ltd. has a market capitalization of .

No quote data available.

CEO: Jason T. Liberty

Sector: Consumer Cyclical

Industry: Travel Services

IPO Date: 1993-04-28

Website: https://www.rclinvestor.com

Royal Caribbean Cruises Ltd. (RCL) - Company Information

Market Cap: -|Sector: Consumer Cyclical

Company Profile

Royal Caribbean Cruises Ltd. operates as a cruise company worldwide. The company operates cruises under the Royal Caribbean International, Celebrity Cruises, Azamara, and Silversea Cruises brands, which comprise a range of itineraries that call on approximately 1,000 destinations. As of February 25, 2022, it operated 61 ships. The company was founded in 1968 and is headquartered in Miami, Florida.

Analyst Sentiment

76%
Strong Buy

From 28 Active Polls

1Y Forecast: $345.00

▲ +0.0% Potential Upside

Consensus Target Metrics

Low Bound

$280

Median

$340

High Bound

$425

Average

$345

Price & Moving Averages

Loading chart...

🎯 Wall Street Analyst Intelligence Report

1-Year structural target targets, chart projections, and sentiment maps.

Average 1Y Target
$345.00
▲ +23.21% Upside
Low Target
$280.00
0% Risk
Median Target
$340.00
21% Mid
High Target
$425.00
52% Max

Consensus Trend Projection

Trailing closures vs. 12-month metrics map.

Analyst Vote Distribution

Aggregate institutional coverage sentiment weights.

Sentiment volume allocation data unavailable.

Historical valuation matrix unavailable.

📘 Full Research Report

ℹ️

AI-Generated Research: This report is for informational purposes only.

📘 ROYAL CARIBBEAN GROUP LTD (RCL) — Investment Overview

🧩 Business Model Overview

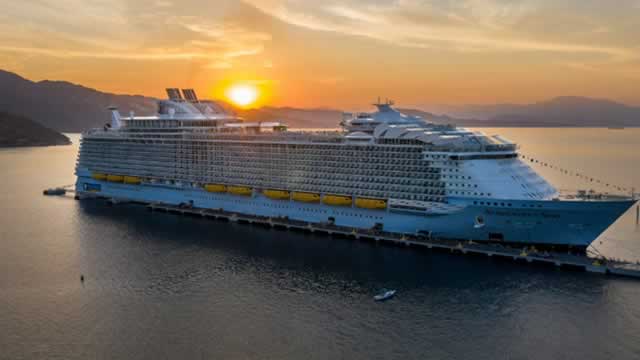
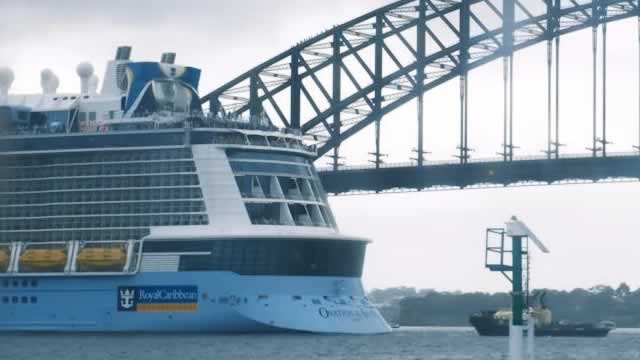
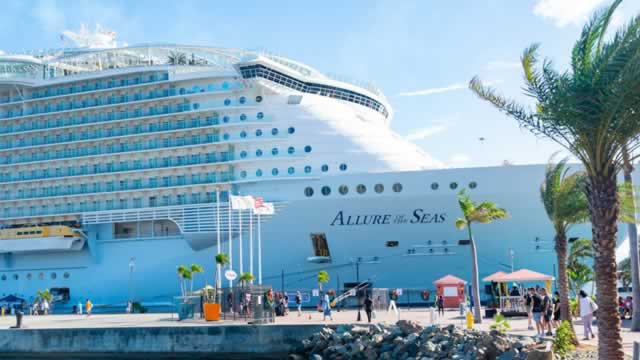
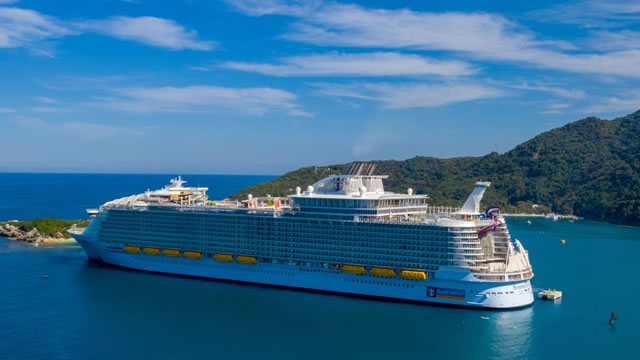
Royal Caribbean Group operates passenger cruise ships and monetizes guest demand through a combination of base fares and onboard consumption. The value chain runs from fleet ownership (or financing structures), to itinerary design (deploying ships across homeports and international routes), to distribution (direct channels and travel intermediaries), and finally to onboard revenue capture (excursions, beverage packages, specialty dining, internet/amenities, and other services). A key operational feature is fleet utilization: ship availability and scheduling discipline determine how quickly capacity converts into ticket sales, while itinerary density and destination mix influence pricing power and onboard spending per passenger.

Customer “stickiness” is supported by loyalty programs, pre-purchased travel planning, and the practical friction of changing ship classes/itineraries for repeat cruisers—though the switching costs are not as rigid as in subscription software. Instead, RCL’s durability typically comes from disciplined deployment, fleet brand positioning, and cost efficiency at scale.

💰 Revenue Streams & Monetisation Model

Cruise revenue is predominantly transactional (per sailing), but monetization behaves like a layered yield-management system:

  • Base fares: ticket revenue driven by itinerary demand, booking curves, and cabin mix.
  • Onboard and ancillary revenue: a material share of economic value, supported by onboard programs (dining, beverages, excursions, onboard retail, and services). These revenues tend to scale with passenger count and length of stay.
  • Revenue mix and margin drivers: higher onboard contribution generally improves margins, while load factor and yield determine how much of fixed cost is absorbed by sold capacity.

Operating margins depend on (i) capacity utilization, (ii) pricing/yield discipline, (iii) cost per available passenger day (labor, catering, port costs, and marketing efficiency), and (iv) fuel and foreign-exchange exposure. Fleet modernization can also support higher onboard demand and cabin-level competitiveness.

🧠 Competitive Advantages & Market Positioning

RCL competes in a global cruise market with several large operators. The competitive positioning is primarily built around scale cost advantages, fleet and itinerary deployment capabilities, and customer retention via loyalty and repeat-cruise behavior (intangible/behavioral stickiness rather than contractual lock-in).

  • Cost advantages (scale + procurement + utilization): Large fleets support better purchasing terms, operating learning curves, and more flexible deployment across geographies. Higher utilization improves fixed-cost absorption, strengthening unit economics.
  • Intangible assets (fleet brand and guest proposition): Ship design consistency, onboard product differentiation, and destination partnerships create guest expectations that are harder to replicate quickly.
  • Behavioral switching costs: Loyalty tiers, future credit structures, and the planning effort associated with selecting itineraries create repeat incentives. Competitors can gain share, but sustained displacement requires matching both price and the guest experience.

Industry focus vs. key competitors

Primary public competitors include Carnival Corporation (CCL) and Norwegian Cruise Line Holdings (NCLH) (with MSC Cruises as a major private competitor). Competitive differences generally center on ship deployment strategy, fleet size and age profile, and target guest segments.

  • RCL: stronger emphasis on distinctive onboard experiences and a differentiated fleet deployment approach that aims to sustain pricing and onboard spend.
  • Carnival (CCL): broad mass-market coverage with extensive global capacity and route networks, competing strongly on scale and value.
  • Norwegian (NCLH): a more premium-leaning positioning in parts of the portfolio, competing on itinerary breadth and product differentiation.

Across the industry, most operators can offer itineraries and onboard amenities; durability tends to come from cost control, utilization execution, and the speed at which fleets can be deployed to meet demand. RCL’s moat is therefore best characterized as operational and cost-based durability plus intangible guest proposition, rather than a single protected technology.

🚀 Multi-Year Growth Drivers

Over a 5–10 year horizon, growth opportunity typically tracks with leisure travel demand and the ability to manage capacity and yields. Structural drivers include:

  • Global leisure travel expansion: rising middle-class participation in vacation travel supports addressable market growth.
  • Longer and more diversified itineraries: itinerary design and destination breadth can increase total passenger days per capacity unit.
  • Ancillary monetization: onboard services, excursions, and guest-facing digital tools can expand revenue per passenger without proportionate increases in fixed costs.
  • Fleet productivity and modernization: newer ships can improve guest appeal, allow more efficient deployment, and support higher-quality cabin mix.
  • Capacity discipline by major operators: when supply growth is managed, the industry can defend pricing and stabilize profitability cycles.

RCL’s ability to compound value depends less on abstract market growth and more on converting demand into unit economics through disciplined yield management and operational cost control.

⚠ Risk Factors to Monitor

  • Fuel price and hedging strategy: fuel is a meaningful operating cost; exposure to market prices and hedging effectiveness can swing earnings.
  • Regulatory and environmental compliance: emissions standards, port regulations, and technology retrofit requirements can increase capex and operating expense.
  • Capital intensity and shipbuilding/financing risk: fleet investments require substantial funding; delays in delivery or financing cost increases can pressure returns.
  • Industry overcapacity: aggressive capacity additions can lead to sustained yield pressure and margin compression.
  • Macroeconomic and geopolitical shocks: leisure demand is cyclical; disruptions can affect demand, itinerary viability, and costs.
  • Operational risk: labor availability, health/safety events, and ship reliability influence guest satisfaction and cost structure.

📊 Valuation & Market View

Cruise operators are typically valued on enterprise value to operating earnings (commonly EV/EBITDA) and supported by cash flow durability assessments rather than fundamentals that rely on recurring software-like revenue. Key valuation drivers tend to include:

  • Unit profitability: load factors, pricing discipline (yield), and onboard revenue contribution.
  • Cost structure control: labor efficiency, port/handling costs, and fuel management.
  • Leverage and liquidity: net debt level, refinancing risk, and access to capital markets.
  • Fleet trajectory: capex requirements, ship delivery timing, and the return profile of modernization.

The market typically rewards operators that preserve yields while improving cost per capacity day and maintaining predictable free cash flow conversion.

🔍 Investment Takeaway

Royal Caribbean Group’s long-term investment case rests on operational scale, disciplined fleet deployment, and an intangible guest proposition that supports repeat demand and onboard revenue capture. The moat is best understood as cost and execution durability—with behavioral stickiness via loyalty and repeat-cruise planning—rather than proprietary technology. Sustained returns depend on defending unit economics through yield management, controlling fuel and environmental compliance costs, and maintaining fleet productivity while navigating an inherently cyclical, capacity-sensitive industry.


⚠ AI-generated — informational only. Validate using filings before investing.

📊 AI Financial Analysis

Powered by StockMarketInfo
Earnings Data: Q Ending 2026-03-31

"RCL (2026-03-31, Q1) reported Revenue of $4.452B and Net Income of $941M, with EPS of $3.49. On a YoY basis versus 2025-03-31, Revenue increased +11.3% ($4.452B vs. $3.999B) and Net Income rose +28.6% ($941M vs. $730M). On a QoQ basis versus 2025-12-31, Revenue grew +4.6% ($4.452B vs. $4.259B) and Net Income increased +24.8% ($941M vs. $754M). Profitability improved: gross margin declined slightly (49.5% vs. 36.7% in Q4, but it is still far higher than Q1 last year at 48.0%); operating margin improved sequentially (26.1% vs. 21.9% in Q4 and up from 23.6% YoY). Net margin expanded to 21.1% from 17.7% in Q4 and 18.3% YoY, supporting strong earnings growth. Cash flow showed solid quality for the quarter: Operating Cash Flow was $1.834B and Free Cash Flow was $1.334B. Capital intensity was more moderate than Q4 (CapEx -$0.5B vs. -$1.507B). Shareholder returns were aided by significant repurchases (common stock repurchased -$836M) and dividends paid of -$270M. Balance sheet resilience remains stable with Total Assets ~$42.0B and Equity ~$10.0B, though leverage is elevated (Total debt ~$21.8B vs. Net income strength). Total shareholder returns appear favorable given the strong 1-year price momentum (+48.92% 1y_change) alongside a low dividend yield (~0.36%)."

Revenue Growth

Strong

QoQ Revenue +4.6% (4.452B vs 4.259B). YoY Revenue +11.3% (vs 3.999B), indicating steady top-line expansion.

Profitability

Strong

Net margin improved to 21.1% (vs 17.7% in Q4 and 18.3% YoY). Operating margin rose to 26.1% (vs 21.9% in Q4 and 23.6% YoY), supporting strong EPS ($3.49).

Cash Flow Quality

Good

Operating cash flow $1.834B and free cash flow $1.334B in Q1. Shareholder payouts included dividends (-$270M) and heavy buybacks (-$836M), both supported by positive FCF.

Leverage & Balance Sheet

Neutral

Total assets were stable (~$41.99B) with equity around $10.03B, but leverage remains high (net debt ~$21.28B; debt/equity elevated). Cash generation helps offset leverage risk.

Shareholder Returns

Strong

Strong 1-year price momentum (+48.92%) meaningfully boosts total return. Dividend yield is low (~0.36%) but buybacks were substantial (-$836M).

Analyst Sentiment & Valuation

Neutral

Consensus target ($359.58) is above the context price ($285.48), implying upside; however, near-term valuation metrics show premiums typical for strong earners (e.g., P/E ~19.7 at Q1 ratios), tempering the score.

Disclaimer:This analysis is AI-generated for informational purposes only. Accuracy is not guaranteed and this does not constitute financial advice.

Fundamentals Overview

Loading fundamentals overview...

RCL delivered a strong Q1 2026 beat: adjusted EPS $3.60 (+33% YoY) exceeded guidance by $0.37, alongside 11% revenue growth and 2% net yield growth above the top of the guided range. Operating leverage was clear—adjusted EBITDA margin expanded by over 300 bps and operating cash rose 13% to $1.8B. The primary near-term drag is geopolitical-driven Mediterranean disruption and air-cost effects concentrated in Q2/Q3, translating into roughly 200 bps yield headwinds and nearly 400 bps cost headwinds (dry docks, crew travel, reduced capacity). Despite this, management kept 2026 net yield growth at 1.5% to 2.5% and guided full-year adjusted EPS $17.10–$17.50, explicitly incorporating fuel headwinds (~$0.62 per share) and lower TUI Cruises contribution (~$0.12 per share). Management’s confidence rests on limited Med exposure in Q4, stronger Q4 booking position, easier comps, and a “turned the corner” booking trajectory with inventory constraints easing as demand improves.

AI IconGrowth Catalysts

  • Record WAVE season reinforcing demand across leading brands
  • Improving Q2/Q3 Mediterranean demand for remaining limited inventory after late-quarter moderation
  • Yield support from improvements in gross margin and itinerary strength
  • Operational differentiation in the Caribbean supported by Royal Beach Club Paradise Island and redeployed Legend of the Seas (into the Caribbean in November)

Business Development

  • TUI Cruise ships impacted by Middle East conflict; repositioned to the Mediterranean (welcoming guests mid-May)
  • New Royal ONE co-branded credit cards (loyalty/points ecosystem expansion)
  • Cross-brand status match program (industry-first, launched 2024) increasing cross-brand bookings
  • Icon VI and Icon VII orders reflecting confidence in Icon platform economics and guest experience
  • Royal Beach Club Santorini launch; Royal Beach Club Cozumel expected early 2028
  • Perfect Day Mexico and Costa Maya expected to open late 2027 and ramp in early 2028

AI IconFinancial Highlights

  • Adjusted EPS of $3.60, $0.37 above the midpoint of Q1 guidance; +33% YoY
  • Revenue grew 11% YoY
  • Net yields grew 2% in Q1, above the high end of guidance
  • Adjusted EBITDA margin 38%, up more than 300 bps YoY
  • Operating cash flow $1.8B, +13% YoY
  • Full-year net cruise costs (ex-fuel) expected ~flat; 50 bps better than prior guidance
  • Fuel headwinds: expects $0.62 per share headwind from fuel for full year; also $0.62 per share cited via spot fuel impact (roughly $0.62 per share this year at current spot levels)
  • Fuel expense expected $1.35B for 2026; forward consumption for remainder of 2026 hedged 59% (below market rates); guidance notes EPS would be ~4% lower if based on the forward curve
  • Q2: net yields up ~0.2% constant currency; yield headwinds ~200 bps YoY driven by dry dock days and geopolitical disruption
  • Q2: net cruise costs (ex-fuel) expected +4.6% to +5.1% constant currency; almost 400 bps of cost headwinds from additional dry dock days and crew travel (air disruptions), plus reduced capacity
  • Q2 EPS guidance: $3.83 to $3.93

AI IconCapital Funding

  • Returned $1.1B of capital via dividends and share buybacks
  • Repurchased 2.9 million shares for $836 million in Q1
  • $1.0B remaining under current authorization
  • Ended quarter with $6.9B in liquidity
  • Leverage below 3x
  • Accessed capital markets with a $2.5B investment-grade bond offering; net proceeds used to refinance existing indebtedness including near-term maturities

AI IconStrategy & Ops

  • Perfecta performance program: targeting 20% CAGR in adjusted EPS through 2027 and ROIC in the high teens
  • Commercial/tech: pre-cruise booking engine penetration over 70% with over 5 items purchased per booking; year-over-year increase in spend per night
  • Digital: mobile app adoption >90%; monthly active users 5x vs 2019; over half of onboard revenue booked before guests step onboard, vast majority digitally
  • Inventory/booking management emphasized: Mediterranean moderation driven by disruption concerns and air-cost spikes; management highlights active inventory management and rebounding bookings
  • Ship deployment: Legend of the Seas redeployed into the Caribbean; Icon-class expansion continued (Icon VI/VII orders; Legend mentioned as Q1 delivery opportunity)

AI IconMarket Outlook

  • Full-year 2026: revenue expected to grow roughly double digits YoY; net yield expected to grow 1.5% to 2.5% (constant currency)
  • Full-year adjusted EPS expected $17.10 to $17.50 (includes $0.74 per share from fuel headwinds and $0.62 per share from fuel headwind noted in guidance commentary; also includes $0.12 per share headwind from lower expected earnings contribution from TUI Cruises)
  • Capacity expected to grow 6.7% for the year
  • Q2 guidance: capacity +4.9% YoY; net yields +~0.2% constant currency; adjusted EPS $3.83 to $3.93
  • Repositioning impact: two TUI Cruise ships repositioned to Mediterranean with guest sailings starting mid-May

AI IconRisks & Headwinds

  • Middle East conflict: operational pauses for two TUI Cruise ships; financial impact mainly via fuel cost increases
  • Fuel sensitivity: despite ~60% hedged for 2026, spot fuel assumed higher; full-year fuel expense $1.35B and $0.62 per share headwind
  • Mediterranean booking moderation late in Q1 tied to (1) vacation disruption concerns and (2) air travel cost spikes (air travel cost up >40%, settling to ~15%), impacting Q2/Q3 more than Q4
  • West Coast of Mexico demand disruption concerns: region-specific moderation; Mexico represents ~5% of capacity
  • Cost timing/headwinds in Q2: almost 400 bps of cost headwinds from additional dry dock days, crew travel from air disruptions, and reduced capacity
  • TUI Cruises earnings contribution headwind: $0.12 per share for full year; Q2 EPS impacted by almost $1 from geopolitical/cost items including lower TUI contribution

Q&A: Analyst Interest

  • Topic: What supports Q4 yield strength despite Mediterranean headwinds? Management’s detailed response: Management said the year’s yield pattern is “smiley,” driven by Mediterranean and to a lesser extent West Coast of Mexico exposure concentrated in Q2 and Q3. Q4 has little Med product and benefits from a stronger book position and easier comps tied to prior-year Legend deployment, supporting mid-single-digit yield growth without needing European recovery.
  • Topic: Evidence of “turning the corner” in bookings and how far the inventory issue goes? Management’s detailed response: Management clarified that they have turned the corner—moderation has ended rather than a dip-and-return. They emphasized continued strong demand but constrained inventory for Q2 and Q3, with limited inventory remaining by end of April for the quarter and very little left for Q3. They also stated disruption is not expected to alter next-year booking behavior.
  • Topic: Perfect Day Mexico timeline, ramp cadence, and Western Caribbean/Texas yield opportunity? Management’s detailed response: Management stated Perfect Day Mexico is on track, with government support, a soft opening in Q4 2027, and full opening as it moves into 2028. They indicated environmental “blips” were resolved. They expect it to materially accelerate financial performance for the Gulf/West market, specifically Galveston and Texas, positioning it to “own the Texas market” with Royal Beach Club and Costa Maya alongside Icon-class ships.

Sentiment: POSITIVE

Note: This summary was synthesized by AI from the RCL Q1 2026 earnings transcript. Financial data is complex; please verify all metrics against official SEC filings before making investment decisions.

Loading financial data and tables...
© 2026 Stock Market Info — Royal Caribbean Cruises Ltd. (RCL) Financial Profile