Roku, Inc.

Roku, Inc. (ROKU) Market Cap

Roku, Inc. has a market capitalization of $21.51B.

Price: $145.01

-0.08 (-0.06%)

Market Cap: 21.51B

NASDAQ · time unavailable

CEO: Anthony J. Wood

Sector: Communication Services

Industry: Entertainment

IPO Date: 2017-09-28

Website: https://www.roku.com

Roku, Inc. (ROKU) - Company Information

Market Cap: 21.51B|Sector: Communication Services

Company Profile

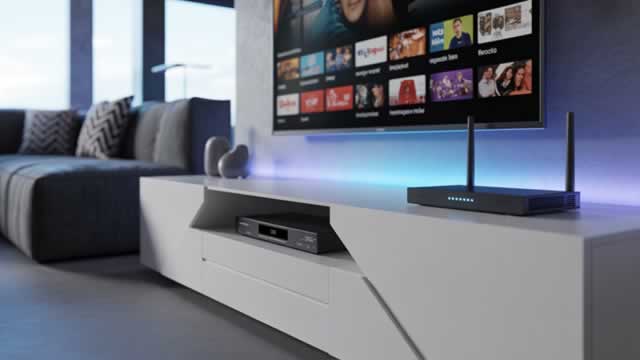
Roku, Inc., alongside its affiliated companies, operates a significant platform for television streaming. The enterprise is segmented into two primary areas: Platform and Player. Through its platform, users can effortlessly explore and access a vast selection of content, including films, television series, live broadcasts, news updates, sports events, and other forms of entertainment. As of December 31, 2021, Roku had garnered 60.1 million active user accounts. Beyond its core streaming service, Roku generates revenue from diverse offerings such as digital and video advertisements, content distribution, and the management of subscriptions and billing. The company also facilitates various e-commerce transactions and provides opportunities for brand sponsorship and promotions. Roku further diversifies its business by manufacturing, marketing, and licensing smart televisions under the "Roku TV" brand. Additionally, it offers a line of Roku-branded hardware, which includes streaming devices, audio equipment, and related accessories. A specific revenue stream comes from selling dedicated channel buttons that are integrated into the remote controls of its streaming gadgets. Roku distributes its comprehensive range of products and services through multiple channels: traditional retail outlets, specialized distributors, and directly to consumers via its official website. Its operational footprint extends across the United States, Canada, the United Kingdom, France, Mexico, Brazil, Chile, Peru, and broadly throughout both North and South America, as well as Europe. Roku, Inc. was founded in 2002 and is headquartered in San Jose, California.

Analyst Sentiment

62%
Buy

From 26 Active Polls

1Y Forecast: $154.56

▲ +6.6% Potential Upside

Consensus Target Metrics

Low Bound

$100

Median

$160

High Bound

$185

Average

$155

Price & Moving Averages

Loading chart...

🎯 Wall Street Analyst Intelligence Report

1-Year structural target targets, chart projections, and sentiment maps.

Average 1Y Target
$154.56
▲ +6.59% Upside
Low Target
$100.00
-31% Risk
Median Target
$160.00
10% Mid
High Target
$185.00
28% Max
Consensus
Buy
25 / 45 Buys

Consensus Trend Projection

Trailing closures vs. 12-month metrics map.

Analyst Vote Distribution

Aggregate institutional coverage sentiment weights.

📊 Historical Valuation Multiples

Real-time Trailing Twelve Month (TTM) momentum side-by-side with discrete quarterly metrics.

Fiscal QuarterTTMQ1 2026Q4 2025Q3 2025Q2 2025Q1 2025Q4 2024Q3 2024Q2 2024
Period EndingTrailing 12MMar 31, 2026Dec 31, 2025Sep 30, 2025Jun 30, 2025Mar 31, 2025Dec 31, 2024Sep 30, 2024Jun 30, 2024
Market Cap ($M)21,51113,95716,06114,70512,91010,29810,82010,8159,017
Enterprise Value ($M)20,36212,80915,34613,67311,2248,6199,2529,3027,586
Price to Earnings Ratio (P/E)106.5140.7850.23147.25307.31-92.68-77.44-299.60-65.07
Price/Earnings-to-Growth Ratio (PEG)3.3016.4334.71-5.92-30.85-6.62
Price to Sales Ratio (P/S)4.3311.1811.5112.1511.6210.099.0110.189.31
Price to Book Ratio (P/B)8.015.236.045.604.984.084.344.403.77
Price to Free Cash Flow Ratio (P/FCF)32.9671.2172.47116.27118.8675.28140.83159.97400.20
Enterprise Value to Sales (EV/Sales)10.2611.0011.2910.108.447.708.767.84
Enterprise Value to EBITDA (EV/EBITDA)48.4777.49139.94236.04128.66248.17152.01127.08-492.08
Debt to Equity Ratio-2.730.190.330.210.220.230.240.250.26

📘 Full Research Report

ℹ️

AI-Generated Research: This report is for informational purposes only.

📘 ROKU INC CLASS A (ROKU) — Investment Overview

🧩 Business Model Overview

Roku operates a connected-TV (CTV) platform that sits between content providers and viewers, distributing streaming experiences across Roku devices and partner TV models. The value chain is anchored in (1) platform discovery and interface—Roku’s operating system and home screen drive navigation to apps and content—and (2) monetisation through advertising and services that convert user attention into revenue. Roku benefits from a broad ecosystem of third-party streaming apps, while also enabling direct relationships with advertisers via measurable ad delivery and targeted inventory.

A central feature of the model is customer stickiness: once households adopt Roku, the home screen becomes a default hub for content access, making ongoing engagement (daily/weekly viewing behavior and app usage) the foundation for revenue generation.

💰 Revenue Streams & Monetisation Model

Roku’s monetisation is primarily driven by:

  • Advertising (primarily CTV display/video): Revenue scales with impressions and the depth of engagement within Roku’s interface. Monetisation strength typically improves when Roku sustains strong active user engagement, expands addressable inventory, and improves ad performance via better measurement and targeting.
  • Platform services: This includes subscription-related and transaction-like revenue streams tied to platform functionality (e.g., monetisation of services distributed through the platform). These tend to be less “hardware-like” and more correlated with user activity and the breadth of available channels.
  • Device revenue: Hardware sales (streaming players and licensing of the platform via partner TVs) can contribute, but the durable focus for equity analysis is the software-like component—advertising and platform monetisation that leverages installed base engagement.

Margin drivers are influenced by (1) operating leverage from an installed base that generates recurring ad demand, (2) cost control in sales/marketing and platform operations, and (3) the ability to improve ad yield per impression without undermining viewer experience.

🧠 Competitive Advantages & Market Positioning

Roku’s moat is best described as a combination of switching costs and platform distribution leverage, reinforced by advertising measurement and interface “habit formation.”

  • High switching costs (Data gravity + interface habit): Households and user profiles form routine behaviors around the Roku home screen and installed channel set. Moving away requires replacing the viewing hub (device/platform migration), and advertisers often value the stability of a consistent, measurable inventory base.
  • Two-sided platform dynamics: Roku’s attractiveness to content/app partners and advertisers grows as engagement rises, supporting sustained inventory and improving monetisation efficiency.
  • Distribution scale without full hardware dependence: Roku’s platform is embedded across many OEM TV models and streaming devices, providing breadth of access to viewing hours without requiring exclusive control of end-user hardware.

Competitive benchmarking:

  • Amazon (Fire TV): Amazon competes with a large ecosystem tied to its retail/services layer and device distribution. The strategic focus differs: Amazon’s leverage can come from bundling across commerce/media services, while Roku’s emphasis is on neutral, cross-app discovery and CTV advertising at the platform level.
  • Apple (tvOS / Apple TV ecosystem): Apple’s ecosystem advantage is tightly integrated with its services and hardware/software stack. The contrast is that Apple’s distribution and monetisation often depend on ecosystem lock-in, whereas Roku competes more on broad app accessibility and monetisation across a heterogeneous device set.
  • Google (Android TV / Google TV) and broader TV OS competitors: Google’s strength is in search and OS-level distribution. Roku’s focus is on interface-led navigation and CTV advertising inventory rather than relying primarily on search-driven user acquisition.

Overall, Roku’s differentiation is not a single feature; it is the ability to maintain meaningful viewer engagement as a default entry point to streaming apps and to translate that engagement into consistent CTV ad demand.

🚀 Multi-Year Growth Drivers

Over a 5–10 year horizon, the investment case rests on secular shifts in how consumers and advertisers allocate attention and spend:

  • Structural migration from linear TV to CTV/streaming: Advertising budgets continue to rotate toward addressable, measurable formats. Roku is positioned to benefit from expanding CTV inventory and improving ad effectiveness.
  • Continued growth in streaming viewing hours: The installed base of connected devices and the expansion of streaming households supports higher demand for discovery, app navigation, and ad-supported content.
  • Broadening monetisation beyond advertising: Platform services that monetize engagement—subscriptions distributed or enabled via the ecosystem—can deepen revenue durability and improve diversification away from purely ad cycles.
  • International platform expansion and OEM/brand partner distribution: Scaling the platform through partner TV models expands the addressable audience without equivalent incremental device manufacturing constraints.
  • Ad product sophistication: Better measurement, targeting, and yield optimization—without sacrificing user experience—can improve monetisation per impression over time.

The practical implication is that growth is less dependent on content ownership and more dependent on sustaining active engagement and monetising a large, durable viewing interface.

⚠ Risk Factors to Monitor

  • Platform policy and commercial dependence risk: Changes in how apps, device OEM partners, or advertisers interact with the platform (including revenue share structures, distribution terms, or ranking policies) can pressure monetisation economics.
  • Competitive intensity among CTV operating systems: Larger ecosystems (search-led, retail-led, or hardware-integrated) can increase bidding and ad competition, potentially affecting ad pricing and user acquisition costs.
  • Privacy, measurement, and regulatory constraints: Regulations and platform-level privacy changes can limit targeting capabilities or measurement sophistication, impacting ad yield.
  • Content and partner ecosystem dynamics: Reliance on third-party streaming apps means platform demand can fluctuate if major content providers change distribution preferences or terms.
  • Hardware cyclicality and mix risk: Device-related revenue can be volatile with consumer hardware upgrade cycles and promotional dynamics, affecting consolidated results.

📊 Valuation & Market View

Roku typically trades in the equity market as a platform/advertising software-like story, with valuation frameworks often anchored to:

  • Forward revenue multiples (e.g., P/S-style framing): Markets often value CTV platforms based on growth durability, monetisation per user/impression, and long-term operating leverage potential.
  • EV/EBITDA-style lenses: As scale and margins become more predictable, investors may transition toward cash flow-based valuation, though the path to sustained profitability is a key sensitivity.
  • Operating metrics driving the multiple: Active accounts/households, ad engagement depth, ad yield per impression, platform monetisation mix, and evidence of durable cost discipline tend to be the principal drivers of underwriting changes.

Key valuation “needle movers” generally include sustained improvement in monetisation efficiency, evidence that CTV ad spend is gaining share of TV budgets on Roku’s inventory, and reduced volatility from hardware mix.

🔍 Investment Takeaway

ROKU’s long-term thesis is grounded in a credible CTV platform position supported by switching costs (interface habit + user behavior), platform network effects (engagement attracts advertisers and app availability), and measurable advertising monetisation within a structurally growing market. The core debate for investors is whether Roku can sustain engagement-driven ad yield and protect platform economics amid intensifying competition from large ecosystems and shifting privacy/measurement constraints.


⚠ AI-generated — informational only. Validate using filings before investing.

📰 Market News & Coverage

15 Stories Available

Real-time institutional reporting and market updates for ROKU.

zacks.com2026-07-29

NFLX vs. ROKU: Which Ad-Supported Streaming Stock Has an Edge Now?

Roku's diversified ad, subscription and platform strategy, raised guidance and lower valuation premium give it an edge over Netflix now.

zacks.com2026-07-29

Why Roku (ROKU) is a Top Growth Stock for the Long-Term

The Zacks Style Scores offers investors a way to easily find top-rated stocks based on their investing style. Here's why you should take advantage.

zacks.com2026-07-27

Roku, Inc. (ROKU) Is a Trending Stock: Facts to Know Before Betting on It

Recently, Zacks.com users have been paying close attention to Roku (ROKU). This makes it worthwhile to examine what the stock has in store.

defenseworld.net2026-07-27

Roku, Inc. $ROKU Shares Purchased by Entropy Technologies LP

Entropy Technologies LP increased its holdings in shares of Roku, Inc. (NASDAQ: ROKU) by 56.3% during the undefined quarter, according to the company in its most recent 13F filing with the Securities and Exchange Commission (SEC). The fund owned 29,103 shares of the company's stock after buying an additional 10,488 shares during the

defenseworld.net2026-07-26

Bank of New York Mellon Corp Has $36.78 Million Position in Roku, Inc. $ROKU

Bank of New York Mellon Corp lowered its holdings in shares of Roku, Inc. (NASDAQ: ROKU) by 11.0% during the first quarter, according to the company in its most recent Form 13F filing with the Securities and Exchange Commission (SEC). The firm owned 388,680 shares of the company's stock after selling 47,984 shares

defenseworld.net2026-07-26

Bank of Nova Scotia Has $14.30 Million Holdings in Roku, Inc. $ROKU

Bank of Nova Scotia increased its stake in Roku, Inc. (NASDAQ: ROKU) by 43.2% in the undefined quarter, according to its most recent 13F filing with the Securities and Exchange Commission (SEC). The fund owned 151,178 shares of the company's stock after purchasing an additional 45,610 shares during the period. Bank of Nova

businesswire.com2026-07-23

Roku to Announce Second Quarter 2026 Financial Results on August 6

SAN JOSE, Calif.--(BUSINESS WIRE)--Today, Roku, Inc. (Nasdaq: ROKU) announced it will release second quarter 2026 financial results after market close on Thursday, August 6.On June 15, Fox Corporation (Nasdaq: FOXA, FOX) and Roku announced a definitive agreement under which FOX will acquire Roku. In light of the pending transaction, Roku will not host an earnings call and will not provide financial outlook.About Roku, Inc.Roku pioneered streaming on TV. Today, it is the #1 TV streaming platform.

247wallst.com2026-07-23

Here Is Why You Should Buy Netflix And Roku

Netflix (NASDAQ:NFLX | NFLX Price Prediction) and Roku (NASDAQ:ROKU) just delivered post-earnings snapshots that could not look more different.

defenseworld.net2026-07-23

California Public Employees Retirement System Raises Stock Holdings in Roku, Inc. $ROKU

California Public Employees Retirement System increased its holdings in shares of Roku, Inc. (NASDAQ: ROKU) by 14.8% during the first quarter, according to its most recent Form 13F filing with the Securities and Exchange Commission. The firm owned 260,774 shares of the company's stock after acquiring an additional 33,593 shares during the quarter.

defenseworld.net2026-07-21

Amova Asset Management Americas Inc. Sells 1,092,615 Shares of Roku, Inc. $ROKU

Amova Asset Management Americas Inc. lessened its stake in Roku, Inc. (NASDAQ: ROKU) by 37.1% in the first quarter, according to the company in its most recent disclosure with the Securities and Exchange Commission. The institutional investor owned 1,848,889 shares of the company's stock after selling 1,092,615 shares during the quarter. Roku comprises

fool.com2026-07-18

Roku CFO Dan Jedda Sells 7,000 Shares for $993,300

Insider reduced direct equity holdings by 9% under a Rule 10b5-1 trading plan, following a 61% one-year stock return.

deadline.com2026-07-17

Elizabeth Warren And Other Democratic Lawmakers Warn Of Antitrust Issues With Fox-Roku Merger

Sen. Elizabeth Warren (D-MA) and other congressional Democrats are warning of antitrust implications in Fox Corp.'s proposed acquisition of Roku.

zacks.com2026-07-15

Here's Why Roku (ROKU) is a Strong Momentum Stock

The Zacks Style Scores offers investors a way to easily find top-rated stocks based on their investing style. Here's why you should take advantage.

zacks.com2026-07-15

Investors Heavily Search Roku, Inc. (ROKU): Here is What You Need to Know

Recently, Zacks.com users have been paying close attention to Roku (ROKU). This makes it worthwhile to examine what the stock has in store.

zacks.com2026-07-13

Roku (ROKU) Ascends While Market Falls: Some Facts to Note

In the closing of the recent trading day, Roku (ROKU) stood at $142.34, denoting a +1.17% move from the preceding trading day.

📊 AI Financial Analysis

Powered by StockMarketInfo
Earnings Data: Q Ending 2026-03-31

"ROKU reported Q1 2026 revenue of $1.249B, up +22.4% YoY but down -10.5% QoQ (vs. Q4 2025). Net income was $85.7M, improving to positive from a net loss of -$27.4M in Q1 2025 (+413% YoY), but easing from $80.5M in Q4 2025 (+6.5% QoQ decline). EPS was $0.58 (vs. -$0.19 YoY). Profitability improved materially versus last year: gross margin rose to ~45.2% from ~43.6% in Q1 2025, and net margin expanded to 6.9% from -2.7% YoY. QoQ, however, net margin contracted (5.8% in Q4 2025 to 6.9% in Q1 2026 is actually an expansion; the key is that operating income rose to $51.8M from $66.0M QoQ, suggesting costs/marketing fell less than revenue). Cash flow quality remains solid for a high-growth media/streaming platform: operating cash flow was $199M and free cash flow was $196M in Q1 2026. The company continued capital returns via buybacks (repurchased ~$100M in the quarter) while holding no dividends. Balance sheet resilience looks good with $2.38B in cash/short-term investments and net cash (net debt of about -$1.24B). Total shareholder return is strong: the stock is up +98.99% over 1 year, which should meaningfully boost the score. Valuation appears demanding (high P/S and elevated earnings multiples), though the near-term profitability trend is improving."

Revenue Growth

Positive

Q1 2026 revenue $1.249B: +22.4% YoY, but -10.5% QoQ (down from Q4 2025 $1.395B). Growth is positive year-over-year but softer quarter-over-quarter.

Profitability

Good

Net income +413% YoY to $85.7M and net margin expanded to 6.9% from -2.7% in Q1 2025. Gross margin improved to ~45.2%. QoQ operating income is lower ($51.8M vs $66.0M), indicating cost pressure despite better YoY earnings power.

Cash Flow Quality

Good

Operating cash flow $199M and free cash flow $196M in Q1 2026. No dividend; buybacks continued (~$100M). Cash generation supports continued returns.

Leverage & Balance Sheet

Good

Net debt remains negative (net cash) at about -$1.24B. Liquidity is strong with $2.38B cash & short-term investments. Assets and equity are stable-to-up vs Q4 2025.

Shareholder Returns

Strong

Strong momentum with +98.99% 1-year price change plus ongoing buybacks (~$100M in Q1). Dividend yield is 0.

Analyst Sentiment & Valuation

Neutral

Price targets suggest upside (consensus ~$131.87 vs price $116.21), but valuation multiples are high (e.g., high P/S and earnings multiples), limiting score despite improving profitability.

Disclaimer:This analysis is AI-generated for informational purposes only. Accuracy is not guaranteed and this does not constitute financial advice.

Fundamentals Overview

Loading fundamentals overview...

Roku delivered a strong Q1 2026: platform revenue +28% and EBITDA margins nearly 12%, more than doubling YoY, alongside $148 million free cash flow (nearly 16% margin). The core operating story is ad monetization strength—advertising gross margin just over 60%, up more than 400 bps YoY—supported by performance ad products and home screen monetization improvements, plus premium subscriptions (subscription revenue +30%). Management guided Q2 platform revenue to ~+20% YoY and increased full-year platform revenue guidance by >$100 million (~3 points) to nearly 21%, while expecting FCF above adjusted EBITDA. The main offset is devices: management pointed to ASP pressure in streaming players and elevated memory costs, particularly impacting margins, though they defended the OS cost advantage that should widen BOM spread versus competitors. DSP integrations (Amazon and others) are scaling programmatic delivery without margin tradeoffs, with management maintaining generally bullish profitability through 2026.

AI IconGrowth Catalysts

  • Advertising revenue grew 27% and third-party partnership strategy accelerated (Ads Manager adoption growing)
  • Subscription revenue grew 30% driven by premium subscription sign-ups and expansion of tier-one partners
  • Platform monetization uplift from Olympics and the Super Bowl supporting higher subscription and M&E spend
  • Advertising gross margin improved to just over 60%, up over 400 bps YoY, supported by higher-margin ad products (e.g., home screen monetization)
  • Home screen redesign engagement lift: marquee ad visible immediately (no scrolling), higher CTR and monetization effectiveness
  • Passed 100 million streaming households, supporting continued ad/subscription scale

Business Development

  • New premium subscription partner launch: Apple TV (added March)
  • Premium subscription partner announcement: Peacock
  • DSP/interoperability ecosystem: Amazon DSP, The Trade Desk, Yahoo, FreeWheel
  • Expanded DV360 relationship: extension of the DV360 deal with Google and signed up for Campaign Manager 360
  • Publisher Match enabled via Campaign Manager 360 to manage holistic YouTube (Google first-party + advertiser first-party activation) inside Roku Media
  • Retail/distribution: strong presence and ongoing relationships referenced with Walmart, Target (Hero brand TVs exclusive), Best Buy, Amazon, and regional retailers
  • TV OEM licensing expansion: long-term partners TCL and Hisense

AI IconFinancial Highlights

  • Platform revenue grew 28% in Q1, ahead of outlook, aided by Olympics and Super Bowl
  • EBITDA margins more than doubled YoY to nearly 12%
  • Free cash flow was $148 million; free cash flow margin nearly 16% (second-highest on record)
  • Advertising gross margin just over 60%, up over 400 bps YoY; management believes it is sustainable and could rise (or maintain) through 2026 and beyond
  • Subscription gross margin just north of 40% in Q1, down and mix-driven; management expects 41% to 42% for the rest of 2026
  • Device: analyst asked about device revenue/margin downside; management attributed downdraft primarily to ASP declines in streaming players and higher memory costs (expected back-half pressure)

AI IconCapital Funding

  • No explicit buyback authorization/amount or debt level disclosed in transcript
  • Reported free cash flow: $148 million in Q1 2026; expects FCF to again be above adjusted EBITDA full-year

AI IconStrategy & Ops

  • Ads Manager adoption tied to generative AI; expanding connected TV ad platform performance via third-party DSP integrations
  • Home screen changes: new layout collapsing left navigation; ad unit front and center on first launch to increase impressions and click-through
  • Testing rollout: new home screen redesign in a large number of homes, then ‘roll out to everyone soon’; early results cited as more engagement, higher viewer satisfaction, improved monetization
  • Device cost management: OS uses significantly less memory/storage vs competitors; memory/BOM cost advantage widens as memory prices rise; maintain strategic flexibility optimizing mix across players, first-party TVs, and third-party TVs
  • Second-half guidance posture: management stated they are being conservative on 2H due to improving macro/political visibility

AI IconMarket Outlook

  • Q2 platform revenue guidance: grow ~20% YoY; subscriptions and advertising expected to be around this growth level
  • Full-year platform revenue guidance: nearly 21% (increased by >$100 million, ~3 percentage points of growth)
  • EBITDA and EBITDA margins: expected to increase; free cash flow expected to remain above adjusted EBITDA for full year
  • Second-half update timing: updated guidance will be provided as visibility into political and other initiatives improves

AI IconRisks & Headwinds

  • Memory prices elevated: management must manage device BOM and first-party TV/player margin impacts; back-half pressure acknowledged as consistent with guidance
  • Device profitability sensitivity: ASP declines in streaming players plus higher memory costs driving device revenue/margin pressure
  • Advertising and subscription mix risk: premium subscription mix pressures subscription gross margin (expected to level at 41%-42%)
  • Political/macro uncertainty in the second half: management cited improving visibility but remained conservative

Q&A: Analyst Interest

  • Q1-to-Q2/full-year bridge + political momentum: Management cited Q1 ahead-of-outlook driven by Olympics/Super Bowl and easier prior comp, with Q2 comp stepping to higher advertising growth once politics is backed out. They reiterated Q2 platform revenue +20% YoY and full-year platform growth near 21%, with 2H guidance conservative until visibility improves.
  • Third-party DSPs (Amazon emphasis) + programmatic share: Charlie said strategy is open and interoperable, integrated with major DSPs so clients transact where they prefer. Q1 results showed third-party programmatic delivery is now majority of video delivery and growing quickly, with Amazon cited as ramping well and supported by compounded programmatic share growth.
  • Devices and memory prices: Management argued Roku TV OS uses significantly less memory/storage, improving BOM advantage as memory costs rise. While first-party needs active management, device investment/units included in full-year outlook were unchanged. They emphasized uncertainty beyond the year and reliance on mix flexibility across players, first-party TVs, and third-party TVs.

Sentiment: MIXED

Note: This summary was synthesized by AI from the ROKU Q1 2026 earnings transcript. Financial data is complex; please verify all metrics against official SEC filings before making investment decisions.

📋 Official Regulatory 10-K / 10-Q SEC Filings

Direct authenticated documentation links to audited SEC database reports for ROKU.

SEC EDGAR Live Feed
No recent 10-K available.
No recent 10-Q available.
Loading financial data and tables...
📁

SEC Filings (ROKU)

© 2026 Stock Market Info — Roku, Inc. (ROKU) Financial Profile