SITE Centers Corp.

SITE Centers Corp. (SITC) Market Cap

SITE Centers Corp. has a market capitalization of $261.8M.

Price: $4.99

0.04 (0.81%)

Market Cap: 261.85M

NYSE · time unavailable

CEO: David R. Lukes

Sector: Real Estate

Industry: REIT - Retail

IPO Date: 1993-02-02

Website: https://www.sitecenters.com

SITE Centers Corp. (SITC) - Company Information

Market Cap: 261.85M|Sector: Real Estate

Company Profile

SITE Centers is an owner and manager of open-air shopping centers that provide a highly-compelling shopping experience and merchandise mix for retail partners and consumers. The Company is a self-administered and self-managed REIT operating as a fully integrated real estate company, and is publicly traded on the New York Stock Exchange under the ticker symbol SITC.

Analyst Sentiment

60%
Buy

From 1 Active Polls

1Y Forecast: $8.00

▲ +60.3% Potential Upside

Consensus Target Metrics

Low Bound

$8

Median

$8

High Bound

$8

Average

$8

Price & Moving Averages

Loading chart...

🎯 Wall Street Analyst Intelligence Report

1-Year structural target targets, chart projections, and sentiment maps.

Average 1Y Target
$8.00
▲ +60.32% Upside
Low Target
$8.00
60% Risk
Median Target
$8.00
60% Mid
High Target
$8.00
60% Max
Consensus
Hold
6 / 31 Buys

Consensus Trend Projection

Trailing closures vs. 12-month metrics map.

Analyst Vote Distribution

Aggregate institutional coverage sentiment weights.

📊 Historical Valuation Multiples

Real-time Trailing Twelve Month (TTM) momentum side-by-side with discrete quarterly metrics.

Fiscal QuarterTTMQ1 2026Q4 2025Q3 2025Q2 2025Q1 2025Q4 2024Q3 2024Q2 2024
Period EndingTrailing 12MMar 31, 2026Dec 31, 2025Sep 30, 2025Jun 30, 2025Mar 31, 2025Dec 31, 2024Sep 30, 2024Jun 30, 2024
Market Cap ($M)2622833374735936738029433,009
Enterprise Value ($M)72932925937289171,0481813,342
Price to Earnings Ratio (P/E)1.4975.480.63-19.183.1954.56-34.420.733.16
Price/Earnings-to-Growth Ratio (PEG)0.300.14
Price to Sales Ratio (P/S)2.8021.8216.8517.4417.7215.80-15.7010.3926.02
Price to Book Ratio (P/B)0.780.841.011.531.221.301.550.361.29
Price to Free Cash Flow Ratio (P/FCF)48.54-39.50-39.7591.7437.35271.92-26.1325.6645.26
Enterprise Value to Sales (EV/Sales)7.1814.6121.8821.7521.51-20.531.9928.89
Enterprise Value to EBITDA (EV/EBITDA)0.2916.151.7067.5811.2141.57158.230.4811.24
Debt to Equity Ratio-0.760.010.220.810.590.580.580.110.65

SITC Growth Runway Model

Standard long term linear growth fade

Multi-Stage Discounted Cash Flow Sandbox

Market Price$4.99
Intrinsic Value$3.22
Market Alignment
Overvalued by 35.5%relative to calculated intrinsic value
9.00%
Exp: -10%-10%
i

Growth runway slowdown

This value provides a time window for the growth rate to decline beyond Stage 1 toward the terminal rate. Longer windows are most useful for companies with high growth starting conditions or strong competitive advantages. This option stretches out the growth rate slowdown across 5, 10, or 15-year steps. A high-growth starting condition (exceeding a 25% initial growth rate) automatically applies a curve decay to simulate realistic, rapid market saturation.
i

Terminal growth rate

With long-term inflation between 3-5%, revenue must grow by that baseline to maintain flat real-world market share. This value sets the permanent terminal growth rate to factor into the valuation beyond the growth slowdown runway toward maturity.

3-Stage Financial Runway Horizon

🧠 Perpetuity Horizon Engine (Stage 3: Post-2035)

Terminal FCF Base$0.02B
Perpetuity TV Value$0.35B
Discounted TV (PV)$0.15B
TV Weighting %40.1%
⚠️
Financial Model Disclaimer & Risk Disclosure: This interactive scenario simulator is an educational sandbox provided strictly for informational and analytical research purposes. Core historical financial statements and consensus estimates are sourced directly via Financial Modeling Prep (FMP). All downstream outputs are entirely deterministic, hypothetical projections generated by combining automated mathematical formulas (including linear interpolation and Gaussian bell-curve decay models) with user-selected variables and third-party financial data inputs. Users assume all liability for trading decisions executed based on these sandbox calculations.

📘 Full Research Report

ℹ️

AI-Generated Research: This report is for informational purposes only.

📘 SITE CENTERS CORP (SITC) — Investment Overview

🧩 Business Model Overview

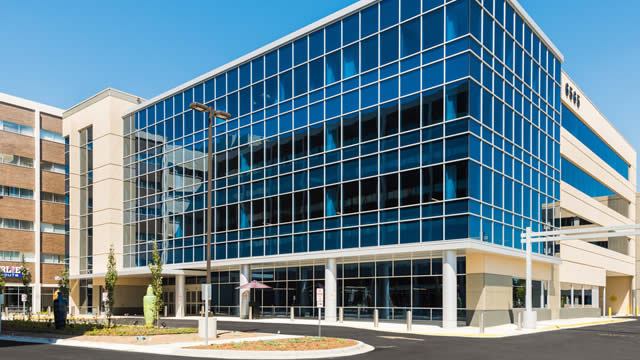
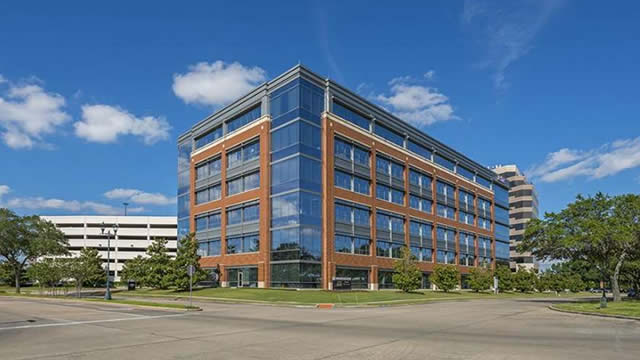
Site Centers Corp is an office REIT focused on owning, operating, and repositioning commercial properties in strategically selected U.S. submarkets. The value chain centers on (1) selecting locations where tenant demand can support durable cash flows, (2) maintaining an operating platform for leasing, capital projects, and property-level cost control, and (3) executing redevelopments/space optimization to retain tenants and improve revenue quality over time. The company’s customer “stickiness” is driven less by brand switching and more by physical and contractual realities: tenant leases, customized build-outs, and the time/cost required to relocate create practical friction that supports lease renewals and re-leasing economics.

💰 Revenue Streams & Monetisation Model

Revenue is primarily property-level rental income, supplemented by recoveries and other pass-throughs tied to operations. Monetisation is influenced by:
  • Lease structure: base rent plus escalations where applicable, with upside tied to leasing spreads and renewal terms.
  • Operating cost recoveries: a meaningful portion of property expenses can be passed through, supporting more stable net operating income when buildings are well maintained.
  • Repositioning and redevelopment: capital projects can increase rentable value through updated amenities, improved layouts, and better alignment with tenant requirements—improving demand and rent potential.
Margin drivers typically come from sustaining occupancy/lease rates, managing controllable operating costs, and producing accretive returns on redevelopment capital while avoiding over-levering properties that face slower leasing cycles.

🧠 Competitive Advantages & Market Positioning

Site Centers’ competitive positioning is best understood as a property-level moat anchored in location selectivity and repositioning capability, rather than a technology-driven advantage. Key moat elements
  • Tenant “switching costs” (lease + build-out economics): office tenants often face relocation costs, downtime, and bespoke space requirements. Well-leased, well-configured buildings benefit from practical friction that can support renewals and mitigate churn.
  • Geographic and submarket selectivity (infrastructure of demand): ownership in submarkets with established employment density and transportation access can stabilize long-term demand versus less-structured markets.
  • Intangible asset: operating and redevelopment execution: the ability to re-lease, refurbish, and reposition space efficiently influences returns on capital and reduces downtime risk.
Competitive benchmarking Primary office REIT peers include:
  • Vornado Realty Trust
  • SL Green Realty
  • Boston Properties
Compared with these rivals—often with heavier exposure to specific gateway-heavy portfolios—Site Centers typically emphasizes a broader set of office properties in targeted U.S. markets where repositioning and asset management can influence tenant retention and leasing outcomes. The strategic contrast is less about having a single “best” skyline and more about managing a portfolio through space optimization and lease-up discipline in varying demand pockets.

🚀 Multi-Year Growth Drivers

Over a 5–10 year horizon, growth is driven by fundamentals that directly translate into property-level cash flow:
  • Reinvestment and repositioning: repositioning aging office layouts toward modern tenant requirements can increase the probability of renewal and reduce vacancy duration.
  • Rent and occupancy normalization within advantaged submarkets: office demand can be cyclical, but submarket selection and property quality can improve resilience and the speed of leasing recovery.
  • Capital allocation and balance-sheet flexibility: disciplined capital recycling (selling lower-return assets and deploying into higher-IRR opportunities) can compound per-share value over time.
  • Tenant demand for flexible, amenity-aligned space: tenants increasingly select space based on workplace functionality, transit access, and building condition—factors that can be influenced by redevelopment.
The TAM for office REITs is not a “new market” story; the value creation is primarily about share-of-demand capture within the office footprint through better assets, better timing of capital projects, and better leasing execution.

⚠ Risk Factors to Monitor

  • Structural office demand risk: sustained shifts in workplace patterns can pressure occupancy, renewal rates, and lease terms.
  • Capital intensity of repositioning: redevelopment success depends on achieving leasing outcomes that justify project costs; delays or cost overruns can impair returns.
  • Refinancing and interest rate risk: REIT cash flows are sensitive to the cost and availability of capital; maturities and debt structure can amplify downside in tight credit environments.
  • Market liquidity and cap-rate expansion: property valuations are linked to cap rates; broader risk-off periods can reduce access to favorable financing and pressure asset values.
  • Tenant concentration and credit quality: leasing outcomes depend on tenant demand and credit; downturns can increase incentives required to secure leases.

📊 Valuation & Market View

Office REIT valuation is typically anchored to cash-flow metrics and property-level fundamentals rather than growth narratives alone. Common market frameworks include:
  • EV / EBITDA or EV / NOI-style comparisons, adjusted by leverage and asset quality
  • Price-to-AFFO / FFO equivalents (sector-specific cash flow lens)
Key valuation drivers include:
  • Interest rates and credit spreads (affecting discount rates and refinancing)
  • Occupancy stability and leasing spreads (supporting NOI)
  • Redevelopment returns (project-level IRR and payback)
  • Balance-sheet strength (debt maturities, interest coverage, and liquidity)

🔍 Investment Takeaway

Site Centers’ long-term thesis rests on owning a portfolio of office properties where submarket selection, lease-level switching friction, and redevelopment execution can preserve and grow net operating income through economic cycles. The investment case is best evaluated through property quality, leasing discipline, capital allocation rigor, and the capacity to convert reinvestment into durable tenant demand.

⚠ AI-generated — informational only. Validate using filings before investing.

📰 Market News & Coverage

15 Stories Available

Real-time institutional reporting and market updates for SITC.

businesswire.com2026-05-07

SITE Centers Reports First Quarter 2026 Results

BEACHWOOD, Ohio--(BUSINESS WIRE)--SITE Centers Reports First Quarter 2026 Results.

businesswire.com2026-05-04

SITE Centers Announces Sale of Meadowmont Crossing

BEACHWOOD, Ohio--(BUSINESS WIRE)--SITE Centers Announces Sale of Meadowmont Crossing.

businesswire.com2026-04-23

SITE Centers' First Quarter 2026 Earnings to be Released Thursday, May 7, 2026

BEACHWOOD, Ohio--(BUSINESS WIRE)--SITE Centers' First Quarter 2026 Earnings to be Released Thursday, May 7, 2026.

businesswire.com2026-03-03

SITE Centers Announces Sale of 3030 North Broadway

BEACHWOOD, Ohio--(BUSINESS WIRE)--SITE Centers Announces Sale of 3030 North Broadway.

seekingalpha.com2026-03-02

REIT Replay: U.S. REIT Indexes Outperform Broader Market During Last Week Of Feb.

The Dow Jones Equity All REIT index continued to rise during the final week of February, up 0.97%. Looking at the Dow Jones US real estate property sector indexes, the retail REIT index logged the largest increase over the past week, up 1.53%. On the other end, the office REIT index fell 3.02% during the week, while the hotel and self-storage REIT indexes also declined 0.45% each.

businesswire.com2026-02-27

SITE Centers Announces Sale of FlatAcres MarketCenter

BEACHWOOD, Ohio--(BUSINESS WIRE)--SITE Centers Announces Sale of FlatAcres MarketCenter.

businesswire.com2026-02-26

SITE Centers Reports Fourth Quarter and Full-Year 2025 Results

BEACHWOOD, Ohio--(BUSINESS WIRE)--SITE Centers Reports Fourth Quarter and Full-Year 2025 Results.

businesswire.com2026-02-11

SITE Centers' Fourth Quarter 2025 Earnings to be Released Thursday, February 26, 2026

BEACHWOOD, Ohio--(BUSINESS WIRE)--SITE Centers' Fourth Quarter 2025 Earnings to be Released Thursday, February 26, 2026.

businesswire.com2026-01-20

SITE Centers Announces Tax Allocations of 2025 Dividend Distributions

BEACHWOOD, Ohio--(BUSINESS WIRE)--SITE Centers Announces Tax Allocations of 2025 Dividend Distributions.

businesswire.com2026-01-16

SITE Centers Announces Sale of Partnership Interests

BEACHWOOD, Ohio--(BUSINESS WIRE)--SITE Centers Announces Sale of Partnership Interests.

seekingalpha.com2026-01-10

U.S. Equity REITs Trade At Median 15% Discount To Analyst Price Targets

All 123 publicly traded US equity real estate investment trusts analyzed by S&P Global Market Intelligence traded below their respective consensus price target estimates. The specialty sector, which includes advertising, casinos, communications, data centers, energy infrastructure, farmland and timber, had the largest median implied upside to its consensus price target estimate, at 22.6%. REITs in the self-storage segment showed a 20.6% median implied upside to their consensus price target estimates, while the office sector followed closely at 18.7% and the residential sector at 15.4%.

businesswire.com2025-12-31

SITE Centers Announces Sale of Perimeter Pointe

BEACHWOOD, Ohio--(BUSINESS WIRE)--SITE Centers Announces Sale of Perimeter Pointe.

seekingalpha.com2025-12-23

REIT Replay: U.S. REIT Indexes Fall During Week Ended Dec. 19

Indexes for US real estate investment trusts fell during the week ended Dec. 19. The Dow Jones Equity All REIT index dropped 1.18% over the recent week, while the MSCI US REIT index also fell 0.84%. The broader stock market indexes diverged for the week, with the S&P 500 up a slight 0.10% but the Dow Jones Industrial Average down 0.67%.

defenseworld.net2025-12-15

Caxton Associates LLP Sells 219,046 Shares of Site Centers Corp. $SITC

Caxton Associates LLP cut its stake in shares of Site Centers Corp. (NYSE: SITC) by 55.8% during the undefined quarter, according to its most recent 13F filing with the Securities and Exchange Commission. The fund owned 173,254 shares of the company's stock after selling 219,046 shares during the quarter. Caxton Associates LLP owned

businesswire.com2025-12-11

SITE Centers Announces Sale of Downtown Short Pump

BEACHWOOD, Ohio--(BUSINESS WIRE)--SITE Centers Announces Sale of Downtown Short Pump.

📊 AI Financial Analysis

Powered by StockMarketInfo
Earnings Data: Q Ending 2025-12-31

"SITC’s most recent quarter (2025-12-31) reported Revenue of $19.98M and Net Income of $134.43M (EPS $2.58). Versus the prior quarter (QoQ, 2025-09-30), Revenue fell from $27.10M to $19.98M (-26.3%) while Net Income improved from a loss of -$6.16M to +$134.43M. Versus the same quarter last year (YoY, 2024-12-31), Net Income swung from -$5.82M to +$134.43M (turnaround; not a meaningful percentage due to sign change), while Revenue shifted from -$51.06M to +$19.98M, indicating extreme quarter-to-quarter variability in the dataset. Over the last four quarters, profitability appears highly volatile, with some quarters showing losses and others large gains; therefore, net margin direction is best described as “unstable,” not steadily expanding or contracting. The balance sheet shows equity instability previously (total equity surged at 2025-06-30, then declined by 2025-12-31), while leverage improved in the latest quarter: net debt flipped to -$44.8M (net cash) from +$120.5M in 2025-09-30. Shareholder returns are weak: the stock is down -52.1% over 1 year. Dividend yield is low (latest ~0.31%) and buybacks aren’t indicated in the provided data. On valuation, the consensus price target of $8 vs $5.58 implies ~43% upside, supporting a higher “valuation/expectation” score despite poor momentum."

Revenue Growth

Neutral

QoQ Revenue declined -26.3% (27.10M → 19.98M). YoY Revenue changed from -51.06M (2024-12-31) to +19.98M (2025-12-31), which is a swing rather than interpretable growth, indicating significant volatility.

Profitability

Caution

Net Income improved sharply QoQ (-6.16M loss → +134.43M gain; turnaround). YoY also swung from -5.82M to +134.43M. However, profitability is erratic across quarters, so margins are not demonstrating a consistent trend of expansion.

Cash Flow Quality

Caution

No cash flow statement is provided. The latest quarter shows a major earnings recovery (+134.43M), and dividends are present but small (~0.31% yield). Buybacks are not evidenced in the dataset.

Leverage & Balance Sheet

Neutral

Net debt improved meaningfully to net cash in the latest quarter (-44.8M) from +120.5M (2025-09-30). Total assets and equity are volatile across the period, but the latest quarter indicates improved balance-sheet resilience.

Shareholder Returns

Neutral

Total return is likely negative given price momentum: 1Y change is -52.1%. Dividend yield is low (latest ~0.31%), so shareholder returns are not supported by income.

Analyst Sentiment & Valuation

Neutral

Consensus target $8 vs current $5.58 implies ~43% upside. This supports valuation optimism, though it may be contingent on stabilization of earnings given recent volatility.

Disclaimer:This analysis is AI-generated for informational purposes only. Accuracy is not guaranteed and this does not constitute financial advice.

Fundamentals Overview

Loading fundamentals overview...

Management’s tone is confident and execution-focused ahead of the October 1 Curbline spin—highlighting $951M of closed dispositions YTD, ~$1B under contract at mid-7%s cap rates, and Q2 transactions nearing $1B, alongside a $600M/$0-debt target for CURB. However, the Q&A reveals nearer-term friction points that can swing operating optics: leased rate fell 100 bps sequentially, tied to asset sales (assets averaged ~97% leased) and Meadowmont’s vacant space. On capex intensity, Conor cautioned that the spend % of NOI has ticked up toward ~10% in recent quarters due to higher leasing volume, even while claiming long-term confidence that it stays sub-10%. Analyst pressure also probed occupancy variability; management repeatedly stressed that they are buying renewals/stabilized assets (confidence in 96%–98% leased) rather than vacancy, but admitted structured tenant recycling may occur when locals hit rent ceilings. Overall: positive for the portfolio thesis, but candid about operational variability during the transition and sale/acquisition timing.

AI IconGrowth Catalysts

  • Curbline convenience same-store NOI expected to average >3% for next three years (management commentary)
  • 24% trailing 12-month new leasing spreads for the Curbline portfolio
  • Almost 50% straight-line, new leasing rent spreads for trailing 12-month period
  • Tenant demand driven by shortage of high-quality convenience real estate in suburban communities; renewals focus

Business Development

  • Convenience acquisitions in Q2: 5 properties with total acquisition share of ~$65M (includes partner interest in Meadowmont Village, Chapel Hill, NC; expected to be included in CURB spin-off)
  • New/recent first-to-portfolio and recurring national tenants mentioned: Cava, Panda Express, Wells Fargo, UPS Store, LensCrafters, Comcast
  • Two vintage restaurant pads recaptured: Phoenix and Orlando (backfilled with expected blended 75% mark-to-market on new deals)

AI IconFinancial Highlights

  • Spin-off timing: expected October 1 completion for Curbline (Curb capitalized with no debt and $600M cash expected at spin)
  • Transactions: nearly $1B of transactions closed in the quarter
  • Debt: repurchased/retired >$50M of debt in the quarter; Q2 repurchased just under $27M of unsecured bonds at a discount, generating ~$300k gain
  • Dispositions: $951M wholly-owned property sales closed YTD as of last Friday; total closed dispositions since July 1, 2023 just over $1.8B at blended cap rate 7.1%
  • Pipeline: >$1B additional real estate under contract/LOI at blended cap rate in the mid-7%s
  • Leasing: leased rate down 100 bps sequentially (impacted by selling assets with ~97% leased rate; and Meadowmont acquisition of vacant space; two pads recapture accounted for remainder)
  • Leasing spreads: Curbline leasing activity/economics improving; almost 50% straight-line new leasing rent spreads (T12M)
  • Curbline portfolio size: 72 wholly-owned convenience properties / 2.4M sq ft; expected to generate about $84M NOI
  • 2024 NOI outlook (no formal FFO guidance range due to spin/transaction activity): Curb portfolio total NOI now ~$84M in 2024 vs $79M prior midpoint; same-store NOI growth expected 3.5%–5.5% for 2024
  • SITE portfolio 2024 total NOI expected $201M at midpoint before additional dispositions; includes only properties owned as of June 30
  • Other Q3 assumptions: JV fees ~$1.25M and G&A ~$12M in Q3
  • Interest income: almost $9M in Q2 (expected to decline over remainder of year as cash used to repay debt)
  • Q2 FFO drivers: $11.2M NOI from assets sold in the quarter

AI IconCapital Funding

  • Cash on hand: over $1.1B at quarter-end
  • Leverage: debt-to-EBITDA just over 3x at quarter-end
  • Expected SITE Centers mortgage facility close: middle of Q3 (subject to conditions); proceeds + cash expected to retire outstanding unsecured debt (all outstanding unsecured notes and unsecured term loan)
  • Curbline expected at spin: no debt and $600M cash

AI IconStrategy & Ops

  • Curbline platform building: separate leasing/property management teams for Curb and SITE post-spin; shared services remain within SITE (accounting, legal, IT) under a shared-services agreement to minimize G&A friction
  • Curbline staffing/accounting/legal leaders to be dedicated to each company; other departments shared
  • Leasing measurement nuance (Curbline): leasing spreads include all units including those vacant >12 months; exclusions only for first-generation space and units vacant at time of acquisition

AI IconMarket Outlook

  • Spin-off expected October 1, with additional pro forma portfolio/run-rate/balance-sheet details planned prior to spin for third quarter-to-date transactions
  • No formal 2024 FFO guidance range provided (explicitly due to expected spin-off and significant transaction activity)
  • SITE and Curb portfolio NOI projections updated reflecting first-half acquisitions/dispositions (as detailed in financial highlights)

AI IconRisks & Headwinds

  • Occupancy/leased-rate pressure: leased rate down 100 bps sequentially (sell-down of ~97% leased-rate assets; Meadowmont acquisition included vacant space; two restaurant pad recapture effects offset differently)
  • Cap-rate/spend sensitivity: Q&A caution that pool size/dominator is small; management confidence that long-term spend (capex as % of NOI) remains sub-10%, but recent quarters moved up due solely to increased leasing activity
  • Geography-specific risk: potential California headwinds discussed (West Coast ~13% of portfolio); management stated no internal mandate to avoid geographies but acknowledged possible lag
  • Macro recession risk acknowledged: management said recession would likely reduce occupancy and link NOI growth to GDP/sales with a two-quarter lag; mitigation framed as credit-focused underwriting and diversified tenant base

Sentiment: POSITIVE

Note: This summary was synthesized by AI from the SITC Q2 2024 earnings transcript. Financial data is complex; please verify all metrics against official SEC filings before making investment decisions.

📋 Official Regulatory 10-K / 10-Q SEC Filings

Direct authenticated documentation links to audited SEC database reports for SITC.

SEC EDGAR Live Feed
Loading financial data and tables...
📁

SEC Filings (SITC)

© 2026 Stock Market Info — SITE Centers Corp. (SITC) Financial Profile