SiTime Corporation

SiTime Corporation (SITM) Market Cap

SiTime Corporation has a market capitalization of $16.52B.

Price: $625.68

-81.30 (-11.50%)

Market Cap: 16.52B

NASDAQ · time unavailable

CEO: Rajesh Vashist

Sector: Technology

Industry: Semiconductors

IPO Date: 2019-11-20

Website: https://www.sitime.com

SiTime Corporation (SITM) - Company Information

Market Cap: 16.52B|Sector: Technology

Company Profile

SiTime Corporation designs, develops, and sells silicon timing systems solutions in Taiwan, Hong Kong, the United States, and internationally. The company provides resonators and clock integrated circuits, and various types of oscillators. Its solutions have applications in various markets, including communications and enterprise, automotive, industrial, Internet of Things, mobile, consumer, and aerospace and defense. The company sells its timing products through distributors and resellers. SiTime Corporation was incorporated in 2003 and is headquartered in Santa Clara, California.

Analyst Sentiment

89%
Strong Buy

From 9 Active Polls

1Y Forecast: $664.17

▲ +6.2% Potential Upside

Consensus Target Metrics

Low Bound

$450

Median

$650

High Bound

$900

Average

$664

Price & Moving Averages

Loading chart...

🎯 Wall Street Analyst Intelligence Report

1-Year structural target targets, chart projections, and sentiment maps.

Average 1Y Target
$664.17
▲ +6.15% Upside
Low Target
$450.00
-28% Risk
Median Target
$650.00
4% Mid
High Target
$900.00
44% Max
Consensus
Buy
9 / 9 Buys

Consensus Trend Projection

Trailing closures vs. 12-month metrics map.

Analyst Vote Distribution

Aggregate institutional coverage sentiment weights.

📊 Historical Valuation Multiples

Real-time Trailing Twelve Month (TTM) momentum side-by-side with discrete quarterly metrics.

Fiscal QuarterTTMQ1 2026Q4 2025Q3 2025Q2 2025Q1 2025Q4 2024Q3 2024Q2 2024
Period EndingTrailing 12MMar 31, 2026Dec 31, 2025Sep 30, 2025Jun 30, 2025Mar 31, 2025Dec 31, 2024Sep 30, 2024Jun 30, 2024
Market Cap ($M)16,5169,0989,2547,8495,0983,6165,0343,9852,818
Enterprise Value ($M)16,0208,6029,2427,8264,9303,5835,0353,9842,808
Price to Earnings Ratio (P/E)-679.85-435.96252.40-244.84-63.15-37.86-66.90-51.58-26.32
Price/Earnings-to-Growth Ratio (PEG)-1745.127.10-12.09-4.15-3.71-1.64-0.80
Price to Sales Ratio (P/S)43.4780.1181.6993.9273.3559.9573.9169.0764.24
Price to Book Ratio (P/B)14.227.858.007.114.635.227.195.724.07
Price to Free Cash Flow Ratio (P/FCF)305.07509.13724.83298.83-1846.26-2568.06-2015.36-609.76-1008.53
Enterprise Value to Sales (EV/Sales)75.7481.5893.6570.9459.4073.9269.0464.01
Enterprise Value to EBITDA (EV/EBITDA)2542.521121.52967.543834.32-380.36-204.63-401.38-275.20-132.25
Debt to Equity Ratio-78.640.000.000.000.000.010.010.010.01
⚠️

Valuation Model Suspended

API Payload Error: Inverted or negative baseline Free Cash Flow margin detected (-36.6%).

Troubleshooting Notice: The upstream financial data supplier has uploaded corrupted or inverted baseline metrics for SITM. The server sandbox cannot calculate an intrinsic value path from negative cash generation baselines.

📘 Full Research Report

ℹ️

AI-Generated Research: This report is for informational purposes only.

📘 SITIME CORP (SITM) — Investment Overview

🧩 Business Model Overview

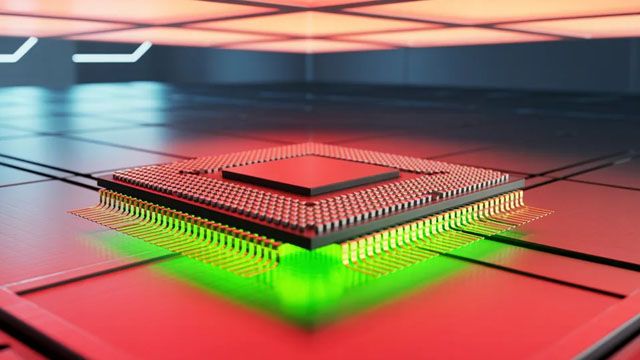
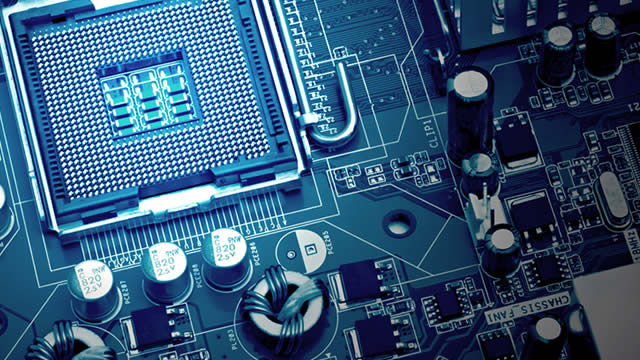
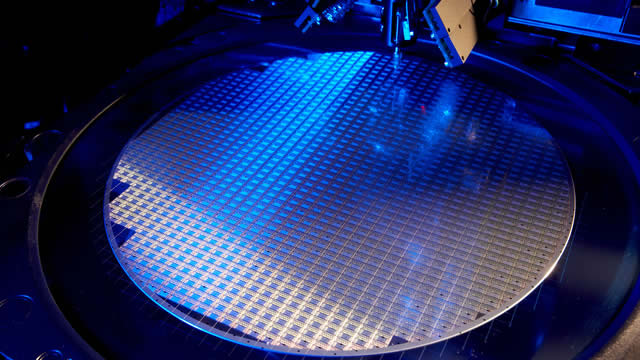
SiTime designs and manufactures semiconductor-based timing devices (MEMS resonator and oscillator solutions) used in electronic systems that require highly accurate frequency stability. The value chain runs from silicon/MEMS design and fabrication through device qualification and supply to OEMs and tier-one equipment manufacturers, with downstream products spanning communications, networking, industrial control, and automotive/embedded systems.

A practical “how it works” dynamic is that customers evaluate SiTime’s timing components through engineering design-in and qualification processes, then place orders based on their platform volumes. Because timing components directly affect system performance and compliance, replacements require validation, which creates durable customer stickiness once a design is adopted.

💰 Revenue Streams & Monetisation Model

Revenue is primarily product-driven, tied to the volume of timing oscillators and related components shipped into customer platforms. Monetisation is influenced by:

  • Product mix and specification tiering: higher-performance devices and more integration typically carry better margins.
  • Manufacturing scale and yield: semiconductor/MEMS businesses tend to improve gross margin as utilization and process maturity rise.
  • Customer platform adoption: once a timing device is designed into a system, subsequent orders tend to track that system’s production cycle.

While the model is not “recurring revenue” in the SaaS sense, it can show quasi-recurring characteristics through repeat demand tied to long-lived platform deployments and engineering re-uses across device families.

🧠 Competitive Advantages & Market Positioning

SiTime’s economic moat is rooted in switching costs and intangible assets, reinforced by performance differentiation in harsh operating conditions.

  • Switching Costs (Design-In / Qualification): timing components must meet stringent frequency accuracy, stability, and environmental requirements. Substituting a qualified solution for an alternate oscillator typically involves re-validation across temperature, vibration/shock, power sequencing, and long-term reliability testing.
  • Intangible Assets (MEMS/Timing IP and Process Know-how): specialized MEMS resonator design, calibration approaches, and manufacturing process control create know-how that is difficult to replicate quickly.
  • Performance-Based Differentiation: MEMS timing solutions can offer advantages versus traditional quartz in applications where size, robustness, and stability over temperature and aging are critical.

Competitive benchmarking

  • Epson (quartz-based timing and oscillators): focuses heavily on established quartz oscillator ecosystems; SiTime competes by offering MEMS-based alternatives aimed at system-level robustness and stability needs.
  • Murata (quartz components and timing solutions): strong incumbent distribution and deep design-in footprint; SiTime targets platform segments where the cost of environmental sensitivity and the value of miniaturization favor MEMS.
  • TXC Corporation (crystal oscillators): competes on volume, reliability, and breadth of crystal-based SKUs; SiTime’s positioning centers on replacing portions of the quartz oscillator value proposition in demanding environments.

Relative to these rivals, SiTime’s industry focus centers on MEMS-based silicon timing where reliability and operational stability under real-world stressors matter more than pure unit cost alone.

🚀 Multi-Year Growth Drivers

Over a 5–10 year horizon, growth depends on the addressable demand for precise timing and the ongoing replacement of legacy timing approaches in systems that face higher bandwidth, tighter synchronization requirements, and greater environmental stress.

  • Higher timing precision requirements: 5G/advanced wireless, networking equipment, and data-centric computing architectures increase the value of stable clocking.
  • Harsh environment and miniaturization trends: automotive and industrial electronics increasingly demand robust performance over temperature and vibration while reducing component size.
  • Platform reuse and qualification-driven adoption: once a timing component is validated for a customer’s design family, subsequent product refreshes can reuse the timing architecture.
  • TAM expansion in communications and infrastructure: secular growth in connectivity and compute density supports broader deployment of timing devices across equipment categories.

⚠ Risk Factors to Monitor

  • Customer adoption and qualification cycles: design-in timelines can extend due to system validation, regulatory requirements, or internal customer platform choices.
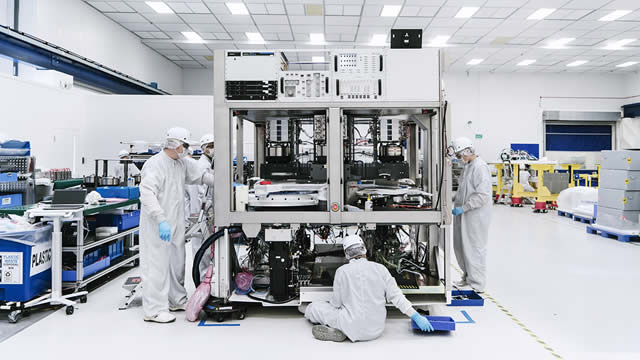
  • Manufacturing scalability and yield: MEMS/semiconductor complexity makes gross margin and delivery performance sensitive to process learning curves and operational execution.
  • Competitive pricing pressure: incumbent quartz suppliers and integrated timing players may respond with price, capacity, or packaging/product-bundling strategies.
  • Concentration and product mix risk: meaningful revenue exposure to a limited set of customer platforms or performance tiers can amplify cyclical swings.
  • Technology transition risk: the pace of alternative timing technologies and changing system design architectures may shift the relative attractiveness of MEMS solutions.

📊 Valuation & Market View

The market typically values semiconductor device companies using revenue growth potential, gross margin trajectory, and operating leverage, with multiples frequently expressed via EV/EBITDA and/or P/S depending on profitability visibility. Key valuation drivers for this category include:

  • Gross margin expansion: reflecting manufacturing yield improvement and favorable mix.
  • Sustainable unit growth: driven by platform adoption and sustained demand.
  • Expense discipline: operating expense growth versus revenue growth, especially R&D intensity tied to roadmap execution.

A positive market re-rating generally requires evidence of enduring design wins translating into scale, improving profitability, and robust product mix.

🔍 Investment Takeaway

SiTime presents a structurally defensible position in MEMS-based precision timing where design-in switching costs and technical IP/process know-how help convert product performance into durable customer relationships. The long-term opportunity is tied to secular demand for accurate synchronization in communications, networking, and embedded/automotive systems, with upside contingent on scaling manufacturing execution and sustaining platform adoption against well-capitalized quartz incumbents.


⚠ AI-generated — informational only. Validate using filings before investing.

📰 Market News & Coverage

15 Stories Available

Real-time institutional reporting and market updates for SITM.

fool.com2026-06-04

Vanguard vs. JPMorgan: Which is the Better Small-Cap ETF?

Portfolio size and sector mix set these small-cap ETFs apart for investors weighing long-term growth and income potential.

globenewswire.com2026-05-28

SiTime to Present at the Evercore Global TMT Conference on June 3, 2026

SANTA CLARA, Calif., May 28, 2026 (GLOBE NEWSWIRE) -- SiTime Corporation (Nasdaq: SITM), the Precision Timing company, today announced that SiTime's chief financial officer, Beth Howe, will participate at the Evercore Global TMT Conference to be held at The Omni Hotel, San Francisco.

gurufocus.com2026-05-20

SiTime Corporation Announces Pricing of Upsized Offering of $1.2 Billion of Convertible Senior Notes

SiTime Corporation (“SiTime”) (NASDAQ: SITM), the Precision Timing company, today announced the pricing of its underwritten offering (the “Offering”) o

businesswire.com2026-05-20

SiTime Corporation Announces Pricing of Upsized Offering of $1.2 Billion of Convertible Senior Notes

SANTA CLARA, Calif.--(BUSINESS WIRE)--SiTime Corporation (“SiTime”) (NASDAQ: SITM), the Precision Timing company, today announced the pricing of its underwritten offering (the “Offering”) of $1.2 billion aggregate principal amount of 0% Convertible Senior Notes due 2031 (the “Notes”). The aggregate principal amount of the Offering was increased from the previously announced offering size of $1.1 billion. The sale of the Notes to the underwriters is expected to close on May 22, 2026, subject to.

zacks.com2026-05-19

SiTime Benefits From Holistic Growth Initiatives: Reason to Buy?

SITM pairs AI and data-center demand with a planned Renesas timing business buy to broaden products and fuel long-term growth.

globenewswire.com2026-05-19

SiTime Corporation Announces Proposed Convertible Senior Notes Offering

SANTA CLARA, Calif., May 19, 2026 (GLOBE NEWSWIRE) -- SiTime Corporation (“SiTime”) (NASDAQ: SITM), the Precision Timing company, today announced its intent to offer, subject to market conditions and other factors, $1.1 billion aggregate principal amount of Convertible Senior Notes due in 2031 (the “Notes”) in an underwritten offering (the “Offering”). SiTime also intends to grant the underwriters of the Notes a right to purchase, within a 13-day period beginning on, and including, the date on which the Notes are first issued, up to an additional $150 million aggregate principal amount of Notes, solely to cover over-allotments, if any.

gurufocus.com2026-05-18

SiTime Corp (SITM) Shares Fall 6.3% -- GF Value Says Still Overvalued

On May 18, 2026, SiTime Corp (SITM) shares fell 6.3% today, bringing the current price to $725.59. The stock has seen significant volatility over the past year,

zacks.com2026-05-18

Earnings Estimates Rising for SiTime (SITM): Will It Gain?

SiTime (SITM) shares have started gaining and might continue moving higher in the near term, as indicated by solid earnings estimate revisions.

zacks.com2026-05-18

Best Momentum Stocks to Buy for May 18th

SITM, DK, and ECO made it to the Zacks Rank #1 (Strong Buy) momentum stocks list on May 18, 2026.

gurufocus.com2026-05-11

Is SiTime Corp (SITM) Overvalued After 8.1% Rally? GF Value Says Overvalued

On May 11, 2026, SiTime Corp (SITM) shares rose 8.1%, bringing the current price to $901.48. This performance comes after an impressive run, with the stock reac

businesswire.com2026-05-11

SiTime Announces Expiration of Hart-Scott-Rodino Waiting Period

SANTA CLARA, Calif.--(BUSINESS WIRE)--SiTime Corporation (Nasdaq: SITM) (“SiTime” or the “Company”), the Precision Timing company, today announced that the waiting period under the Hart-Scott-Rodino Antitrust Improvements Act of 1976, as amended (“HSR Act”), expired at 11:59 p.m. Eastern Time on May 8, 2026, in connection with its pending acquisition of certain assets from Renesas Electronics America Inc., a subsidiary of Renesas Electronics Corporation (TSE: 6723) (“Renesas”), pursuant to the.

seekingalpha.com2026-05-07

SiTime Corporation (SITM) Q1 2026 Earnings Call Transcript

SiTime Corporation (SITM) Q1 2026 Earnings Call Transcript

fool.com2026-05-07

Why SiTime Rallied Today

SiTime delivered impressive growth on its first quarter earnings report.

barrons.com2026-05-07

This Sneaky AI Play Nearly Doubles Sales. The Stock Is Rising 32%.

SiTime reports a massive year-over-year jump in earnings and revenue in the first quarter.

zacks.com2026-05-06

SiTime (SITM) Q1 Earnings and Revenues Beat Estimates

SiTime (SITM) came out with quarterly earnings of $1.44 per share, beating the Zacks Consensus Estimate of $1.14 per share. This compares to earnings of $0.26 per share a year ago.

📊 AI Financial Analysis

Powered by StockMarketInfo
Earnings Data: Q Ending 2026-03-31

"SITM reported Q1’26 revenue of $113.6M (+0.3% QoQ; +88.4% YoY). Net loss was $5.2M (EPS: -$0.20), versus net income of $9.2M in Q4’25 (QoQ deterioration) and net loss of $23.9M in Q1’25 (improvement YoY). Gross margin rose to ~58.96% in Q1’26 from ~56.39% in Q4’25 and ~50.30% in Q1’25, indicating improving unit economics, but operating margin swung back to -10.9% from +4.2% due to higher operating expenses and still-elevated R&D spend. On a cash-flow basis, operating cash flow was +$31.2M, turning free cash flow positive at +$17.9M in Q1’26. The balance sheet remains very liquid: cash and short-term investments were $498.5M, with total assets of $1.29B and total equity of ~$1.16B. Leverage is minimal (no short-term or long-term debt reported; net debt is strongly negative). Shareholder returns look highly positive: the stock is up ~288% over the past year (well above a 20% 1y momentum threshold). However, the valuation appears demanding given heavy negative earnings (P/E not meaningful) and very high price-to-sales/price-to-book metrics. No dividends are paid and there were no buybacks reported in Q1’26, so total return is driven primarily by capital appreciation."

Revenue Growth

Positive

Revenue was $113.6M in Q1’26, up ~0.3% QoQ from $113.3M and up ~88.4% YoY from $60.3M—strong YoY momentum with flat-ish QoQ.

Profitability

Caution

Gross margin improved to ~59.0% vs ~56.4% QoQ and ~50.3% YoY, but operating margin fell to -10.9% from +4.2% QoQ. Net income swung to a loss of -$5.2M (from +$9.2M QoQ) despite improving YoY.

Cash Flow Quality

Positive

Q1’26 operating cash flow was +$31.2M and free cash flow was +$17.9M, even with net income negative (-$5.2M), suggesting working-capital/operating factors supporting cash generation. No dividends; no buybacks reported.

Leverage & Balance Sheet

Strong

Highly resilient balance sheet: cash/short-term investments of ~$498.5M and net debt of -$498.5M with no reported debt. Total equity is ~$1.16B and total assets are ~$1.29B.

Shareholder Returns

Strong

Total shareholder performance is strongly positive, driven by capital appreciation: ~+288% 1y_change. Dividend yield is 0% and Q1’26 buybacks were reported as none.

Analyst Sentiment & Valuation

Caution

Valuation appears stretched: very high price-to-sales/price-to-book metrics, and earnings are negative. Price action is strong, but the provided consensus target range (low 350, high 900; consensus ~619) implies meaningful volatility around fundamentals.

Disclaimer:This analysis is AI-generated for informational purposes only. Accuracy is not guaranteed and this does not constitute financial advice.

Fundamentals Overview

Loading fundamentals overview...

So What?: SiTime delivered a strong Q1 2026 and raised full-year growth to at least 80% as AI inference and data-center networking drive higher timing content and pricing. Revenue jumped 88% YoY to $113.6M, EPS rose from $0.26 to $1.44, and gross margin expanded 7.1 points to 64.5% alongside a 25-point operating margin expansion to 28%. The company’s demand narrative is anchored on inference workloads requiring 2–4x more timing content than training, with GPU utilization scaling toward 50–60%, and faster adoption of 1.6T optical modules in 2026. Product leadership is reinforced by Elite 2 Super TCXOs (up to 3x better synchronization vs Elite) and higher timing content in CPO switches. Guidance implies continued momentum in Q2 (revenue $140–$150M; gross margin ~65%±1; non-GAAP EPS $1.85–$2). Key caution is gross margin modulation as consumer mix normalizes in the back half; supply chain risks were downplayed as capacity remains solid.

AI IconGrowth Catalysts

  • CED driven by AI inference infrastructure: switches, XPUs, and inference workloads requiring 2 to 4x more timing content than training
  • Rising data-center networking bandwidth adoption: expected meaningful adoption of 1.6 terabit optical modules in 2026
  • Elite 2 Super TCXO ramp: up to 3x better synchronization performance vs Elite (already better than quartz), targeting higher ASP/timing content and a $1.5B cumulative SAM over 5 years
  • CPO/Co-packaged optics strength: timing content can be up to 3x higher for CPO switches
  • Aerospace/defense growth supported by LEO demand: up to $2,000 STM content per satellite; expectation of 7,000 to 10,000 LEO launches over the next 3 years
  • Mobile/IoT/consumer traction: Titan resonators gaining momentum with semiconductor partners and OEMs; funnel grew to $400M since introduction
  • Channel pull-through sustaining book-to-bill growth while keeping inventories at target levels

Business Development

  • Announced Renesas acquisition of the Renesas timing business remains on track (guidance explicitly excludes any benefit yet-to-close)
  • Supply-side named sources: MEMS chips from Bosch; analog chips largely from TSMC (180nm/150nm/130nm geometry) mentioned as in good shape
  • Ecosystem: sells into 15 to 20 module makers and broader connectivity ecosystem (named individuals not provided)

AI IconFinancial Highlights

  • Revenue: $113.6M in Q1 2026, +88% YoY; sequentially essentially flat vs Q4
  • EPS: increased fivefold from $0.26 to $1.44
  • Gross margin: 64.5%, up 7.1 percentage points YoY
  • Operating margin: 28%; expanded by 25 percentage points from 3% in Q1 2025; operating income $31.8M (+$29.8M YoY)
  • Q2 guidance: revenue $140M to $150M (up >100% YoY at mid), gross margin ~65% +/-1 point, OpEx $46M to $47M, non-GAAP EPS $1.85 to $2
  • Full-year guidance update: revenue growth expectations increased to at least 80% (vs prior expectations; above 25% to 30% long-term target)
  • Working capital: DSO 44 days vs 36 days in Q4 (DSO increased as revenue linearity normalized); inventory $91.1M vs $81.6M in Q4
  • Q1 liquidity: cash and short-term investments $789M; operating cash flow $31.2M (more than doubled from $15M a year ago)
  • Gross margin trajectory commentary: consumer mix expected to rise in back half and may modulate gross margins; gross margins still expected above 60% and toward higher end of target range

AI IconCapital Funding

  • Cash & short-term investments: $789M at end of Q1
  • Operating cash flow: $31.2M in Q1 (vs $15M a year ago)
  • No buyback amounts or debt balances explicitly provided in the transcript excerpt

AI IconStrategy & Ops

  • Back-end capacity and cost productivity improvements: automation changes and AI use in test programs/characterization in 2024–2025 timeframe, enabling speed with less CapEx than typical
  • Supply chain posture: 'capacity is very solid'; OSAT timing volume challenges characterized as typical execution issues that are solvable
  • Optimization target for inference efficiency: GPU utilization now 20% to 40%, targeted to reach 50% to 60% (timing content supports this)
  • Investment philosophy: continue investing in people, systems, and technology to improve productivity and deliver products faster; potentially invest a little more than historical levels tied to revenue growth capture

AI IconMarket Outlook

  • Full-year 2026: revenue growth expected at least 80%
  • Q2 2026: revenue $140M to $150M; gross margin ~65% +/-1 point; non-GAAP EPS $1.85 to $2; share count ~27.5M; interest income ~ $5M; OpEx $46M to $47M
  • LED/AI timing adoption forward signals: hyperscalers increasing networking bandwidth; expectation of meaningful adoption of 1.6T optical modules in 2026
  • Aerospace/defense: expectation of $100M aerospace defense revenue over the next few years

AI IconRisks & Headwinds

  • Gross margin potential headwind: Q1 mix benefits likely 'normalize' as consumer becomes a larger share in back half; consumer products have lower gross margins (risk to gross margin expansion beyond guided range)
  • Working capital: DSO increased to 44 days from 36 days in Q4 as revenue linearity normalized (potential cash timing risk)
  • Manufacturing execution constraint: 'challenges from time to time in the back end' at OSATs due to volume, though characterized as within normal execution issues
  • No explicit macro/yield/competition failures cited; management stated 'no fundamental issues' around supply chain or macro risks as of now

Q&A: Analyst Interest

  • CED demand drivers (XPU/inference vs optical/1.6T): Management attributed June-quarter CED strength to two intertwined factors—(1) inference infrastructure growth across XPUs/switches plus expanding units/timing content and (2) networking bandwidth expansion enabled by optics, especially 1.6 terabit optical modules growing faster than previously anticipated. They also emphasized other business segments remained strong.
  • Q2/Back-half gross margin puts and takes: Management said Q1 gross margin benefited from CED mix (higher gross margins) and lower consumer mix, plus product cost improvements and better manufacturing absorption. For Q2 and back half, they expected more normalized consumer mix, which could modulate gross margins, but still projected gross margin above 60% and near the higher end of the target range.
  • Supply chain/capacity and share gain during tight capacity: Management responded that capacity is 'very solid' with MEMS chips from Bosch and analog chips largely from TSMC in older geometries all in good shape. They noted occasional OSAT back-end volume challenges are typical and mitigable. They also linked recent automation and AI-enabled test/characterization to higher productivity with less CapEx, supporting share capture in an up-cycle.

Sentiment: POSITIVE

Note: This summary was synthesized by AI from the SITM Q1 2026 earnings transcript. Financial data is complex; please verify all metrics against official SEC filings before making investment decisions.

📋 Official Regulatory 10-K / 10-Q SEC Filings

Direct authenticated documentation links to audited SEC database reports for SITM.

SEC EDGAR Live Feed
No recent 10-K available.
No recent 10-Q available.
Loading financial data and tables...
📁

SEC Filings (SITM)

© 2026 Stock Market Info — SiTime Corporation (SITM) Financial Profile