The Beauty Health Company

The Beauty Health Company (SKIN) Market Cap

The Beauty Health Company has a market capitalization of $86.2M.

Price: $0.67

0.03 (5.00%)

Market Cap: 86.24M

NASDAQ · time unavailable

CEO: Pedro Malha

Sector: Consumer Defensive

Industry: Household & Personal Products

IPO Date: 2020-11-24

Website: https://www.beautyhealth.com

The Beauty Health Company (SKIN) - Company Information

Market Cap: 86.24M|Sector: Consumer Defensive

Company Profile

The Beauty Health Company designs, develops, manufactures, markets, and sells aesthetic technologies and products worldwide. The company's flagship product includes HydraFacial that enhance the skin to cleanse, peel, exfoliate, extract, infuse, and hydrate the skin with proprietary solutions and serums. Its products also comprise Syndeo, a HydraFacial Delivery System designed to elevate every part of the treatment and connects providers to the consumer's preferences to create a more personalized experience; HydraFacial Nation App, an app that allows consumers to learn about their skin health, discover treatment options, and track their treatments over time; and Keravive, a treatment for scalp health. The company was founded in 1997 and is headquartered in Long Beach, California.

Analyst Sentiment

62%
Buy

From 14 Active Polls

1Y Forecast: $1.53

▲ +129.9% Potential Upside

Consensus Target Metrics

Low Bound

$1

Median

$2

High Bound

$2

Average

$2

Price & Moving Averages

Loading chart...

🎯 Wall Street Analyst Intelligence Report

1-Year structural target targets, chart projections, and sentiment maps.

Average 1Y Target
$1.53
▲ +129.94% Upside
Low Target
$1.00
50% Risk
Median Target
$1.60
140% Mid
High Target
$2.00
201% Max
Consensus
Hold
4 / 14 Buys

Consensus Trend Projection

Trailing closures vs. 12-month metrics map.

Analyst Vote Distribution

Aggregate institutional coverage sentiment weights.

📊 Historical Valuation Multiples

Real-time Trailing Twelve Month (TTM) momentum side-by-side with discrete quarterly metrics.

Fiscal QuarterTTMQ1 2026Q4 2025Q3 2025Q2 2025Q1 2025Q4 2024Q3 2024Q2 2024
Period EndingTrailing 12MMar 31, 2026Dec 31, 2025Sep 30, 2025Jun 30, 2025Mar 31, 2025Dec 31, 2024Sep 30, 2024Jun 30, 2024
Market Cap ($M)86114177253241168198179228
Enterprise Value ($M)249277323412406362396388446
Price to Earnings Ratio (P/E)-14.12-4.31-5.46-5.723.05-4.15-4.79-2.44281.74
Price/Earnings-to-Growth Ratio (PEG)-0.330.25-0.8024.95
Price to Sales Ratio (P/S)0.291.752.153.573.082.412.372.272.51
Price to Book Ratio (P/B)1.542.062.903.853.253.643.822.993.29
Price to Free Cash Flow Ratio (P/FCF)3.03-19.6812.8226.2522.3190.5512.6721.7254.68
Enterprise Value to Sales (EV/Sales)4.263.925.835.195.214.744.924.92
Enterprise Value to EBITDA (EV/EBITDA)5.8278.2346.72100.5414.35-668.38-146.85-89.8539.73
Debt to Equity Ratio3.806.656.205.775.0912.3210.979.528.20
⚠️

Valuation Model Suspended

API Payload Error: Inverted or negative baseline Free Cash Flow margin detected (-19.4%).

Troubleshooting Notice: The upstream financial data supplier has uploaded corrupted or inverted baseline metrics for SKIN. The server sandbox cannot calculate an intrinsic value path from negative cash generation baselines.

📘 Full Research Report

ℹ️

AI-Generated Research: This report is for informational purposes only.

📘 BEAUTY HEALTH COMPANY CLASS A CLAS (SKIN) — Investment Overview

🧩 Business Model Overview

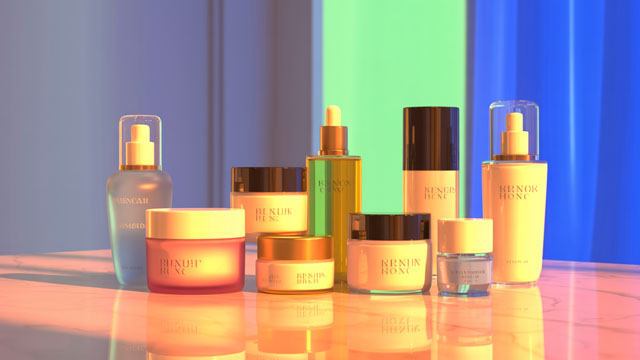
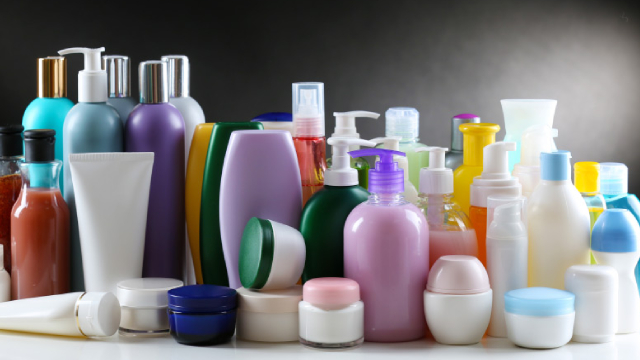
Beauty Health Company operates at the intersection of professional aesthetics and consumer skincare. The value chain centers on (1) proprietary or differentiated treatment modalities and branded skincare formulations, (2) distribution into professional channels (aesthetic practices and franchise-style networks for certain offerings), and (3) product monetization that converts treatment frequency into repeat purchases for devices and consumables. A key feature of the model is ecosystem build: professional adoption drives ongoing demand for consumables, while consumer skincare and at-home device categories extend usage beyond the clinic and reinforce routine-based purchasing behavior.

💰 Revenue Streams & Monetisation Model

Revenue monetization is typically a mix of:
  • Upfront device and treatment system sales (lower frequency, higher ticket): generates cash up front and establishes installed base.
  • Consumables and replenishment products (higher frequency, recurring-like): margins are often supported by formulation and brand pull-through, with repeat purchasing tied to treatment cycles.
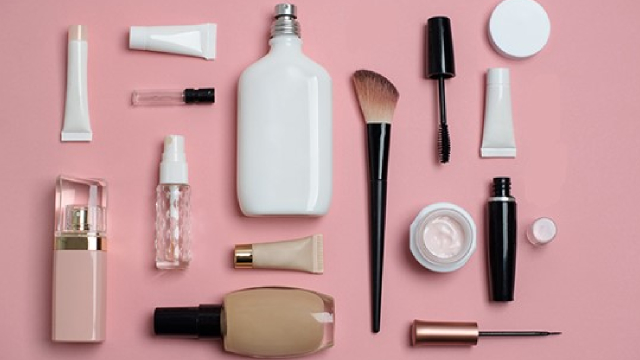
  • Skincare products sold through professional recommendations and retail/e-commerce: monetizes dermatology-influenced regimens and supports gross margin through premium positioning.
Margin drivers generally include gross margin on replenishment products, mix shift toward recurring-like categories, and operating leverage as brand and channel infrastructure scales.

🧠 Competitive Advantages & Market Positioning

The company’s competitive moat is best described as a combination of installed-base economics (switching friction) and intangible brand authority with professional validation.
  • Switching Costs / Installed-Base Stickiness: For aesthetics systems, clinics and service providers incur practical switching frictions—training, workflows, device purchasing, and established supplier relationships. This creates durability for consumables and ongoing replenishment.
  • Intangible Assets / Product-Formulation Expertise: Branded skincare systems associated with dermatology-led education and physician/community credibility create sustained demand and reduce direct substitutability.
  • Integrated Ecosystem: Coherence between professional modalities and consumer skincare routines supports cross-selling and helps stabilize demand through channel transitions (clinic-to-home).
Competitive benchmarking (industry focus vs. rivals):
  • Cynosure / Cutera / Lumenis (medical/aesthetic equipment focus): these competitors emphasize device hardware. Beauty Health competes more through branded experiences and treatment-to-consumable ecosystems, blending skincare formulation and modality adoption.
  • Symplified at-home and light-device brands (e.g., Omnilux, Foreo): these focus on consumer wellness aesthetics. Beauty Health differentiates by leaning on professional credibility and replenishment tied to an established service framework, rather than single-point consumer devices.
  • Dermatology-led premium skincare (e.g., L’Oréal’s SkinCeuticals / La Roche-Posay): these compete on product efficacy and retail distribution. Beauty Health’s advantage is the modality + regimen ecosystem, where the purchase journey is reinforced by repeatable treatment use rather than only product replacement cycles.

🚀 Multi-Year Growth Drivers

Over a 5–10 year horizon, growth is supported by structural demand for skin health and minimally invasive aesthetics, with several expansion vectors:
  • Ongoing shift toward non-surgical aesthetics: Consumer willingness to adopt regular, lower-downtime interventions supports installed-base consumables and repeat service demand.
  • From clinic to at-home: Patients and skincare consumers increasingly seek continuation products and device-based routines that extend outcomes between visits.
  • Premiumization in skincare regimens: Dermatology-influenced systems and targeted treatments support better willingness to pay versus mass commoditized skincare.
  • Geographic and channel expansion: Professional adoption frameworks and scalable distribution into new regions can expand the addressable base of customers and refill demand.

⚠ Risk Factors to Monitor

Key structural and operational risks include:
  • Regulatory and claims risk: Aesthetic and medical-device-adjacent products face scrutiny around safety, efficacy substantiation, and marketing claims.
  • Competitive intensity and technology substitution: New device modalities and alternative consumer skincare categories can dilute installed-base economics.
  • Concentration in distribution/professional partners: Channel mix shifts or partner inventory behavior can impact replenishment pacing and reported growth.
  • Product lifecycle and IP risk: Dependence on specific formulations, device components, or intellectual property can be affected by litigation, patent invalidation, or competitive design-around.
  • Supply chain and component costs: Consumables and device manufacturing can be sensitive to raw material availability and logistics disruptions.

📊 Valuation & Market View

Equity valuation for aesthetics and skincare businesses often blends growth-multiple thinking with durability-of-cash-flow assessment:
  • Revenue quality focus: Markets typically reward repeat-purchase dynamics in consumables and regimen-based skincare, which can justify higher valuation multiples than purely transactional CPG.
  • Operating leverage: Margins and operating expense discipline influence how much incremental revenue converts to earnings.
  • Installed-base economics: Investors typically track whether replenishment and service-associated demand sustain growth faster than hardware-only categories.
Sector valuation frequently references P/S for growth durability and EV/EBITDA-style frameworks when profitability becomes more established; the key valuation drivers remain mix, gross margin trajectory, and evidence of replenishment stickiness.

🔍 Investment Takeaway

Beauty Health Company’s long-term investment case is grounded in an ecosystem moat: professional adoption and installed-base dynamics support replenishment-like demand, while dermatology-led skincare and modality-to-routine integration reinforce customer stickiness. The primary question for multi-year compounding is whether the company can sustain consumables and regimen growth through competitive cycles while maintaining margin discipline and managing regulatory and channel execution risk.

⚠ AI-generated — informational only. Validate using filings before investing.

📰 Market News & Coverage

15 Stories Available

Real-time institutional reporting and market updates for SKIN.

globenewswire.com2026-06-02

Hydrafacial Introduces HydraScalp® with Keravive™ as Next Evolution in Scalp Health

An advanced, non-invasive scalp treatment with no downtime, featuring newly engineered tips and clinically proven to visibly improve scalp health and the appearance of fuller, thicker-looking hair An advanced, non-invasive scalp treatment with no downtime, featuring newly engineered tips and clinically proven to visibly improve scalp health and the appearance of fuller, thicker-looking hair

zacks.com2026-05-12

Why SkinHealth Systems Inc. (SKIN) International Revenue Trends Deserve Your Attention

Explore how SkinHealth Systems Inc.'s (SKIN) revenue from international markets is changing and the resulting impact on Wall Street's predictions and the stock's prospects.

marketbeat.com2026-05-08

Beauty Health Q1 Earnings Call Highlights

Beauty Health NASDAQ: SKIN, referred to by executives as SkinHealth Systems following a recent rebrand, reported first-quarter 2026 net sales of $64.9 million, down 6.7% from the prior year, as weaker device placements continued to weigh on growth. The company said adjusted EBITDA rose 17% year over year to $8.5 million, exceeding the high end of its guidance range.

seekingalpha.com2026-05-08

SkinHealth Systems Inc. (SKIN) Q1 2026 Earnings Call Transcript

SkinHealth Systems Inc. (SKIN) Q1 2026 Earnings Call Transcript

zacks.com2026-05-07

SkinHealth Systems Inc. (SKIN) Reports Q1 Loss, Lags Revenue Estimates

SkinHealth Systems Inc. (SKIN) came out with a quarterly loss of $0.05 per share versus the Zacks Consensus Estimate of a loss of $0.09. This compares to a loss of $0.08 per share a year ago.

zacks.com2026-05-07

Compared to Estimates, SkinHealth Systems Inc. (SKIN) Q1 Earnings: A Look at Key Metrics

The headline numbers for SkinHealth Systems Inc. (SKIN) give insight into how the company performed in the quarter ended March 2026, but it may be worthwhile to compare some of its key metrics to Wall Street estimates and the year-ago actuals.

globenewswire.com2026-05-07

SkinHealth Systems Reports First Quarter 2026 Financial Results

LONG BEACH, Calif., May 07, 2026 (GLOBE NEWSWIRE) -- SkinHealth Systems Inc. (NASDAQ: SKIN) (“SkinHealth Systems” or the "Company"), home to flagship brand Hydrafacial, today announced financial results for the first quarter ended March 31, 2026 (“Q1 2026”).

zacks.com2026-04-30

SkinHealth Systems Inc. (SKIN) Expected to Beat Earnings Estimates: Can the Stock Move Higher?

SkinHealth Systems Inc. (SKIN) possesses the right combination of the two key ingredients for a likely earnings beat in its upcoming report. Get prepared with the key expectations.

businesswire.com2026-04-29

The Estée Lauder Companies Announces Minority Investment in Luxury Clinical Skin Care Brand 111SKIN

NEW YORK--(BUSINESS WIRE)--The Estée Lauder Companies Inc. (NYSE:EL) today announced a minority investment in 111SKIN, a luxury clinical skin care brand founded by renowned plastic and reconstructive surgeon Dr. Yannis Alexandrides. Terms of the investment were not disclosed. Founded in 2012, 111SKIN was originally developed by Dr. Alexandrides to accelerate his patients' healing time following procedures. At the heart of the brand is its innovative NAC Y2™, a pioneering complex designed to sup.

globenewswire.com2026-04-29

SkinHealth Systems to Report First Quarter 2026 Financial Results on May 7, 2026

LONG BEACH, Calif., April 29, 2026 (GLOBE NEWSWIRE) -- SkinHealth Systems Inc. (formerly The Beauty Health Company; Nasdaq: SKIN), a global medical aesthetics company, today announced it will report first quarter 2026 financial results after market close on Thursday, May 7, 2026.

globenewswire.com2026-04-22

SkinHealth Systems Inc. Appoints Three New Independent Directors to Board

LONG BEACH, Calif., April 22, 2026 (GLOBE NEWSWIRE) -- SkinHealth Systems Inc. (formerly The Beauty Health Company; Nasdaq: SKIN), a global medical aesthetics company, today announced the appointment of three new independent directors to its Board of Directors (the “Board”): Mr.

globenewswire.com2026-04-22

The Beauty Health Company Announces Corporate Rebrand to SkinHealth Systems, Reflecting Evolution into a Clinically Driven, Science-Backed Medical Aesthetics Platform

LONG BEACH, Calif., April 22, 2026 (GLOBE NEWSWIRE) -- The Beauty Health Company (NASDAQ: SKIN) today announced a corporate rebrand to SkinHealth Systems Inc., marking its evolution into a clinically driven, science-backed medical aesthetics company.

zacks.com2026-03-17

Don't Overlook Beauty Health (SKIN) International Revenue Trends While Assessing the Stock

Evaluate Beauty Health's (SKIN) reliance on international revenue to better understand the company's financial stability, growth prospects and potential stock price performance.

defenseworld.net2026-03-17

The Beauty Health Company (NASDAQ:SKIN) Receives Consensus Rating of “Reduce” from Brokerages

Shares of The Beauty Health Company (NASDAQ: SKIN - Get Free Report) have been given an average recommendation of "Reduce" by the eight analysts that are covering the stock, MarketBeat reports. Two investment analysts have rated the stock with a sell recommendation, five have assigned a hold recommendation and one has issued a buy recommendation on

seekingalpha.com2026-03-13

The Beauty Health Company (SKIN) Q4 2025 Earnings Call Transcript

The Beauty Health Company (SKIN) Q4 2025 Earnings Call Transcript

📊 AI Financial Analysis

Powered by StockMarketInfo
Earnings Data: Q Ending 2026-03-31

"For SKIN’s 2026-03-31 (Q1) results, Revenue was $64.9M and Net Income was -$6.6M (EPS: -$0.05). YoY Revenue fell -6.7% (from $69.6M in Q1’25), while Net Income improved from -$10.1M to -$6.6M (+34.7% year-over-year, i.e., less loss). QoQ, Revenue declined -21.3% (from $82.4M in Q4’25) and Net Income slightly worsened from -$8.1M to -$6.6M (loss improved, but remains negative). Profitability remains weak: gross margin expanded to 68.4% (from 64.3% in Q4’25; and 69.8% in Q1’25), but operating income and net margin are still negative (operating margin -2.8%; net margin -10.2%). Operating cash flow was -$5.6M, and free cash flow was -$5.6M, reflecting continued cash burn. Balance sheet resilience is mixed: cash is still sizable at $204.4M, but total equity is only $55.2M against $418.0M liabilities and $367.2M total debt, leaving high leverage. Total shareholder returns are positive on the 1-year view in provided data (+6.14%), but there is no dividend and no buyback activity in the quarter. Overall, sentiment appears challenged given persistent losses despite gross margin support."

Revenue Growth

Caution

Q1’26 revenue was $64.9M: -6.7% YoY (vs. $69.6M in Q1’25) and -21.3% QoQ (vs. $82.4M in Q4’25), indicating a weakening demand trajectory.

Profitability

Neutral

Gross margin improved QoQ (68.4% vs. 64.3%) but operating margin remained negative (-2.8%) and net margin stayed deeply negative (-10.2%). Net loss narrowed YoY (-$10.1M to -$6.6M), but EPS remains -$0.05.

Cash Flow Quality

Neutral

Operating cash flow was -$5.6M and free cash flow was -$5.6M in Q1’26, consistent with ongoing cash burn. No dividends paid; buybacks not evident in the quarter.

Leverage & Balance Sheet

Caution

Cash remains meaningful ($204.4M), but leverage is high: total debt $367.2M and total equity only $55.2M. Liquidity ratios are adequate (current ratio 1.79), yet retained earnings are heavily negative.

Shareholder Returns

Fair

Provided market performance shows +6.14% over 1 year, with no dividend yield. Total return support is moderate, but not strong momentum.

Analyst Sentiment & Valuation

Neutral

Price targets appear below current price context (consensus target ~$1.3 vs. market price $0.9127, implying limited upside per provided targets). Losses drive weak earnings multiples (negative P/E).

Disclaimer:This analysis is AI-generated for informational purposes only. Accuracy is not guaranteed and this does not constitute financial advice.

Fundamentals Overview

Loading fundamentals overview...

Q1 2026 showed a resilient margin and cash-generation profile despite weak top-line device momentum. Net sales were $64.9M (within guidance) but down 6.7% YoY, driven by delivery systems down 8.3% with device placements of 746 vs 862. The company cited structural macro headwinds—tighter credit, longer purchase cycles, and intensified competition/secondary market options—along with slower commercial conversion improvements that require time. Against this backdrop, adjusted EBITDA was $8.5M (+17% YoY), well above the high end of guidance, with gross margin strength (72.2% adjusted gross margin) and lower-than-forecast scrap/write-offs plus Americas device ASP support. Management revised full-year revenue to $280M–$295M (~$7.5M midpoint reduction) while holding adjusted EBITDA at $35M–$45M. Key execution catalysts center on booster portfolio overhaul, Keravive relaunch integration, a new Q4 clinically backed booster, and next-gen Hydrafacial (2028). Risks remain device conversion and China distributor comp pressure into 1H 2026, but churn fell 40% YoY, and cash ($204.4M) plus flat working capital guidance support the October 2026 ~$103M maturity plan.

AI IconGrowth Catalysts

  • Booster portfolio restructuring around clearly defined clinical use cases with differentiated outcomes and tier pricing
  • Relauch of Keravive (scalp health treatment) later in Q2 with updated marketing, enhanced protocols, and deeper integration into Hydrafacial platform
  • New clinically backed booster launch expected in Q4 2026 backed by strong clinical data
  • Next-generation Hydrafacial device development targeting 2028 launch with an identified upgrade opportunity for 36,000+ installed base

Business Development

  • Late-stage diligence exploring strategic partnerships to add complementary technologies into the Hydrafacial/ SkinHealth ecosystem (both device and consumable side)
  • Distributor partner in APAC driving increased device orders year-over-year (noted as a different dynamic than China consumables transition)

AI IconFinancial Highlights

  • Reported Q1 net sales of $64.9M (down 6.7% YoY), within guidance range of $63M–$68M
  • Adjusted EBITDA $8.5M (up 17% YoY), achieved well above the high end of guidance range ($3.5M–$5.5M stated in transcript)
  • Adjusted gross margin expanded to 72.2% vs 71.9% prior year (+30 bps approx implied), while GAAP gross margin declined to 68.5% vs 69.8% (-130 bps approx) due to higher amortization expense
  • Device placements missed expectations; systems revenue $18.5M down 8.3% YoY with 746 systems placed vs 862 in Q1 2025
  • Full-year revenue outlook revised to $280M–$295M from $285M–$305M (midpoint reduction ~2.5% or ~$7.5M)
  • Despite revenue reset, adjusted EBITDA guidance maintained at $35M–$45M
  • Q2 guidance: revenue $72M–$77M; adjusted EBITDA $11M–$13M
  • Cash: ended Q1 with $204.4M cash/cash equivalents/restricted cash; October 2026 debt maturity ~$103M; management expects modest free cash flow in last 3 quarters to service debt
  • Q1 churn improved: device churn down 40% YoY; active installed base grew to 36,400 devices (+4% YoY)
  • Consumables: $46.4M revenue down 6.1% YoY; ~2/3 of drop attributed to China transition to distributor model; Americas and EMEA timing variability expected to normalize
  • EBITDA beat attribution: gross margin outperformance (higher device ASP in Americas) and materially lower than forecast scrap/write-offs; OpEx in March below forecast

AI IconCapital Funding

  • Ended quarter with $204.4M cash, cash equivalents, and restricted cash
  • October 2026 debt maturity totals approximately $103M; management confidence to address maturity using cash generation through Q2 and second half
  • CapEx expectations: $8M–$10M for FY; spent $1.6M–$1.7M in Q1
  • Working capital expected relatively flat YoY; described as a cash use in Q1 due to payables timing that should normalize by maturity

AI IconStrategy & Ops

  • Rebranding from SkinHealth to Skin Health Systems; operational shift toward medical-device style rigor and commercial discipline
  • CEO assumed more direct role in global sales organization, specifically US and international, to manage closer to regional sales metrics and improve conversion
  • Sales discipline changes: tighter pipeline management, better account prioritization, improved commercial leadership (implementation taking time to reflect in placements)
  • Booster strategy overhaul: reduce SKU complexity (from many boosters to fewer, clinically outcome-focused use-case boosters)
  • Provider retention initiatives reflected in materially lower churn (down 40% YoY) and installed base growth (+4% YoY)

AI IconMarket Outlook

  • Full-year revenue guidance revised to $280M–$295M (midpoint ~$287.5M) from prior $285M–$305M
  • Full-year adjusted EBITDA maintained at $35M–$45M
  • Q2 expectations: revenue $72M–$77M; adjusted EBITDA $11M–$13M
  • Q2 device softness expected to persist; commercial fixes expected to take time to translate into placements/utilization improvements
  • Second-half cadence: sequential improvement expected as conversion/utilization/booster attachment traction builds; growth stabilization positioned for 2027 and beyond

AI IconRisks & Headwinds

  • Device placements softness persists due to macro tightening: constrained capital equipment demand from tighter credit conditions and longer purchasing cycles
  • Competition intensified, including lower-cost alternatives; secondary market devices and broader aesthetic treatment options competing for treatment-room time
  • Commercial execution takes time to impact device placements: revised outlook assumes continued pressure in device conversions/utilization until initiatives take effect
  • China consumables transition to distributor model continues to pressure YoY comparisons into 2026 first half (comps expected to subside as year progresses)
  • Inflation inputs (plastics resins, freight) not expected to materially affect adjusted EBITDA guide per management commentary
  • Middle East conflict and energy costs: management stated no material impact expected and actively monitoring

Q&A: Analyst Interest

  • Q4: Booster portfolio and commercialization plan: Management explained prior booster strategy lacked clear articulation of efficacy/attended use. They are now selecting fewer boosters aligned to specific clinical outcomes and consumer needs, with launches planned for HydraScalp next quarter (reactivating Keravive) and a clinically backed booster in Q4 supported by real data.
  • Q2/FCF and debt maturity confidence: Management detailed that the FY midpoint assumes modest free cash flow generation in the last three quarters to service the October maturity. CapEx is guided at $8M–$10M for the year (Q1 ~$1.6M–$1.7M). Working capital should be relatively flat; Q1 cash use was payables timing.
  • Guide cadence vs growth in back half: Management clarified the revised revenue range to $280M–$295M and emphasized device sales trends remain the key driver of continued year-over-year decline in Q2 (midpoint $74.5M, -4.7% YoY). They expect sequential improvement in the second half if device conversion, installed-base utilization, and booster attachment improve.

Sentiment: MIXED

Note: This summary was synthesized by AI from the SKIN Q1 2026 earnings transcript. Financial data is complex; please verify all metrics against official SEC filings before making investment decisions.

📋 Official Regulatory 10-K / 10-Q SEC Filings

Direct authenticated documentation links to audited SEC database reports for SKIN.

SEC EDGAR Live Feed
Loading financial data and tables...
📁

SEC Filings (SKIN)

© 2026 Stock Market Info — The Beauty Health Company (SKIN) Financial Profile