NuScale Power Corporation

NuScale Power Corporation (SMR) Market Cap

NuScale Power Corporation has a market capitalization of $2.51B.

Price: $8.43

β–Ό -0.17 (-1.98%)

Market Cap: 2.51B

NYSE Β· time unavailable

CEO: John Lawrence Hopkins

Sector: Utilities

Industry: Renewable Utilities

IPO Date: 2022-03-01

Website: https://www.nuscalepower.com

NuScale Power Corporation (SMR) - Company Information

Market Cap: 2.51B|Sector: Utilities

Company Profile

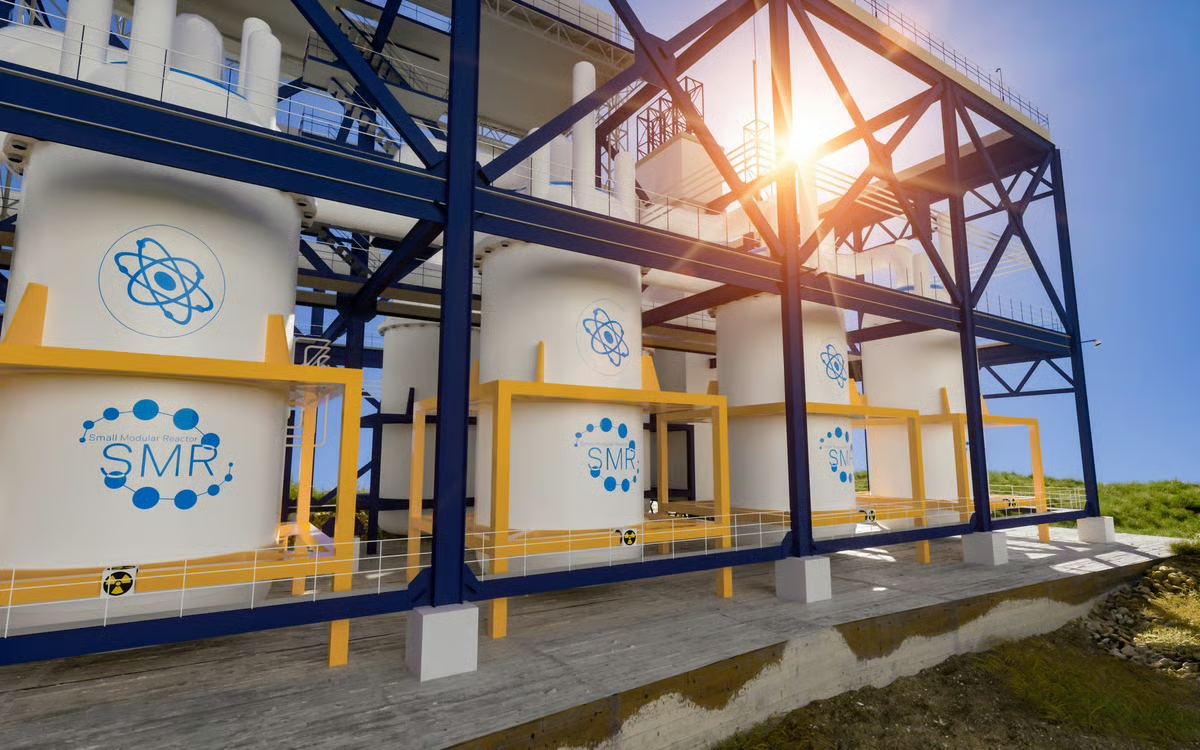
NuScale Power Corporation specializes in the development and sale of modular light water reactor nuclear power facilities. These innovative plants are designed to provide energy for a wide array of applications, including the generation of electricity, district heating systems, water desalination, hydrogen production, and various industrial heat processes. Key products in their portfolio include the NuScale Power Module, an individual water reactor unit capable of producing 77 megawatts of electricity (MWe). They also offer the VOYGR-12 power plant, which delivers a substantial 924 MWe, along with four-module VOYGR-4 and six-module VOYGR-6 configurations. Beyond these standard offerings, NuScale provides other adaptable configurations tailored to meet specific customer demands. Established in 2007, the company maintains its headquarters in Portland, Oregon, and operates as a subsidiary of Fluor Enterprises, Inc.

Analyst Sentiment

67%
Buy

From 18 Active Polls

1Y Forecast: $13.67

β–² +62.2% Potential Upside

Consensus Target Metrics

Low Bound

$9

Median

$12

High Bound

$20

Average

$14

Price & Moving Averages

Loading chart...

🎯 Wall Street Analyst Intelligence Report

1-Year structural target targets, chart projections, and sentiment maps.

Average 1Y Target
$13.67
β–² +62.16% Upside
Low Target
$9.00
7% Risk
Median Target
$12.00
42% Mid
High Target
$20.00
137% Max
Consensus
Buy
8 / 16 Buys

Consensus Trend Projection

Trailing closures vs. 12-month metrics map.

Analyst Vote Distribution

Aggregate institutional coverage sentiment weights.

πŸ“Š Historical Valuation Multiples

Real-time Trailing Twelve Month (TTM) momentum side-by-side with discrete quarterly metrics.

Fiscal QuarterTTMQ1 2026Q4 2025Q3 2025Q2 2025Q1 2025Q4 2024Q3 2024Q2 2024
Period EndingTrailing 12MMar 31, 2026Dec 31, 2025Sep 30, 2025Jun 30, 2025Mar 31, 2025Dec 31, 2024Sep 30, 2024Jun 30, 2024
Market Cap ($M)2,514β€”β€”β€”β€”β€”β€”β€”β€”
Enterprise Value ($M)5,257β€”β€”β€”β€”β€”β€”β€”β€”
Price to Earnings Ratio (P/E)-3.50-10.04-22.14-4.86-76.08-32.18-5.82-16.08-8.81
Price/Earnings-to-Growth Ratio (PEG)β€”β€”β€”β€”β€”β€”β€”β€”β€”
Price to Sales Ratio (P/S)299.813141.331283.23645.07655.33135.2148.852320.831012.23
Price to Book Ratio (P/B)1.181.521.986.427.622.572.706.897.18
Price to Free Cash Flow Ratio (P/FCF)-7.43β€”β€”β€”β€”β€”β€”β€”β€”
Enterprise Value to Sales (EV/Sales)β€”β€”β€”β€”β€”β€”β€”β€”β€”
Enterprise Value to EBITDA (EV/EBITDA)-7.74β€”β€”β€”β€”β€”β€”β€”β€”
Debt to Equity Ratio0.50β€”β€”β€”β€”β€”β€”β€”β€”

πŸ“˜ Full Research Report

ℹ️

AI-Generated Research: This report is for informational purposes only.

πŸ“˜ NUSCALE POWER CORP CLASS A (SMR) β€” Investment Overview

🧩 Business Model Overview

NuScale Power develops small modular reactor (SMR) technology designed to be built in repeatable units for grid and power customers. The value chain starts with engineering design and regulatory licensing, followed by project development and integration support. Revenue can arise from (1) engineering, procurement, and construction (EPC)-linked scope and development activities, (2) design and licensing-related economics, (3) fuel cycle and operations participation through customer projects/partnership structures, and (4) long-term service and operation support tied to deployed plants.

Customer β€œstickiness” is driven by the nuclear build process: once a utility commits to a particular reactor design, the investment in site work, permitting strategy, procurement planning, operator qualification, and project financing structure creates friction to change designs late in development. This produces de facto switching costs for utilities and public-sector counterparties that must maintain regulatory continuity and bankable construction pathways.

πŸ’° Revenue Streams & Monetisation Model

NuScale’s monetisation model is typically structured around development-to-deployment milestones, with the end-state dependent on commercial plant orders and the pace of construction. Key revenue components include:

  • Development and engineering fees: upfront project work and customer-facing engineering deliverables tied to project progression.
  • Licensing/design-related economics: design authority and licensing support economics that strengthen with deployment and repeatability.
  • Project-linked participation: economics embedded in customer projects and partnership structures, potentially including long-duration service arrangements as plants move toward operations.
  • Long-term operations exposure (when applicable): recurring value potential through operations, maintenance, and services tied to installed reactor fleets.

Margin drivers are largely execution- and scale-based. As projects progress from concept and licensing toward fabrication and deployment, gross margins tend to become more sensitive to (1) standardization/replication (lower engineering intensity), (2) supply chain contracting discipline, and (3) construction risk management that preserves the economics of fixed-scope or bankable agreements.

🧠 Competitive Advantages & Market Positioning

NuScale competes in a crowded SMR landscape where the primary gating factors are licensing credibility, cost competitiveness versus conventional nuclear, and the ability to deliver first projects without major redesign or cost blowouts. The moat is best characterized as a combination of Regulatory/technical credibility and project execution learning, which together increase the probability of β€œrepeatable” deployment.

Moat thesis (why competitors face friction):

  • Regulatory pathway and design assurance: SMR economics depend on achieving and maintaining a bankable licensing position. A validated design reduces uncertainty for utilities and financiers.
  • Repeatability and integration know-how: As a design is implemented across multiple sites, engineering and supply chain coordination can become more efficient, lowering per-plant unit cost trajectories.
  • Utility commitment friction (implicit switching costs): Permitting strategy, site-specific qualification, operator training approaches, and financing structures are difficult to rework if a customer changes reactor vendor late.

Competitive benchmarking (primary peers):

  • GE Hitachi (BWR-based SMR efforts): competes on light-water SMR development and existing industrial scale in nuclear-adjacent manufacturing and services.
  • Holtec International (SMR-160 class): emphasizes modularity and a pathway leveraging established vendor capabilities across nuclear components and systems integration.
  • Rolls-Royce (advanced reactor programs including SMR initiatives): competes by leveraging defense/industrial engineering experience and pursuing distinct licensing and deployment frameworks.

Positioning contrast: NuScale’s industry focus centers on a specific SMR design architecture and licensing-driven commercialisation approach, while many rivals leverage different reactor concepts and may emphasize varying degrees of manufacturing scale, industrial partnerships, and deployment models. Across all competitors, the shared objective is to convert licensing progress and early project execution into credible, repeatable unit economics that utilities can finance.

πŸš€ Multi-Year Growth Drivers

The long-run opportunity for SMRs rests on structural drivers that extend beyond any single project:

  • Energy system reliability and firm power demand: Growing electricity demand and the need for dispatchable generation support nuclear as a baseload option with low operational emissions.
  • Permitting and modular construction advantages (when bankable): Modular approaches can shorten certain project timelines versus large bespoke units, improving financing attractiveness in constrained regions.
  • Geographic and grid modernization needs: Utilities in regions with limited new large-unit build capacity may prefer smaller, phased builds tied to grid planning.
  • Industrial heat and off-grid applications (select jurisdictions): SMRs can expand the addressable market into industrial power/heat use cases, subject to regulatory and offtake structures.
  • Supply chain maturation: As orders accumulate, procurement leverage and standard fabrication processes can improve unit costs, expanding the feasible TAM where nuclear competes on delivered energy.

Over a 5–10 year horizon, the key TAM expansion mechanism is not only demand for firm low-carbon power, but the conversion of SMR projects from β€œtechnology pilots” into financed, repeatable commercial fleets with credible cost-of-electricity comparisons.

⚠ Risk Factors to Monitor

  • Capital intensity and financing risk: Nuclear projects require substantial capital; deployment economics depend on access to project finance, favorable offtake structures, and cost predictability.
  • Licensing, regulatory, and permitting uncertainty: SMR projects can face delays or scope changes tied to regulatory review, site licensing conditions, and inspection standards.
  • Construction and execution risk: Supply chain availability, fabrication quality, schedule discipline, and contractor performance can materially affect total project cost and timelines.
  • Technology performance and operating track record: Reactor reliability, safety case execution, and operational readiness influence the credibility of long-term service economics.
  • Competitive technology and vendor dynamics: Rival SMR designs and deployment approaches can compete for early β€œfirst-of-a-kind” deployments, shaping industry learning curves and customer preference.
  • Policy and regulatory framework: Changes in nuclear policy, emissions rules, carbon pricing assumptions, and government support can shift project viability across regions.

πŸ“Š Valuation & Market View

The market typically values SMR developers on a risk-adjusted pathway to deployable projects rather than on steady-state earnings. Common frameworks include:

  • EV/Sales or EV/Revenue for development-stage companies: reflecting progress on contracts, milestones, and expected future project participation.
  • Option value / probability-weighted milestones: investors often embed scenarios for licensing success, order conversions, construction starts, and execution outcomes.
  • Sector comparables on qualitative catalysts: perceived unit-cost trajectory, credibility of first deployments, and the bankability of offtake/financing structures.

Key valuation drivers for NuScale-like profiles include the durability of customer commitments, progression of licensing/permits into bankable project stages, evidence of cost discipline, and the ability to scale manufacturing and project execution without major design rework.

πŸ” Investment Takeaway

NuScale is best understood as an SMR technology developer where the central investment question is whether regulatory credibility and execution discipline translate into repeatable, financeable deployments that justify long-duration economic participation. The primary β€œmoat” is not brand or network effects, but regulatory/technical defensibility and the emergent switching friction created when utilities and counterparties commit to a specific reactor design through permitting, procurement planning, and financing structures. Upside depends on scaling first projects into a credible fleet; downside risk centers on capital intensity, licensing/permitting timelines, and construction execution that determines unit economics and bankability.


⚠ AI-generated β€” informational only. Validate using filings before investing.

πŸ“° Market News & Coverage

15 Stories Available

Real-time institutional reporting and market updates for SMR.

fool.comβ€’2026-08-01

Is TerraPower the Next Oklo? Inside Bill Gates' Nuclear Bet.

TerraPower isn't publicly traded, but Oklo and NuScale offer investors a way to bet on the same trend. AI's huge electricity demand is turning advanced nuclear technology into one of the market's long-term growth stories.

fool.comβ€’2026-07-31

This Historic 6-Gigawatt SMR Program Could Be a Game Changer for NuScale Stock

Last September, TVA and ENTRA1 announced a non-binding agreement to develop a 6 gigawatt (GW) power plant using NuScale's small modular reactors (SMRs). The agreement could lead to NuScale selling its SMR technology for the first time, but the non-binding nature leaves room for uncertainty.

fool.comβ€’2026-07-31

Prediction: Buying NuScale Right Now Could Make You Richer by 2036

Patient NuScale shareholders could be richly rewarded as it moves SMR technology toward deployment.

fool.comβ€’2026-07-31

Oklo vs. NuScale vs. Bloom Energy: Which AI-Power Stock Is the Better Buy Now?

Bloom Energy just reported a record Q2 2026, as demand for its on-site power generation products continues to grow. Oklo and NuScale Power are developing nuclear reactor technology that could also help address the growing power needs from data centers.

fool.comβ€’2026-07-30

Oklo vs. NuScale: Which One Actually Has Paying Customers Lined Up?

There's a reason the hype around these two nuclear technology stocks is fading.

fool.comβ€’2026-07-30

Why NuScale Power Stock Is Soaring Today

NuScale Power stock plunged more than 11% from last Friday's close through yesterday. A data center development in Kentucky has grabbed NuScale Power investors' attention.

fool.comβ€’2026-07-30

2 Power Stocks Riding the AI Electricity Boom. Which Is Best for Your Portfolio?

Nuclear power stocks are set to benefit from rising electricity demand.

fool.comβ€’2026-07-28

3 Nuclear Stocks to Watch as AI Strains the Electric Grid

AI's power crisis could create an enormous nuclear opportunity, but technology alone will not decide the winners. Discover which business models may have the clearest path forward.

fool.comβ€’2026-07-27

Bold Prediction: NuScale Power Is About to Break Out

NuScale has faced numerous setbacks, but a power purchase agreement by the end of the year could be an important catalyst for the future.

fool.comβ€’2026-07-26

Prediction: Buying NuScale Power Today Could Set You Up for Life

The recent slide in NuScale Power stock could be setting it up for a big, long-term gain. The company has two projects underway, but neither will likely materialize within the next five years.

fool.comβ€’2026-07-25

NuScale Power Is Down 38% This Year: Here's What the Next 5 Years Could Look Like

NuScale Power's stock has been on a volatility roller coaster. It has a nuclear reactor design approved, but it will be years before one is built.

fool.comβ€’2026-07-25

Nuclear Energy Is Winning Repeated Government Backing and Investors Should Take Notice

In May 2025, Donald Trump signed an executive order to speed up the development of nuclear power in the United States. The goal is to increase U.S. nuclear capacity from 100 gigawatts to 400 gigawatts by 2050.

fool.comβ€’2026-07-25

I'm Calling It: NuScale Power Stock Will Double as This Catalyst Hits

NuScale Power's market cap is now below $4 billion. Later this year, a major growth catalyst could buoy shares.

247wallst.comβ€’2026-07-24

3 Reasons the ULTY ETF’s Enormous Yield Costs Way More Than You Think

ULTY prints weekly checks with a yield that looks almost too good to be true, and that instinct deserves a much closer look at exactly what is funding those payouts.

zacks.comβ€’2026-07-24

Can NuScale Turn Its Regulatory Lead Into Commercial Success?

SMR's regulatory lead and $1 billion liquidity set the stage, but contracts, financing and dilution will decide its commercial success.

πŸ“Š AI Financial Analysis

Powered by StockMarketInfo
Earnings Data: Q Ending 2026-03-31

"SMR reported Q1’26 (ended 2026-03-31) Revenue of $0, with Net Income of -$44.0M (EPS -$0.14). Compared with Q4’25, Net Income loss improved from -$50.8M to -$44.0M (QoQ, about +13% less negative), but the company remains loss-making throughout the period. Revenue and profitability trends are volatile across the last four quarters (including quarters with reported revenues). Over the trailing pattern, Revenue was materially lower in Q1’26 than in Q1’25 (Q1’25 revenue $13.4M vs. Q1’26 reported revenue $0), and margins remain negative given ongoing operating losses (operating loss -$57.5M in Q1’26). Operating expenses remain elevated, implying cash burn is driven more by sustaining costs than by gross-margin performance. Cash flow quality is weak: operating cash flow was -$314.7M in Q1’26, and net investing/other investing cash flow was also heavily negative (-$218.4M), with no reported financing buybacks or dividends. The balance sheet is cash-rich, however, with cash & short-term investments of ~$890.1M and no debt, supporting runway despite persistent losses. Total shareholder return appears negative: price is $12.65 and 1-year price change is -12.76% with no dividend indicated; buybacks are also not shown. Analyst valuation context: consensus target ~$18.17 vs. $12.65 current suggests upside, but fundamentals remain early-stage/high-burn."

Revenue Growth

Neutral

Q1’26 revenue reported as $0 vs. $13.4M in Q1’25 (YoY: -100%). QoQ vs. Q4’25 revenue $1.8M (QoQ: -100%). The trajectory is deteriorating and reported revenue is inconsistent across recent quarters.

Profitability

Neutral

Net income improved QoQ from -$50.8M (2025-12-31) to -$44.0M (2026-03-31) (~+13% improvement in loss). YoY remains loss-making (Q1’25 net income -$14.0M vs. Q1’26 -$44.0M; YoY loss widened ~-214%). Margins are negative and not meaningfully stabilizing.

Cash Flow Quality

Neutral

Operating cash flow was -$314.7M in Q1’26, indicating high cash burn. No dividends were paid and no buybacks are shown, so shareholder returns depend on stock price rather than cash distribution. Free cash flow is also negative (-$314.7M).

Leverage & Balance Sheet

Fair

Balance sheet resilience is comparatively strong for a loss-maker: no debt and net debt is negative (net cash) at about -$341.1M. Cash & short-term investments are ~$890.1M, which can support runway despite negative earnings.

Shareholder Returns

Neutral

Shareholder return is weak from price momentum: current price $12.65, 1Y change -12.76% (no >20% positive momentum). Dividend yield shown as 0% and no buybacks indicated in cash flow, so total return is likely dominated by negative price performance.

Analyst Sentiment & Valuation

Caution

Consensus target of ~$18.17 vs. $12.65 current implies potential upside (~44%). However, with persistent operating losses and heavy cash burn, valuation support may be fragile.

Disclaimer:This analysis is AI-generated for informational purposes only. Accuracy is not guaranteed and this does not constitute financial advice.

Fundamentals Overview

Loading fundamentals overview...

NuScale’s Q1 2026 call is heavily execution-focused, with the commercial narrative anchored on regulatory de-risking (NRC standard design approvals for both 50 MW and 77 MW under Part 52), LEU fuel availability, and behind-the-meter siting enabled by a reduced EPZ. Financially, the quarter shows low revenue ($0.6M) largely due to timing effects versus Q1 2025 RoPower licensing and late-2025 completion of Fluor feed Phase 2 services. Liquidity improved to >$1.2B by early May, supported by $37.9M gross proceeds from an ATM sale and removal of an equity overhang as Fluor sold remaining shares. In Q&A, analysts pressed on what actually delays additional contracts and how financing impacts milestone exposure. Management repeatedly pointed to slow but active commercialization and stated project financing derisks pathways (though PMA payments remain separate from partner funding). The near-term outlook hinges on TVA PPA progress later in 2026 and RoPower pre-EPC developments into/through 2027.

AI IconGrowth Catalysts

  • Continued advancement of ENTRA1 + TVA discussions toward a definitive TVA power purchase agreement (up to 6 GW), positioned as the largest U.S. nuclear deployment program
  • Progress on RoPower Doicesti, Romania: Romanian government investment decision approval (February 2026), enabling financing for feasibility studies, site-specific design and pre-construction work
  • Supply chain readiness improvements: annual NuScale supplier working group (37 partners) aligning 2026 demand signals and near-term deployment milestones
  • Risk reduction via NRC Standard Design Approval already obtained for 50 MW and 77 MW modules under 10 CFR Part 52

Business Development

  • ENTRA1 as TVA commercialization partner (discussions advancing toward a definitive PPA; ENTRA1 also referenced as named developer in the U.S.-Japan framework agreement context)
  • TVA (interconnection/large-scale program partner; emphasis on TVA’s pro-nuclear stance via interim CEO Mike Skaggs)
  • RoPower (Doicesti, Romania) and Nuclearelectrica (shareholder vote advanced project; DOE/FI/partners referenced in ongoing weekly status meetings)
  • Framatome (fuel supplier; multiple global supply sites including Richland, Washington; Lingen Germany; facility in France referenced)
  • Doosan Enerbility (manufacturing partner; key NuScale Power Module components described as actively in production)

AI IconFinancial Highlights

  • Revenue $0.6 million for 3 months ended March 31, 2026 vs $13.4 million prior year; decline attributed to absence of RoPower technology licensing revenue recognized in Q1 2025 and completion of Fluor feed Phase 2 engineering services in late 2025
  • Liquidity $1.0 billion at March 31, 2026; increased to over $1.2 billion by early May 2026
  • No EPS guidance or bps margin changes provided in the transcript segment

AI IconCapital Funding

  • ATM activity: sold 3.2 million NuScale Class A shares in Q1 2026, generating $37.9 million gross proceeds
  • Share overhang reduced: Fluor completed sale of remaining NuScale shares (timeline: 'just a few weeks ago'), with noted 4.3x return on initial $570 million investment
  • Liquidity runway: ~$1.0 billion at quarter-end, >$1.2 billion by early May 2026

AI IconStrategy & Ops

  • Supplier readiness framework with recurring cross-functional supplier reviews; deliberate multisourcing to reduce single-source dependency
  • NuScale supplier working group summit in Houston (37 key suppliers) and additional supplier excitement noted (summit attendance described as 120–130 people representing >half of supplier base)
  • Operations center opening: Houston Energy Corridor (City Center) opened April 29, positioned to shorten decision cycles and deepen customer relationships
  • Regulatory operations model: dry cooling reduces water consumption by >90% vs wet cooling towers; EPZ constrained to plant boundary enabling behind-the-meter siting

AI IconMarket Outlook

  • TVA: management stated hope/strong possibility PPA could be finalized later in 2026 (analyst asked if finalized this year; CFO: 'hopeful ... at some point later this year')
  • RoPower: next phase expected to last ~15 months if pre-EPC financing secured (as stated in prepared remarks); participation described as contingent on Fluor pre-EPC discussions still ongoing

AI IconRisks & Headwinds

  • Timeline risk: complex and slow commercialization process; management described being 'close to closure' but acknowledged it is 'complicated [and] slow'
  • Funding/financing dependency: project financing derisks NuScale pathway, but timing hinges on partner and external capital availability (ENTRA1/sovereign/private institutions for TVA; pre-EPC status for RoPower with Fluor)
  • Regulatory pathway evolution risk: Part 53 is new and relies on probabilistic analysis; management must secure credit transfer from Part 52 workstreams while maintaining required safety rigor
  • Fuel strategy dependence on long-term availability: management emphasized LEU not expected to be a bottleneck, contrasting with HALEU uncertainties cited by others

Q&A: Analyst Interest

  • Part 52 vs Part 53 regulatory acceleration: Management explained Part 53 was not available during their original licensing strategy, is new, and uses probabilistic analysis. They described ongoing NRC dialogue to seek streamlining benefits that could shorten COLA timelines without reducing safety rigor.
  • TVA commercialization gating factors and financing: Analysts asked whether ENTRA1’s capital raising under U.S.-Japan framework (and/or other sources) would reduce NuScale milestone funding obligations. Management said project-level financing derisks the overall project, but PMA milestone payments are separate and tied to TVA term sheet/PPA expectations.
  • Fuel supply strategy with Framatome: Analyst queried whether Framatome’s '444 assemblies on notice' supports ~12 module deployments and about capacity/run-rate. Management responded they are in preliminary design; fuel readiness takes several years. They emphasized global facilities and planning lead-time to avoid bottlenecks, with ongoing market demand updates to Framatome.

Sentiment: POSITIVE

Note: This summary was synthesized by AI from the SMR Q1 2026 earnings transcript. Financial data is complex; please verify all metrics against official SEC filings before making investment decisions.

πŸ“‹ Official Regulatory 10-K / 10-Q SEC Filings

Direct authenticated documentation links to audited SEC database reports for SMR.

SEC EDGAR Live Feed
Loading financial data and tables...
πŸ“

SEC Filings (SMR)

Β© 2026 Stock Market Info β€” NuScale Power Corporation (SMR) Financial Profile