Snap-on Incorporated

Snap-on Incorporated (SNA) Market Cap

Snap-on Incorporated has a market capitalization of .

No quote data available.

CEO: Nicholas T. Pinchuk

Sector: Industrials

Industry: Manufacturing - Tools & Accessories

IPO Date: 2017-03-02

Website: https://www.snapon.com

Snap-on Incorporated (SNA) - Company Information

Market Cap: -|Sector: Industrials

Company Profile

Snap-on Incorporated manufactures and markets tools, equipment, diagnostics, and repair information and systems solutions for professional users worldwide. It operates through Commercial & Industrial Group, Snap-on Tools Group, Repair Systems & Information Group, and Financial Services segments. The company offers hand tools, including wrenches, sockets, ratchet wrenches, pliers, screwdrivers, punches and chisels, saws and cutting tools, pruning tools, torque measuring instruments, and other products; power tools, such as cordless, pneumatic, hydraulic, and corded tools; and tool storage products comprising tool chests, roll cabinets, and other products. It also provides handheld and computer-based diagnostic products, service and repair information products, diagnostic software solutions, electronic parts catalogs, business management systems and services, point-of-sale systems, integrated systems for vehicle service shops, original equipment manufacturer purchasing facilitation services, and warranty management systems and analytics. In addition, the company offers solutions for the service of vehicles and industrial equipment that include wheel alignment equipment, wheel balancers, tire changers, vehicle lifts, test lane equipment, collision repair equipment, vehicle air conditioning service equipment, brake service equipment, fluid exchange equipment, transmission troubleshooting equipment, safety testing equipment, battery chargers, and hoists, as well as after-sales support services and training programs. Further, it provides financing programs to facilitate the sales of its products and support its franchise business. The company serves the aviation and aerospace, agriculture, construction, government and military, mining, natural resources, power generation, and technical education industries, as well as vehicle dealerships and repair centers. Snap-on Incorporated was founded in 1920 and is based in Kenosha, Wisconsin.

Analyst Sentiment

61%
Buy

From 11 Active Polls

1Y Forecast: $415.33

▲ +0.0% Potential Upside

Consensus Target Metrics

Low Bound

$395

Median

$420

High Bound

$431

Average

$415

Price & Moving Averages

Loading chart...

🎯 Wall Street Analyst Intelligence Report

1-Year structural target targets, chart projections, and sentiment maps.

Average 1Y Target
$415.33
▲ +9.36% Upside
Low Target
$395.00
4% Risk
Median Target
$420.00
11% Mid
High Target
$431.00
13% Max

Consensus Trend Projection

Trailing closures vs. 12-month metrics map.

Analyst Vote Distribution

Aggregate institutional coverage sentiment weights.

Sentiment volume allocation data unavailable.

Historical valuation matrix unavailable.

📘 Full Research Report

ℹ️

AI-Generated Research: This report is for informational purposes only.

📘 SNAP ON INC (SNA) — Investment Overview

🧩 Business Model Overview

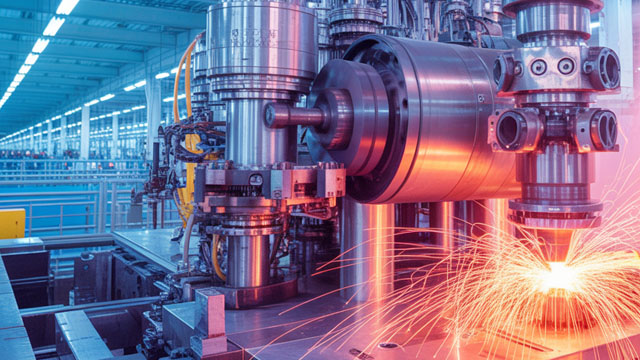
Snap-on designs and manufactures professional-grade tooling, diagnostics, and service equipment used by automotive repair technicians and industrial maintenance professionals. The value chain spans product engineering and manufacturing, distribution through a large franchise/dealer network (and other channels), and then ongoing service enablement through software-driven diagnostics and service-bay workflow tools. Customer stickiness is reinforced by the way technicians standardize on specific tool ecosystems for measurement, troubleshooting, calibration support, and repair verification—reducing the friction of switching platforms once a shop’s workflow and training are built around the installed toolset.

💰 Revenue Streams & Monetisation Model

Revenue is primarily generated through (1) tool and equipment sales—often bundled with recurring accessories, (2) diagnostics and electronics—including hardware plus software-related updates and licensing, and (3) subscription-like monetisation embedded in diagnostic enablement (updates, feature expansions, and ongoing platform support). The margin profile is supported by a mix of durable, higher-value products and software-enabled recurring revenue that tends to be less dependent on raw unit volume than pure consumables.

Key margin drivers include product differentiation in pro-grade diagnostics, penetration of software-enabled offerings within the diagnostic installed base, and disciplined cost structure across manufacturing and sourcing. Distribution economics also matter: franchise/dealer leverage can help stabilize demand capture while reducing direct customer acquisition costs.

🧠 Competitive Advantages & Market Positioning

Snap-on’s moat is best described as a combination of switching costs (workflow and training built around specific diagnostic ecosystems) and intangible assets (deep application know-how, product integration, and long-developed channel capabilities). Once a repair shop standardizes on a diagnostic tool platform, the practical cost of switching includes technician retraining, revalidation of troubleshooting workflows, and the risk of lost diagnostic coverage during transitions. This favors incumbent tool ecosystems when vehicles and repair procedures become more electronic and software-driven.

  • Switching Costs / Installed Base Effects: Diagnostic platforms require continuous coverage for evolving vehicle systems, and shop workflows often become standardized around a specific interface and update cadence.
  • Intangible Assets: Engineering depth in measurement, calibration support, and diagnostic user experience builds cumulative product effectiveness over time.
  • Channel & Execution Capability: Distribution through a franchise/dealer model supports local serviceability, training, and ongoing customer relationships—difficult for low-service competitors to replicate.

Competitive benchmarking:

  • Stanley Black & Decker (MAC Tools / professional tool brands): More diversified industrial/tool exposure with competitive offerings across tool categories; Snap-on’s differentiating emphasis remains deeper integration in high-end professional diagnostics and a concentrated pro-service focus.
  • Bosch (automotive service diagnostics solutions): Strong diagnostics capabilities and broad coverage; Snap-on competes by pairing pro-grade hardware with a workflow-centric ecosystem and an entrenched shop-facing distribution model.
  • Autel (aftermarket diagnostics platforms): Competitive price/performance in aftermarket diagnostic tools; Snap-on’s defensible edge is the combination of software enablement, diagnostic usability for pro technicians, and switching-cost dynamics once an installed base is established.

Overall, rivals may compete on individual products or price points, but sustained share gains are harder when shop workflows, training, and diagnostic coverage expectations create friction in changing tool ecosystems.

🚀 Multi-Year Growth Drivers

Over a 5–10 year horizon, the addressable market expands as vehicle technology increases complexity and as maintenance shifts toward diagnostics-led repair rather than mechanical troubleshooting alone. Key structural drivers include:

  • Vehicle parc complexity: Advanced electronics, sensor density, and control-module integration increase the need for high-coverage diagnostic tools and reliable measurement workflows.
  • Software-enabled repair and calibration: Repair procedures increasingly require software support, validation, and ongoing update capability—supportive of recurring enablement economics.
  • Professionalization of maintenance: Repair shops seek higher throughput, fewer “guess-and-check” diagnostics, and standardized processes—supporting adoption of integrated tool ecosystems.
  • Industrial maintenance penetration: Maintenance ecosystems in industrial settings face similar complexity trends, supporting continued demand for pro-grade tools and diagnostic equipment.
  • Channel-driven installed base expansion: As dealers and franchise networks reinforce training and service relationships, incremental tool purchases can be additive to a shop’s existing ecosystem.

⚠ Risk Factors to Monitor

  • Aftermarket cyclicality: Repair shop spending can soften during economic slowdowns, impacting discretionary tool upgrades.
  • Technology and coverage risk: Diagnostics platforms face ongoing challenges in maintaining coverage as OEM systems evolve; gaps can drive customer frustration and share erosion.
  • Competitive pricing pressure: Aftermarket diagnostic and tool competitors can compress margins by pursuing volume or aggressive pricing strategies.
  • Capital allocation and working capital: Inventory, manufacturing efficiency, and channel inventory management can influence cash flow quality.
  • Dealer/network execution: Franchise economics rely on dealer health and customer service quality; underperformance in channel operations can reduce conversion and retention.

📊 Valuation & Market View

The market typically values Snap-on as a high-quality industrial with elements of recurring economics driven by diagnostics enablement and an installed base. Equity valuation frameworks often place weight on earnings power consistency, operating margin trajectory, and the proportion of revenue influenced by software-enabled updates and ecosystem retention. Key value drivers include sustained diagnostics growth, margin durability, and cash flow conversion supported by disciplined working capital management. When investors perceive stronger installed-base retention and better monetisation of diagnostic software enablement, valuation multiples tend to support a premium relative to purely commoditized tool manufacturers.

🔍 Investment Takeaway

Snap-on’s long-term investment appeal rests on a durable pro-technician ecosystem: switching costs created by diagnostic workflow standardization, intangible engineering depth that sustains coverage effectiveness, and channel capabilities that make tool adoption and ongoing support more practical for repair shops. While the business remains exposed to aftermarket cycles and technology coverage challenges, its ecosystem-driven monetisation model provides a structural foundation for resilient performance through continued vehicle and maintenance complexity.


⚠ AI-generated — informational only. Validate using filings before investing.

📊 AI Financial Analysis

Powered by StockMarketInfo
Earnings Data: Q Ending 2026-04-04

"SNA reported Revenue of $1.21B and Net Income of $247M in the most recent quarter (EPS $4.76). QoQ, revenue declined to $1.21B from $1.34B (-9.8%), and net income fell from $260.7M to $247M (-5.3%), indicating near-term normalization after a stronger prior quarter. YoY (comparing to the same-season prior-year quarter, 2025-03-29), revenue was slightly lower ($1.24B to $1.21B, -2.8%), while net income rose ($240.5M to $247M, +2.7%), suggesting improved cost/mix and an earnings resilience despite softer top-line. Profitability improved across the 4-quarter period: net margin increased (latest ~20.5% vs ~19.5% in the prior quarter and ~19.4% in the year-ago quarter). Shares outstanding were roughly stable to slightly down (524M–519M range), consistent with modest capital return support. Balance sheet remains strong: total equity increased to ~$5.98B and net debt is negative (net cash) at about -$0.80B, which supports dividend stability. The dividend yield is low (~0.7%) but payout remains moderate (payout ratio ~51%). On shareholder returns, the stock is up 14.5% over the last year; adding the dividend implies total return materially driven by price appreciation. Valuation is near consensus targets (394.5 vs current 380.3), with moderate upside (~4%)."

Revenue Growth

Fair

QoQ revenue declined -9.8% (1.34B -> 1.21B). YoY revenue was slightly down -2.8% (1.24B -> 1.21B), indicating soft demand/seasonality.

Profitability

Good

Net margin expanded (latest ~20.5% vs ~19.5% QoQ and ~19.4% YoY). Net income was up YoY (+2.7%) despite revenue softness.

Cash Flow Quality

Positive

Net income supports earnings-based cash generation, and dividends appear sustainable with a moderate payout ratio (~51%). No cash-flow statement provided; buyback evidence is limited (shares slightly down).

Leverage & Balance Sheet

Strong

Equity is stable-to-up (to ~$5.98B) and the company carries net cash (netDebt ~ -$0.80B), indicating strong balance-sheet resilience.

Shareholder Returns

Good

1Y price momentum is positive (+14.54%). Dividend yield is modest (~0.7%), so total return is primarily capital appreciation.

Analyst Sentiment & Valuation

Positive

Consensus target (~394.5) is close to current price (380.3), implying limited near-term upside (~4%).

Disclaimer:This analysis is AI-generated for informational purposes only. Accuracy is not guaranteed and this does not constitute financial advice.

Fundamentals Overview

Loading fundamentals overview...

Snap-on delivered a resilient Q1 2026: sales of $1.272B (+5.8% y/y, 3.4% organic) and EPS of $4.69 (+$0.18). The story is strength in vehicle repair/complexity-driven demand (especially RS&I to independents and Tools storage uptake), offset by macro and policy friction—tariffs/material costs and FX pressure. Consolidated gross margin slipped 30 bps (50.4% vs 50.7%) and consolidated/OpCo margins declined (24.4% vs 25.3%; OpCo 20.8% down 50 bps), though management emphasized margin resilience from RCI savings and manufacturing localization. Tools showed the clearest positive leverage: gross margin +140 bps to 47.7% and operating margin +160 bps to 21.6% as RCI savings and product mix overcame headwinds. Financial services credit quality remained stable-to-improving (U.S. 60+ delinquency 1.9%, down 10 bps y/y). Near-term visibility is constrained because the transcript omits final guidance details.

AI IconGrowth Catalysts

  • RS&I software/diagnostics momentum: Diagnostic and Repair Information sales to independent repair shops increased; RS&I sales hit the group’s highest-ever quarter.
  • Tools Group pivot to short payback: strong uptake of tool storage products; “green shoots” referenced in franchisees and tool storage units.
  • First-to-market/launches in power tools and access: 214.4-volt agents cordless ratchets (CTR-887 long neck, CTR-881 compact) and Nano Access Cordless expansion with CTN 2040 straight power driver (narrow 90-degree head).
  • New socket/fitment innovation: IPST-ML12 (52% longer swivel side) and 1119NTMLE (19-piece set, 22% shorter and 8% narrower) tied to Nano Access cordless success.
  • RS&I equipment automation: Conway Arkansas-built Pro Series Protec (single unit for R-134a and R1234YF) with automatic functionality and VIN-based onboard database to reduce manual lookup time.

Business Development

  • Michelin One-linked workflow: newly launched feature streamlines shop job estimates using the Mitchell One brand workflow (estimates and time-consuming challenge reduction).

AI IconFinancial Highlights

  • Net sales $1.272B, up 5.8% y/y (3.4% organic) and new first-quarter record; CFO cited $26.9M favorable foreign currency translation.
  • EPS $4.69, up $0.18 vs 2025 ($247M net earnings vs $240.5M).
  • OpCo operating margin 20.8%, down 50 bps y/y due to FX (-40 bps) and higher investments despite gross margin resilience.
  • Consolidated operating margin 24.4% (including OpCo + financial services), down 90 bps vs 25.3% last year; financial services margin headwind cited.
  • Gross margin 50.4% vs 50.7%: -30 bps primarily from -40 bps unfavorable foreign currency; offset by RCI savings and volume benefits but pressured by tariffs/material costs.
  • C&I gross margin 40.3% vs 42.6%: decline driven by tariffs/material costs and -50 bps FX, partially offset by volume savings.
  • Tools Group gross margin +140 bps to 47.7% (46.3% prior) overcoming tariffs/material costs; operating margin +160 bps to 21.6%.
  • RS&I gross margin +30 bps to 46.0% (45.7% prior) while operating margin 24.6% down ~110 bps (25.7% prior) due mainly to FX and increased investments (large language model/data fortification).
  • Effective tax rate 22.0% vs 22.2% last year (near-flat).
  • Financial services portfolio: average yield on finance receivables 17.6% unchanged; U.S. 60-day+ delinquency rate 1.9% down 10 bps y/y and down 20 bps vs last quarter; trailing 12-month net losses $72.9M (3.75% of outstandings).

AI IconCapital Funding

  • Share repurchase: 267,000 shares for $99.9M under existing program.
  • Remaining authorization: $234.1M additional repurchases available.
  • Dividends: $126.8M paid during the quarter.
  • Cash position: $1.753B at quarter-end (vs $1.624B end of 2025).
  • Credit facilities: >$900M available; no borrowings and no commercial paper outstanding during the quarter.
  • Debt: notes payable/current maturities of long-term debt increased $300M due to reclassification of March 2027 unsecured 3.25% notes to current status.

AI IconStrategy & Ops

  • RCI/automation: continued investment to fortify proprietary databases and expand use of large language models across key business functions.
  • Diagnostics automation: VIN identification presets OEM specifications in new Pro Series Protec units to reduce manual lookup and improve productivity/error-proofing.
  • Supply chain/capacity emphasis: referenced manufacturing in America and investments to maintain capacity and speed for new product launches.
  • Commercial discipline: management described operating resilience with gross margin holding firm despite tariff uncertainty and higher material costs.

AI IconMarket Outlook

  • Outlook section begins but is cut off in the provided transcript; no complete 2026 guidance numbers or dates were captured.

AI IconRisks & Headwinds

  • Tariffs and higher material costs: cited as ongoing headwind pressure in consolidated gross margin and RS&I/C&I profitability (C&I operating margin -110 bps; RS&I operating margin -~110 bps).
  • Foreign currency: repeated references to unfavorable FX effects (consolidated operating margin included ~40 bps unfavorable FX; OpCo margin down 50 bps with ~40 bps FX).
  • Customer confidence uncertainty: management described tepid tech confidence/indecision on long-term purchases; pivot to short payback continues but implies demand variability.
  • OEM dealer channel softness: RS&I activity described as essentially flat; Diagnostic/Repair Information gains to independents offset decreased sales to OEM dealerships, attributed to lower North America OEM program activity.

Q&A: Analyst Interest

    Sentiment: MIXED

    Note: This summary was synthesized by AI from the SNA Q1 2026 earnings transcript. Financial data is complex; please verify all metrics against official SEC filings before making investment decisions.

    Loading financial data and tables...
    © 2026 Stock Market Info — Snap-on Incorporated (SNA) Financial Profile