Stryker Corporation

Stryker Corporation (SYK) Market Cap

Stryker Corporation has a market capitalization of $117.18B.

Price: $305.66

β–² 4.45 (1.48%)

Market Cap: 117.18B

NYSE Β· time unavailable

CEO: Kevin A. Lobo

Sector: Healthcare

Industry: Medical - Devices

IPO Date: 1980-03-17

Website: https://www.stryker.com

Stryker Corporation (SYK) - Company Information

Market Cap: 117.18B|Sector: Healthcare

Company Profile

Stryker Corporation operates as a medical technology company. The company operates through two segments, MedSurg and Neurotechnology, and Orthopaedics and Spine. The Orthopaedics and Spine segment provides implants for use in hip and knee joint replacements, and trauma and extremities surgeries. This segment also offers spinal implant products comprising cervical, thoracolumbar, and interbody systems that are used in spinal injury, deformity, and degenerative therapies. The MedSurg and Neurotechnology segment offers surgical equipment and surgical navigation systems, endoscopic and communications systems, patient handling, emergency medical equipment and intensive care disposable products, reprocessed and remanufactured medical devices, and other medical device products that are used in various medical specialties. This segment also provides neurotechnology products, which include products used for minimally invasive endovascular techniques; products for brain and open skull based surgical procedures; orthobiologic and biosurgery products, such as synthetic bone grafts and vertebral augmentation products; minimally invasive products for the treatment of acute ischemic and hemorrhagic stroke; and craniomaxillofacial implant products, including cranial, maxillofacial, and chest wall devices, as well as dural substitutes and sealants. The company sells its products to doctors, hospitals, and other healthcare facilities through company-owned subsidiaries and branches, as well as third-party dealers and distributors in approximately 75 countries. Stryker Corporation was founded in 1941 and is headquartered in Kalamazoo, Michigan.

Analyst Sentiment

89%
Strong Buy

From 28 Active Polls

1Y Forecast: $387.46

β–² +26.8% Potential Upside

Consensus Target Metrics

Low Bound

$315

Median

$394

High Bound

$465

Average

$387

Price & Moving Averages

Loading chart...

🎯 Wall Street Analyst Intelligence Report

1-Year structural target targets, chart projections, and sentiment maps.

Average 1Y Target
$387.46
β–² +26.76% Upside
Low Target
$315.00
3% Risk
Median Target
$394.00
29% Mid
High Target
$465.00
52% Max

Consensus Trend Projection

Trailing closures vs. 12-month metrics map.

Analyst Vote Distribution

Aggregate institutional coverage sentiment weights.

Sentiment volume allocation data unavailable.

πŸ“Š Historical Valuation Multiples

Real-time Trailing Twelve Month (TTM) momentum side-by-side with discrete quarterly metrics.

Fiscal QuarterTTMQ1 2026Q4 2025Q3 2025Q2 2025Q1 2025Q4 2024Q3 2024Q2 2024
Period EndingTrailing 12MMar 31, 2026Dec 31, 2025Sep 30, 2025Jun 30, 2025Mar 31, 2025Dec 31, 2024Sep 30, 2024Jun 30, 2024
Market Cap ($M)117,178β€”β€”β€”β€”β€”β€”β€”β€”
Enterprise Value ($M)128,524β€”β€”β€”β€”β€”β€”β€”β€”
Price to Earnings Ratio (P/E)35.0742.2239.5941.1442.7654.3162.8141.2738.85
Price/Earnings-to-Growth Ratio (PEG)β€”β€”β€”β€”β€”β€”β€”β€”β€”
Price to Sales Ratio (P/S)4.6420.9018.7523.3425.1124.2221.3125.0623.65
Price to Book Ratio (P/B)5.255.646.006.497.146.796.656.836.49
Price to Free Cash Flow Ratio (P/FCF)25.64β€”β€”β€”β€”β€”β€”β€”β€”
Enterprise Value to Sales (EV/Sales)β€”β€”β€”β€”β€”β€”β€”β€”β€”
Enterprise Value to EBITDA (EV/EBITDA)22.22β€”β€”β€”β€”β€”β€”β€”β€”
Debt to Equity Ratio1.96β€”β€”β€”β€”β€”β€”β€”β€”

⚑ SYK Growth Runway Model

Standard long term linear growth fade

Multi-Stage Discounted Cash Flow Sandbox

Market Price$305.66
Intrinsic Value$207.97
Market Alignment
Overvalued by 32.0%relative to calculated intrinsic value
9.00%
Exp: 10%10%
i

Growth runway slowdown

This value provides a time window for the growth rate to decline beyond Stage 1 toward the terminal rate. Longer windows are most useful for companies with high growth starting conditions or strong competitive advantages. This option stretches out the growth rate slowdown across 5, 10, or 15-year steps. A high-growth starting condition (exceeding a 25% initial growth rate) automatically applies a curve decay to simulate realistic, rapid market saturation.
i

Terminal growth rate

With long-term inflation between 3-5%, revenue must grow by that baseline to maintain flat real-world market share. This value sets the permanent terminal growth rate to factor into the valuation beyond the growth slowdown runway toward maturity.

3-Stage Financial Runway Horizon

🧠 Perpetuity Horizon Engine (Stage 3: Post-2035)

Terminal FCF Base$7.90B
Perpetuity TV Value$148.67B
Discounted TV (PV)$62.80B
TV Weighting %63.0%
⚠️
Financial Model Disclaimer & Risk Disclosure: This interactive scenario simulator is an educational sandbox provided strictly for informational and analytical research purposes. Core historical financial statements and consensus estimates are sourced directly via Financial Modeling Prep (FMP). All downstream outputs are entirely deterministic, hypothetical projections generated by combining automated mathematical formulas (including linear interpolation and Gaussian bell-curve decay models) with user-selected variables and third-party financial data inputs. Users assume all liability for trading decisions executed based on these sandbox calculations.

πŸ“˜ Full Research Report

ℹ️

AI-Generated Research: This report is for informational purposes only.

πŸ“˜ STRYKER CORP (SYK) β€” Investment Overview

🧩 Business Model Overview

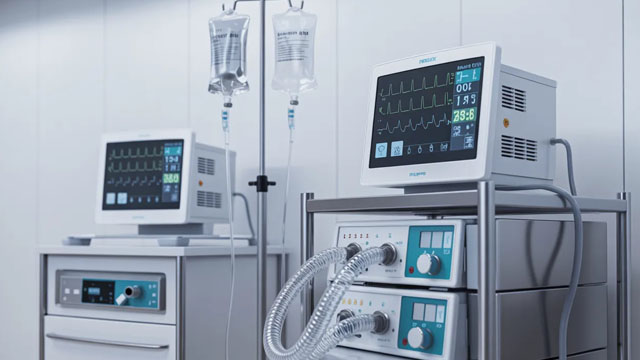
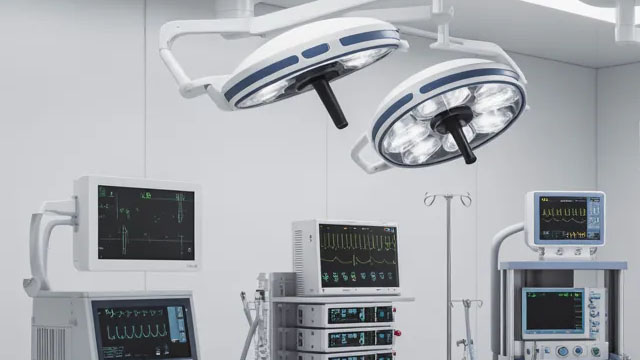
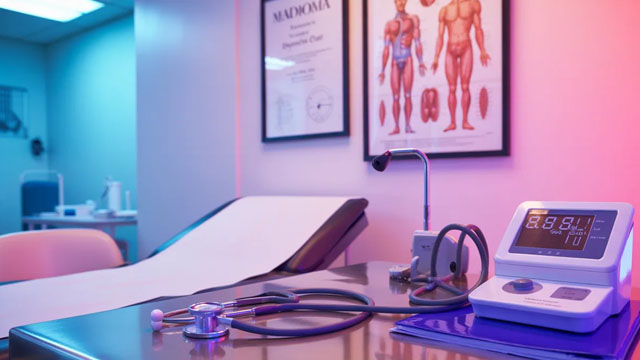
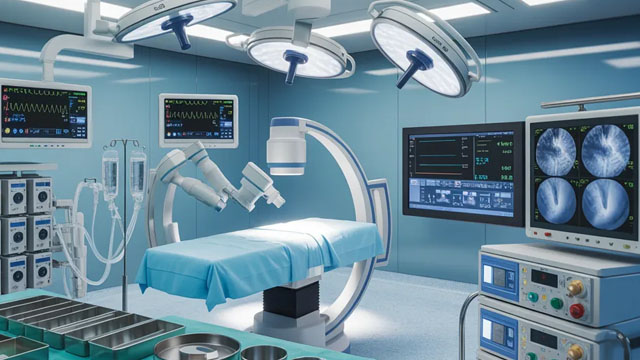
Stryker is a global medical technology company serving hospitals, ambulatory surgery centers, and surgeons across orthopedics, surgical instruments, neurosurgery, spine, and related clinical specialties. The business model blends capital-light clinical solutions with device ecosystems that embed Stryker into an operating room’s workflow: implants and disposable components are supported by instruments, training, andβ€”where applicableβ€”technology platforms used to plan, navigate, or standardize procedures.

Value is created by pairing clinical evidence and device performance with a high-frequency customer environment (procedure volume) and repeat purchasing (replacement of consumables and implant demand tied to patient populations).

πŸ’° Revenue Streams & Monetisation Model

Monetisation is primarily through transactional device sales (implants, disposables, instruments) with installed-base dynamics that increase the lifetime economic value per hospital system. In orthopedics and trauma, Stryker typically captures value through a combination of:

  • Procedure-driven demand (hip/knee/trauma volumes, patient outcomes, and revision rates)
  • Mix and platform upgrades (higher-performing systems, technique adoption, and accessory/consumable attach)
  • Recurring elements of usage (replenishment of disposables and instrument-related workflows across repeated surgeries)

Margin drivers are most sensitive to product mix (value-added platforms vs. commoditized items), manufacturing efficiency, logistics and supply continuity, and the ability to sustain pricing and rationalize portfolio costs. Stryker’s scale supports cost discipline across R&D, regulatory submissions, and manufacturing overhead allocation.

🧠 Competitive Advantages & Market Positioning

Stryker’s principal moat is high switching costs and installed-base stickiness in surgical and orthopedic workflows, reinforced by regulatory and clinical barriers to entry and scale-driven cost advantages.

  • Switching costs (installed-base + training + compatibility): Hospitals and surgeon teams adopt specific instrument sets, procedure techniques, and implant systems. Switching disrupts clinical familiarity, training, and procurement routines, and can require revalidation of workflows and inventory planning.
  • Clinical evidence and regulatory complexity: New device platforms require substantial engineering, clinical validation, and regulatory clearance, raising the effective time and cost required to displace entrenched systems.
  • Scale and operational execution: Broad manufacturing footprint, supplier management, and portfolio depth reduce average cost and support sustained investment in innovation.

Competitive benchmarking:

  • Johnson & Johnson (J&J) MedTech β€” broad medtech competitor spanning orthopedics and other specialties; competes for procedure share and platform upgrades.
  • Medtronic β€” strong presence in certain surgical and specialty device areas; competes through technology platforms and clinical partnerships.
  • Zimmer Biomet β€” major orthopedics competitor competing in implant systems and technique adoption.

Positioning contrast: Compared with these rivals, Stryker’s emphasis on orthopedics and procedure-centered technology integration strengthens installed-base effects across hospitals and surgeons, while its platform approach supports repeat usage patterns tied to instrument workflows and disposables rather than isolated one-off product introductions.

πŸš€ Multi-Year Growth Drivers

  • Demographics and procedure prevalence: Aging populations and the higher incidence of joint and mobility-related conditions support long-run demand for implants and related procedures.
  • Revision and durability-linked demand: Patient outcomes, implant longevity, and replacement cycles underpin a structural demand tailwind.
  • Technology adoption and mix shift: Upgrades to higher-performing platforms, minimally disruptive techniques, and product assortments that improve procedural efficiency support unit value growth.
  • Hospital systems increasing device complexity: As operating room workflow becomes more standardized and integrated, buyers favor vendors that can provide systems, training, and consistent supplyβ€”benefiting scale leaders.
  • Emerging market penetration: Expanding access to elective procedures can broaden the addressable market over a 5–10 year horizon, assuming continued regulatory normalization and distribution buildout.

⚠ Risk Factors to Monitor

  • Regulatory and compliance exposure: Device approvals, post-market surveillance, and quality systems in multiple jurisdictions can affect product availability and financial outcomes.
  • Product quality and recall/litigation risk: Defects, reporting failures, or adverse event signals can lead to recall costs, loss of procedure share, and litigation.
  • Reimbursement and purchasing pressure: Hospital budget constraints, contracting dynamics, and payer policies can constrain pricing and mix.
  • Competitive displacement: Rivals can gain share via superior clinical outcomes, improved economics for health systems, or faster platform adoption.
  • Supply chain and manufacturing concentration: Availability of components and capacity planning are critical in device manufacturing; disruptions can impair shipments and increase costs.

πŸ“Š Valuation & Market View

The medtech market often values durable device franchises through earnings-based multiples and quality-adjusted cash flow metrics, with premiums typically associated with:

  • Repeatable demand drivers (installed-base/procedure-linked revenue)
  • Sustained margin structure driven by mix, manufacturing efficiency, and pricing discipline
  • Pipeline effectiveness (innovation that translates into platform adoption rather than purely incremental releases)
  • Capital allocation credibility (investment in R&D, capacity, and bolt-on acquisitions that strengthen installed-base depth)

Key valuation movers in this sector typically include confidence in long-run procedure volume, the durability of installed-base economics, and the ability to manage regulatory and quality risk without impairing product continuity.

πŸ” Investment Takeaway

STRYKER’s long-term investment case rests on structural switching costs and installed-base stickiness in procedure-driven orthopedics and surgical workflows, supported by regulatory/clinical barriers to entry and scale-driven operating leverage. With demand anchored by demographics and ongoing technology adoption, Stryker is positioned to sustain value creation through platform upgrades and repeat usage patterns, provided execution remains strong across quality, regulatory compliance, and supply continuity.


⚠ AI-generated β€” informational only. Validate using filings before investing.

πŸ“Š AI Financial Analysis

Powered by StockMarketInfo
Earnings Data: Q Ending 2026-03-31

"SYK reported Q1’26 Revenue of $6.02B and Net Income of $745M (EPS $1.95). On a YoY basis (vs Q1’25), Revenue increased 2.7% and Net Income rose 14.0%, with EPS climbing from $1.71 to $1.95. QoQ (vs Q4’25), Revenue declined 16.1% and Net Income fell 12.2%. Profitability improved over the last year: net margin increased to 12.4% from 11.1% (YoY), while gross margin was slightly lower than Q4 but held above the prior-year quarter. Across the last four quarters, margins have been volatile quarter-to-quarter, but the YoY improvement in Net Income and EPS suggests cost discipline and better below-the-line items. Cash flow in Q1’26 remained strong relative to earnings: Operating Cash Flow was $581M and Free Cash Flow was $415M. However, unlike Q4’25’s unusually high operating cash flow, working capital was a headwind this quarter (change in working capital of -$464M). Dividends remain a key capital return channel, with dividends paid of $337M; buybacks were not reflected in this dataset. Total shareholder returns are modest based on provided market data: the stock is essentially flat over 1Y (-1.0%), so there’s no strong momentum tailwind. Analyst valuation appears supported by consensus targets (current ~$343 vs consensus ~$390)."

Revenue Growth

Neutral

Revenue was $6.02B in Q1’26, up 2.7% YoY but down 16.1% QoQ (from $7.17B in Q4’25). The YoY trend is modestly positive while quarter-to-quarter seasonality/volume looks weak.

Profitability

Positive

Net Income was $745M, +14.0% YoY (vs $654M) and EPS rose to $1.95 (+14.0% YoY). Net margin improved to 12.4% from 11.1% YoY, though QoQ Net Income fell 12.2% and margin metrics remain somewhat choppy across quarters.

Cash Flow Quality

Neutral

Q1’26 OCF was $581M and Free Cash Flow $415M. Cash was supported by earnings but working capital was a notable drag (-$464M change in working capital). Dividend outflows were consistent ($337M), with no buybacks indicated in the dataset.

Leverage & Balance Sheet

Neutral

Total assets were $46.3B (down from $47.8B in Q4’25). Equity was stable at $22.3B vs $22.4B, while total debt was $14.2B and net debt was $11.3B, improving slightly QoQ.

Shareholder Returns

Fair

Provided marketPerformance shows -1.0% over 1Y, so capital appreciation is not a strong driver. Dividend yield shown (~0.27%) is small; total return is therefore only moderate. No buyback impact is captured here.

Analyst Sentiment & Valuation

Good

Consensus price target (~$389.6) is above the current price (~$343.3), implying attractive upside versus the provided valuation context. High price momentum is absent, but valuation appears supportive.

Disclaimer:This analysis is AI-generated for informational purposes only. Accuracy is not guaranteed and this does not constitute financial advice.

Fundamentals Overview

Loading fundamentals overview...

SYK’s Q1 2026 performance was materially distorted by a late-quarter cyber incident that drove operational disruption, lost manufacturing absorption, and delayed shipments/revenue recognition. Adjusted EPS fell to $2.60 (-8.5% y/y), with margins pressuredβ€”gross margin down 190 bps to 63.6% and operating margin down 180 bps to 21.1%β€”from shutdown absorption losses and tariff effects. Management repeatedly stressed normalization over the year, not a demand collapse: organic sales grew 2.4% (1.9% U.S., 3.9% international) with underlying procedural volumes described as healthy and CapEx steady; Mako installations delivered a β€œbest ever” Q1 with increasing utilization. The company maintained full-year guidance despite Q1 volatility: 8% to 9.5% organic net sales growth and adjusted EPS of $14.90 to $15.10. In growth/strategic actions, SYK announced AVS acquisition (close in Q2) and formed the Ortho Tech segment, while highlighting mid-year Mako 4 shoulder launch and back-half weighted international product ramp (Pangea/LIFEPAK).

AI IconGrowth Catalysts

  • Best-ever Q1 for Mako installations (U.S. and international) with high and increasing utilization rates
  • Mako Shoulder positive surgeon feedback; full launch on Mako 4 targeted mid-year
  • Triathlon Gold medial-stabilized inserts launch momentum
  • Pangea driving above-market trauma/orthopaedic growth; Europe approval received (ahead of schedule) and ramping production
  • LIFEPAK continued international runway (Europe approval; reramping production on LIFEPAK 35 after production slowdown)

Business Development

  • Agreed acquisition of Amplitude Vascular Systems (AVS) expected to close in Q2 2026; expands peripheral vascular treatment options and broadens cardiovascular presence
  • Ortho Tech business formation: combination of Mako and Enabling Technologies with Orthopaedic Instruments portfolio to simplify customer experience, accelerate innovation, increase speed to market

AI IconFinancial Highlights

  • Organic sales growth: 2.4% worldwide (1.9% U.S., 3.9% international); cyber incident late in quarter distorted near-term revenue recognition and shipments
  • Adjusted EPS: $2.60 (down $0.24, -8.5% vs 2025); driven by limited sales growth and lost manufacturing absorption from cyber shutdowns, plus tariffs and higher interest expense (partially offset by operational excellence and slightly favorable FX translation)
  • Adjusted gross margin: 63.6%, down 190 bps vs Q1 2025 (tariffs impact and lost manufacturing absorption due to cyber incident; no incremental tariff impacts in Q1 2025)
  • Adjusted operating margin: 21.1% of sales, down 180 bps vs Q1 2025 (gross margin pressure and operating deleveraging; partially offset by cost discipline)
  • Adjusted other income/expense: $97M (up $24M vs 2025) from higher interest expense due to 2025 debt issued to fund Inari acquisition; lower interest income from reduced cash balances and lower rates
  • Adjusted effective tax rate: 14.5% in Q1; full-year 2026 expected 15% to 16%
  • Cash flow: YTD cash from operations $581M, impacted by normal seasonality plus cyber incident effects on net earnings/working capital timing (inventories and receivables)

AI IconCapital Funding

  • Gross debt to EBITDA ~2.1x at quarter end (supports acquisition firepower)
  • No explicit buyback authorization/amount mentioned in transcript

AI IconStrategy & Ops

  • Cyber incident recovery: fully operational across global manufacturing network as of week of April 1; unauthorized party removed with third-party expert support; systems brought back to mitigate customer/patient impact
  • Revenue recovery cadence: Q2 catch-up includes revenue recognition delays; rescheduled procedures bleed into Q3/Q4; made-to-order production re-scheduling and returns to schedule largely in back half
  • Segment reporting changes: Ortho Tech results now include Orthopaedic Instruments + Mako and Enabling Technologies (plus bone cement); Neuro Cranial now grouped with Instruments/Surgical Technologies
  • Mako commercialization: record Q1 installations; continued expectation of sustained momentum from installations and utilization

AI IconMarket Outlook

  • Maintained full-year 2026 guidance despite Q1 cyber distortions
  • Full-year organic net sales growth: 8% to 9.5%
  • Full-year adjusted EPS: $14.90 to $15.10
  • Full-year adjusted other income/expense expected ~ $420M
  • Cadence expectation: lost Q1 sales realized throughout remainder of year; revenue recognition catch-up expected in Q2; delayed procedures/orders impacting second half

AI IconRisks & Headwinds

  • Cyber incident: late-quarter operational disruption causing lost manufacturing absorption, delayed shipments, and outsized revenue recognition distortion (normalized over 2026)
  • Tariffs: gross margin and operating margin headwinds in Q1 and expected continued margin impact early in 2026; no incremental tariff impacts in Q1 2025
  • Input cost inflation/geopolitical effects: management expects some pressure on input costs but claims procurement mitigation and contracts absorb increases
  • Geopolitical risk: conflict in Iran modestly affected international growth (limited overall impact); Middle East long-term opportunity tempered by current volatility
  • Procedural deferral/rescheduling and make-to-order production constraints create quarter-to-quarter variability

Q&A: Analyst Interest

  • Cadence and guidance reconfirmation: Management tied full-year guide maintenance to expected normalization of cyber-driven revenue recognition delays. They emphasized Q2 catch-up for recognition, while deferred/rescheduled procedures likely bleed into Q3/Q4 and made-to-order production recovery is back-half weighted; quarterly precision not provided.
  • Margin outlook and inflation mitigation: Management reiterated full-year operating margin expectations remain unchanged versus the prior 3-year window (150+ bps framework). They noted near-term tariffs headwinds in Q1/Q2 and said procurement contracts and active sourcing efforts should absorb rising input costs from geopolitical inflation, including oil-related effects.
  • Cyber impact by segment (MedSurg vs Ortho) and recovery timing: Management explained Ortho has more consigned hospital inventory, so procedures often proceeded but revenue recognition activities were pushed into Q2. MedSurg recovery depends on production/shipments for capital make-to-order items; Endo and Medical expected greater Q3/Q4 weighting versus Q2.

Sentiment: MIXED

Note: This summary was synthesized by AI from the SYK Q1 2026 earnings transcript. Financial data is complex; please verify all metrics against official SEC filings before making investment decisions.

πŸ“‹ Official Regulatory 10-K / 10-Q SEC Filings

Direct authenticated documentation links to audited SEC database reports for SYK.

SEC EDGAR Live Feed
Loading financial data and tables...
πŸ“

SEC Filings (SYK)

Β© 2026 Stock Market Info β€” Stryker Corporation (SYK) Financial Profile