Terex Corporation

Terex Corporation (TEX) Market Cap

Terex Corporation has a market capitalization of $4.60B.

Price: $62.84

0.62 (1.00%)

Market Cap: 4.60B

NYSE · time unavailable

CEO: Simon A. Meester

Sector: Industrials

Industry: Industrial - Machinery

IPO Date: 1980-03-19

Website: https://www.terex.com

Terex Corporation (TEX) - Company Information

Market Cap: 4.60B|Sector: Industrials

Company Profile

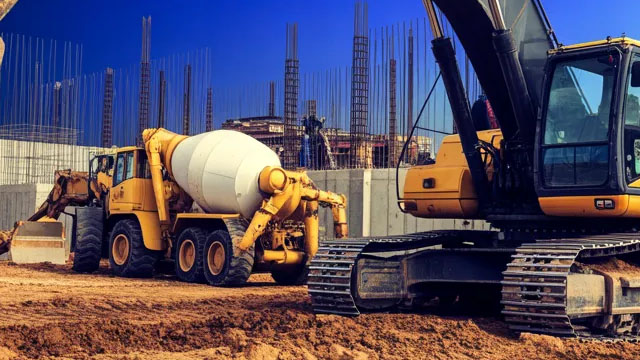
Operating globally, Terex Corporation specializes in the production and distribution of aerial work platforms and a diverse range of materials processing equipment. Its operations are structured into two primary divisions: Aerial Work Platforms (AWP) and Materials Processing (MP). The AWP segment is responsible for the design, manufacturing, servicing, and marketing of access equipment, utility machinery, and telehandlers, primarily under the well-known Terex and Genie brands. This range encompasses items such as portable material and aerial lifts, articulating and telescopic booms (both trailer-mounted and self-propelled), scissor lifts, utility vehicles, and telehandlers. Additionally, it supplies essential components and spare parts. These products serve a broad spectrum of uses, including construction and upkeep of industrial, commercial, institutional, and residential structures, maintaining utility and telecommunication infrastructure, supporting construction and foundation drilling, general commercial activities, tree maintenance, and various infrastructure developments. The MP segment offers an extensive portfolio of materials processing and specialized machinery, distributed under numerous brands and business lines, including Terex, Powerscreen, Fuchs, EvoQuip, Canica, Cedarapids, CBI, Simplicity, Franna, Terex Ecotec, Finlay, Terex Washing Systems, Terex MPS, Terex Jaques, Terex Advance, ProStack, Terex Bid-Well, MDS, and Terex Recycling Systems. Its offerings include crushers, screening and washing systems, trommels, apron feeders, material handlers, a variety of cranes (pick and carry, rough terrain, tower), equipment for wood processing, biomass, and recycling, concrete mixer trucks, concrete pavers, and conveyors, along with necessary components and spare parts. These machines are crucial for diverse applications such as construction, infrastructure development, and recycling initiatives, as well as quarrying, mining, and general material handling. They also play a vital role in maintenance for lifting equipment or materials, landscaping, and the biomass production sectors. To support its clientele, Terex Corporation provides financing options facilitating the rental, leasing, and purchase of its equipment. Established in 1986, Terex Corporation maintains its headquarters in Norwalk, Connecticut.

Analyst Sentiment

81%
Strong Buy

From 14 Active Polls

1Y Forecast: $84.71

▲ +34.8% Potential Upside

Consensus Target Metrics

Low Bound

$70

Median

$84

High Bound

$100

Average

$85

Price & Moving Averages

Loading chart...

🎯 Wall Street Analyst Intelligence Report

1-Year structural target targets, chart projections, and sentiment maps.

Average 1Y Target
$84.71
▲ +34.80% Upside
Low Target
$70.00
11% Risk
Median Target
$84.00
34% Mid
High Target
$100.00
59% Max
Consensus
Buy
14 / 31 Buys

Consensus Trend Projection

Trailing closures vs. 12-month metrics map.

Analyst Vote Distribution

Aggregate institutional coverage sentiment weights.

📊 Historical Valuation Multiples

Real-time Trailing Twelve Month (TTM) momentum side-by-side with discrete quarterly metrics.

Fiscal QuarterTTMQ2 2026Q1 2026Q4 2025Q3 2025Q2 2025Q1 2025Q4 2024Q3 2024
Period EndingTrailing 12MJun 30, 2026Mar 31, 2026Dec 31, 2025Sep 30, 2025Jun 30, 2025Mar 31, 2025Dec 31, 2024Sep 30, 2024
Market Cap ($M)4,6033,8893,5023,3653,0632,5273,0833,540
Enterprise Value ($M)4,200-4036,2465,5395,4495,2824,8155,4133,816
Price to Earnings Ratio (P/E)0.550.16-10.9413.9012.9510.6129.52-385.1710.02
Price/Earnings-to-Growth Ratio (PEG)0.01-0.350.51-160.97
Price to Sales Ratio (P/S)0.692.242.662.432.062.062.482.92
Price to Book Ratio (P/B)0.840.811.671.671.561.371.681.81
Price to Free Cash Flow Ratio (P/FCF)13.58-68.2220.4825.8939.27-44.3424.0840.69
Enterprise Value to Sales (EV/Sales)-0.183.604.203.933.553.924.363.15
Enterprise Value to EBITDA (EV/EBITDA)11.83-2.16-3122.89-461.5629.9430.1840.8167.6630.04
Debt to Equity Ratio-1.140.000.571.341.291.321.401.480.32

📘 Full Research Report

ℹ️

AI-Generated Research: This report is for informational purposes only.

📘 TEREX CORP (TEX) — Investment Overview

🧩 Business Model Overview

Terex designs and manufactures industrial equipment used in construction, infrastructure, material handling, and lifting/access applications. The value chain is largely “engineered-to-application,” translating end-customer operating requirements (lift height, duty cycle, jobsite constraints, safety standards, emissions/efficiency expectations) into specialized equipment platforms.

A key element of the model is the aftermarket ecosystem that follows equipment deployment: parts, service, inspections, and support capabilities tied to a large installed base. This structure links the company’s durable market presence to ongoing maintenance cycles and fleet utilization—supporting a higher proportion of value capture than equipment-only manufacturing.

💰 Revenue Streams & Monetisation Model

Terex monetizes primarily through:

  • Original Equipment Manufacturing (OEM) sales: equipment units sold into construction, rental, and industrial customers. This stream is cyclical and sensitive to construction activity, customer budgets, and credit conditions.
  • Aftermarket parts and service: consumables, components, upgrades, and field service. This stream tends to be more resilient because it is driven by installed-base maintenance and uptime requirements.

The principal margin drivers typically include (1) aftermarket mix and service execution, (2) manufacturing throughput and cost control, (3) pricing discipline during demand cycles, and (4) working-capital discipline tied to build rates and supplier lead times. Equipment gross margin tends to swing more with volumes and input costs, while aftermarket supports steadier profitability when fleets remain in operation.

🧠 Competitive Advantages & Market Positioning

Terex’s moat is best characterized as customer stickiness via switching costs plus installed-base leverage.

  • Switching costs / operational qualification: Equipment is selected for safety performance, duty-cycle match, operator familiarity, maintenance practices, and availability of compatible parts. Once a customer (or rental fleet) has standardized around a platform, changing suppliers can create downtime, retraining needs, and logistics frictions.
  • Aftermarket breadth: A wide installed base makes parts availability and service response time valuable. Competitors can sell new units, but displacing a servicing footprint is harder when customers rely on established maintenance workflows.
  • Application engineering depth: Many Terex products are configured to specific job requirements, supporting differentiation beyond price.

Competitive benchmarking: Terex competes across segments with:

  • Oshkosh / JLG in aerial work platforms and access solutions (strong brand and rental penetration).
  • Haulotte in access platforms (focused product offering with regional strengths).
  • Manitowoc (Grove) and other large lifting OEMs in cranes and lifting systems.

Industry focus contrast: While large OEMs may span broader construction categories or concentrate in specific product families, Terex’s competitive positioning centers on a diversified portfolio across construction-related equipment and access/lifting applications, with an aftermarket engine that reinforces customer retention. In practice, Terex competes not only on unit economics but on lifecycle support—where the installed base and service capability can matter as much as the original purchase.

🚀 Multi-Year Growth Drivers

Over a 5–10 year horizon, Terex’s opportunity set is driven by structural demand for productive equipment and the installed-base economics of maintenance and upgrades:

  • Infrastructure and rebuilding demand: Replacement and expansion cycles in roads, bridges, utilities, and industrial facilities support steady fleet replenishment.
  • Uptime and rental economics: Jobsite utilization trends favor equipment models that maximize operational availability—supporting demand from rental fleets and service-oriented customers.
  • Electrification and emissions compliance: Regulatory tightening and customer preference shifts require equipment upgrades (powertrain and controls). This can expand aftermarket opportunities through retrofit/upgrade pathways and drive new-equipment cycles.
  • Higher automation and safety requirements: Features that improve operator safety and operational consistency can become qualification barriers, benefiting OEMs with tested, compliance-ready product platforms.

TAM expansion is therefore not only about unit volume; it also comes from growth in equipment “lifecycle value” through parts, service, and productivity-enhancing upgrades tied to a large installed base.

⚠ Risk Factors to Monitor

  • End-market cyclicality: Construction and industrial equipment demand typically tracks discretionary capital spending and commodity/industrial activity.
  • Input cost and supply-chain volatility: Steel, castings, electronics/control components, and logistics costs can pressure margins if pricing and procurement do not offset changes.
  • Customer credit and fleet financing conditions: Dealer, rental, and end-customer credit quality can influence order timing and residual value assumptions.
  • Competitive intensity and pricing pressure: OEMs in equipment categories can trade market share via promotions or price concessions during softer demand periods.
  • Technology and regulatory execution risk: Electrification, emissions standards, and safety requirements require ongoing R&D and manufacturing adaptation; execution issues can impact costs and product acceptance.

📊 Valuation & Market View

In industrial equipment, valuation typically reflects cyclicality and the durability of cash generation rather than purely asset growth. Market participants often anchor on:

  • EV/EBITDA for forward earnings power and normalization potential.
  • EV/Revenue as a cross-check, with emphasis on how much of revenue is expected to convert into durable operating cash flow.
  • Aftermarket contribution and service margins: Higher aftermarket mix and stable service performance tend to reduce downside volatility and improve quality of earnings.
  • Working-capital and cash conversion: Industrial OEM valuations commonly respond strongly to changes in receivables/inventory dynamics and capex intensity.

Key valuation “drivers” typically include confidence in order intake translating into sustainable margins, the resilience of aftermarket/service revenue, and the ability to manage costs through the equipment cycle.

🔍 Investment Takeaway

Terex is a diversified industrial equipment OEM with a meaningful installed-base component. The long-term thesis centers on switching costs created by fleet standardization and lifecycle support, reinforced by a credible aftermarket services engine. While equipment demand remains cyclical, the business model’s structure supports a more resilient profit profile when service and parts contributions hold up through varying end-market conditions.


⚠ AI-generated — informational only. Validate using filings before investing.
📰 Market News & Coverage

15 Stories Available

Real-time institutional reporting and market updates for TEX.

marketbeat.com2026-07-31

Terex Q2 Earnings Call Highlights

Terex NYSE: TEX reported second-quarter revenue of $2.24 billion and raised its full-year outlook, citing growth across all four segments, stronger bookings, backlog coverage and progress integrating REV Group.

seekingalpha.com2026-07-30

Terex Corporation (TEX) Q2 2026 Earnings Call Transcript

Terex Corporation (TEX) Q2 2026 Earnings Call Transcript

zacks.com2026-07-30

Terex (TEX) Q2 Earnings: How Key Metrics Compare to Wall Street Estimates

Although the revenue and EPS for Terex (TEX) give a sense of how its business performed in the quarter ended June 2026, it might be worth considering how some key metrics compare with Wall Street estimates and the year-ago numbers.

zacks.com2026-07-30

Terex (TEX) Beats Q2 Earnings and Revenue Estimates

Terex (TEX) came out with quarterly earnings of $1.37 per share, beating the Zacks Consensus Estimate of $1.25 per share. This compares to earnings of $1.49 per share a year ago.

prnewswire.com2026-07-30

Terex Reports Second Quarter 2026 Results

Sales of $2.2 billion, up 50.5% on a reported basis, pro forma sales up 8.5% Net income of $110 million, adjusted1net income of $156 million Adjusted1 EBITDA7 of $269 million or 12.0% margin EPS of $0.96 and adjusted1 EPS2 of $1.37 Bookings of $2.0 billion increased 25.2% year over year on a pro forma13 basis Raising 2026 Outlook5: Sales of $7.9 to $8.2 billion and Adjusted1 EBITDA7 of $960 million to $1.0 billion, with a 12.2% Adjusted1 EBITDA7 margin at the midpoint NORWALK, Conn., July 30, 2026 /PRNewswire/ -- Terex Corporation (NYSE: TEX), a global leader in specialized equipment, serving essential sectors such as emergency services, waste and recycling, utilities, and construction, today announced its results for the second quarter 2026.

zacks.com2026-07-23

Terex (TEX) Expected to Beat Earnings Estimates: What to Know Ahead of Q2 Release

Terex (TEX) possesses the right combination of the two key ingredients for a likely earnings beat in its upcoming report. Get prepared with the key expectations.

prnewswire.com2026-07-20

Terex Announces Second Quarter 2026 Financial Results Conference Call

NORWALK, Conn., July 20, 2026 /PRNewswire/ -- Terex Corporation (NYSE: TEX) will host a conference call to review its second quarter 2026 financial results on Thursday, July 30, 2026 at 8:30 a.m.

newsfilecorp.com2026-07-07

Video - CEO Clips: Targa Exploration: Advancing Gold Discoveries in Quebec and Argentina

Vancouver, British Columbia--(Newsfile Corp. - July 7, 2026) - Targa Exploration (CSE: TEX) (OTCQB: TRGEF) is advancing a portfolio of early-stage gold projects in Quebec and Argentina. Following a recent discovery in northern Quebec and active drilling in Santa Cruz, the company continues to pursue discovery-driven growth through a diversified exploration pipeline.

zacks.com2026-07-07

TEX vs. CAT: Which Stock Is the Better Value Option?

Investors looking for stocks in the Manufacturing - Construction and Mining sector might want to consider either Terex (TEX) or Caterpillar (CAT). But which of these two stocks offers value investors a better bang for their buck right now?

prnewswire.com2026-07-02

Terex Announces Quarterly Dividend

NORWALK, Conn., July 2, 2026 /PRNewswire/ -- Terex Corporation (NYSE: TEX) announced that its Board of Directors declared a quarterly dividend of $0.17 per share.

zacks.com2026-06-29

3 Construction & Mining Equipment Stocks Braving Industry Headwinds

The Zacks Industry Rank for the Manufacturing - Construction and Mining industry paints a dull picture. We believe that stocks like CAT, TEX and HY are still worth a look.

gurufocus.com2026-06-25

Terex Corp (TEX) Stock Up 6.4% but GF Value Says Overvalued -- GF Score: 90/100

On June 25, 2026, Terex Corp (TEX) shares rose 6.4% to a current price of $74.58. This comes amid a strong performance over the past year, with the stock having

gurufocus.com2026-06-22

A Look at Terex Corp (TEX) After 3.2% Gain -- GF Value $58.06 vs Price $68.94

On June 22, 2026, Terex Corp (TEX) shares rose 3.2% to a current price of $68.94. This recent uptick comes amidst a notable price performance, with the stock ra

zacks.com2026-06-03

Is the Options Market Predicting a Spike in Terex Stock?

Investors need to pay close attention to TEX stock based on the movements in the options market lately.

gurufocus.com2026-06-02

A Look at Terex Corp (TEX) After 5.3% Gain -- GF Value $58.01 vs Price $61.32

On June 02, 2026, Terex Corp (TEX) shares rose 5.3% today, closing at $61.32. The stock has experienced a 52-week range of $41.70 to $71.50, reflecting signific

📊 AI Financial Analysis

Powered by StockMarketInfo
Earnings Data: Q Ending 2026-06-30

"TEX reported Q2’26 revenue of $2.238B and net income of $110M (EPS $113.6 / diluted $114.2). Versus Q2’25, revenue rose from $1.487B to $2.238B (+50.5% YoY) and net income increased from $72M to $110M (+52.8% YoY). QoQ, revenue grew from $1.734B (Q1’26) to $2.238B (+29.1%), while net income swung from -$89M (loss in Q1’26) to $110M (+$199M QoQ). Profitability improved sharply: gross margin expanded to ~19.8% in Q2’26 from ~11.9% in Q1’26 and ~19.6% in Q2’25; net profit margin improved to ~4.9% from ~-5.1% QoQ and ~4.8% YoY. Operating income turned positive ($187M) after a large operating loss in Q1’26. Cash flow strengthened. Operating cash flow was $128M and free cash flow ~$95M, following -$31M operating cash flow and -$57M free cash flow in Q1’26. The balance sheet shows major deleveraging in net debt: net debt improved to -$403M (net cash) from $2.357B in Q1’26, while total assets rose to $10.34B. Shareholder returns appear strong: the stock is up 78.4% over the last year, indicating strong total shareholder return momentum alongside a modest implied payout profile (dividends paid $19M in the quarter)."

Revenue Growth

Strong

Revenue accelerated to $2.238B in Q2’26 (+29.1% QoQ, +50.5% YoY vs Q2’25). Clear upward trajectory compared with a lower Q1’26 base.

Profitability

Good

Net income swung from -$89M in Q1’26 to +$110M in Q2’26 (+199M QoQ) and grew +52.8% YoY. Margins improved materially QoQ (gross margin ~19.8% vs ~11.9%; net margin ~4.9% vs ~-5.1%).

Cash Flow Quality

Positive

Operating cash flow was $128M and free cash flow ~$95M in Q2’26, a sharp rebound from Q1’26 (-$31M OCF, -$57M FCF). Dividends paid were $19M; buybacks reported as $0 this quarter.

Leverage & Balance Sheet

Positive

Total assets increased to $10.34B. Net debt turned strongly negative (net cash of -$403M) versus $2.36B net debt in Q1’26, indicating improved balance-sheet resilience.

Shareholder Returns

Strong

Price appreciation is very strong (+78.4% 1Y). With no large buyback in the quarter and small dividends, the momentum is doing most of the work for total shareholder return.

Analyst Sentiment & Valuation

Fair

Current price $60.82 is below consensus target $84.71 (upside implied), with a high dispersion (target range 70–100). Valuation appears supportive, but the large EPS figure vs reported margins suggests caution in interpreting per-share metrics.

Disclaimer:This analysis is AI-generated for informational purposes only. Accuracy is not guaranteed and this does not constitute financial advice.

Fundamentals Overview

Loading fundamentals overview...

Terex delivered a strong Q1 start driven by REV integration (closed Feb 2), strong execution in Materials Processing (EBITDA margin +310 bps to 15%), and a meaningful Specialty Vehicles contribution (+20% pro forma sales; EBITDA margin +160 bps to 14.2%). Despite tariff-driven pressure on Q1 EBITA margin (-50 bps YoY), management reported EPS of $0.98 (+18%) supported by a normalized tax rate and a ~$0.10 one-time tax benefit. Backlog grew to $7.1B with forward visibility centered in MP, Aerials, and Terex Utilities. The company reaffirmed full-year 2026 guidance rather than raising it, framing the decision as discipline and timing amid macro/tariff uncertainty, not deteriorating fundamentals. For margin confidence, management asserted tariffs are “negligible” sequentially for Aerials/ES due to offsetting policy mechanics (232 vs IEEPA). Key operational levers include REV synergy delivery (~$28M in 2026 toward $75M run-rate) and capacity/throughput investments to reduce lead times while improving working capital.

AI IconGrowth Catalysts

  • Specialty Vehicles: +20% pro forma sales growth; increased price realization and higher unit deliveries (partly weather-related timing); EBITDA margin +160 bps to 14.2%
  • Terex Utilities ramp-up: Utilities positioned as fastest-growing business in Q1; ramping production to meet strong demand for bucket trucks, digger derricks and related products/services
  • Materials Processing (MP): pro forma sales +12% (excluding FX); MP EBITDA margin expanded to 15% (+310 bps) driven by higher volume, efficiency improvements, and pricing actions
  • Aerials: strong bookings momentum and backlog coverage (6 of 9 months covered); management expects price/cost favorable for the rest of 2026 and cyclical recovery after Q1
  • Environmental Solutions (ES) and ESG: expectation of 2026 demand skewing to 2H including prebuys ahead of 2027 EPA changes; growth supported by digital/aftermarket and productivity improvements

Business Development

  • REV integration (closed Feb 2, 2026): 8–9 work streams integrated; synergy pipeline includes both overhead and operational/supply-chain synergies
  • Fire & Emergency Trade Show (Indianapolis): 3rd Eye AI-based situational awareness solution showcased; applications expanded beyond utilities and cement mixers to fire & emergency vehicles
  • Apptronik partnership: prototype zero gravity arm co-developed with Apptronik and Genie; partnership referenced as being active with ongoing technology pipeline

AI IconFinancial Highlights

  • Reported Q1 sales: $1.7B, up $505M (+41%) vs prior year, driven by REV merger and growth across legacy segments
  • Pro forma Q1 sales growth: +10.8% (led by Specialty Vehicles +20% and strong growth in Materials Processing and Terex Utilities)
  • Q1 EBITA margin: 9.9%, down 50 bps YoY, primarily due to tariffs not in prior-year period; partially offset by improved performance in MP and Specialty Vehicles
  • Q1 EPS: $0.98 (+18% YoY); included ~$0.10 of one-time tax benefit vs the 2026 expected full-year normalized tax rate of 21%; normalized tax rate referenced
  • Free cash outflow in Q1: -$57M, consistent with Q1 last year
  • Net working capital as % of sales: 16.7% vs 26% YoY (improved working capital profile, less seasonality particularly in newer businesses like Specialty Vehicles)
  • Quarter ending backlog: $7.1B, including strong bookings trends in Materials Processing, Aerials, and Terex Utilities

AI IconCapital Funding

  • Net leverage ratio reduced to 2.4x (discipline on capital structure; no explicit buyback amount disclosed in transcript)
  • Guidance assumes average debt outstanding ~ $2.7B for interest/other expense outlook

AI IconStrategy & Ops

  • REV integration: playbook aligned to prior ESG integration; synergies above target; all work streams at or ahead of schedule
  • Synergy targets: ~$28M in 2026 by eliminating duplicate overhead; $75M run rate within 24-month target
  • Automation/digital: 3rd Eye AI solution expanded to additional vehicle classes; utility vehicles, cement mixers, and added scope for fire & emergency vehicles
  • Capacity investments: ladder trucks capacity +35% at Ocala, Florida; S-180 pumper capacity expansion in South Dakota; claimed ability to reduce lead times and deliver S-180 pumpers in ~9 months
  • Working capital/process: newer Specialty Vehicles businesses cited as having more favorable working capital and reduced seasonality

AI IconMarket Outlook

  • Reaffirmed 2026 outlook (provided in February): pro forma sales growth ~ +5% to $7.5B–$8.1B
  • 2026 pro forma EBITDA: +$100M (+12%) to ~$930M–$1.0B; 12.4% margin at midpoint
  • 2026 EPS: $4.50–$5.00; full-year effective tax rate expected 21%
  • Share count modeling: Q2–Q4 approx. 115M shares; ~25% of full-year EPS expected in Q2 (profitability improving in Aerials and ES in 2H)
  • 2026 free cash conversion: 80%–90% of net income
  • Segment outlook: ES mid-single-digit growth with margin improvement in 2H; Utilities ramping at Waukesha and Birmingham installed facilities; MP high single-digit pro forma segment growth; Aerials 2026 sales/margin similar to 2025 with sequential improvement in Q2–Q3 and price/cost neutral full year

AI IconRisks & Headwinds

  • Tariff uncertainty: Q1 EBITA margin down 50 bps YoY primarily driven by tariffs in the period vs prior year; management later characterized incremental tariff headwind as negligible for ES and Aerials for the remainder of 2026
  • Potential inbound freight inflation risk: stated risk is higher inbound freight for certain international routes
  • Booking lumpiness/seasonality: ES and Specialty Vehicles bookings can be lumpy due to timing; Aerials expected seasonality-driven EBITDA breakeven in Q1
  • Oil-price sensitivity in Europe/Australia for MP improvements (acknowledged as potential headwind)

Q&A: Analyst Interest

  • Full-year guidance unchanged despite strong Q1: Management said reaffirmation was discipline/timing, not a change in fundamentals. They cited only 1 quarter of data, ongoing macro/tariff uncertainty, and that February guidance already assumed solid growth/margin expansion and synergy realization with more time to confirm conversion/volume flow.
  • Tariff impact and margin confidence (Aerials price/cost): Management highlighted “no additional sequential headwind” because the 232 calculation change was largely offset by IEEPA going away. They pointed to 6 months of Aerials backlog and favorable customer mix/margin profile already embedded, supporting price/cost favorability for the remainder.
  • Materials Processing demand vs dealer restock: Management said it is “a little bit of both,” with end-user demand picking up in the U.S. and dealers replenishing due to better sentiment and mega-project tailwinds. They emphasized bookings are largely triggered by RPO conversions and cited returning RPO momentum.

Sentiment: MIXED

Note: This summary was synthesized by AI from the TEX Q1 2026 earnings transcript. Financial data is complex; please verify all metrics against official SEC filings before making investment decisions.

📋 Official Regulatory 10-K / 10-Q SEC Filings

Direct authenticated documentation links to audited SEC database reports for TEX.

SEC EDGAR Live Feed
Loading financial data and tables...
📁

SEC Filings (TEX)

© 2026 Stock Market Info — Terex Corporation (TEX) Financial Profile