📘 MAMMOTH ENERGY SERVICES INC (TUSK) — Investment Overview
🧩 Business Model Overview
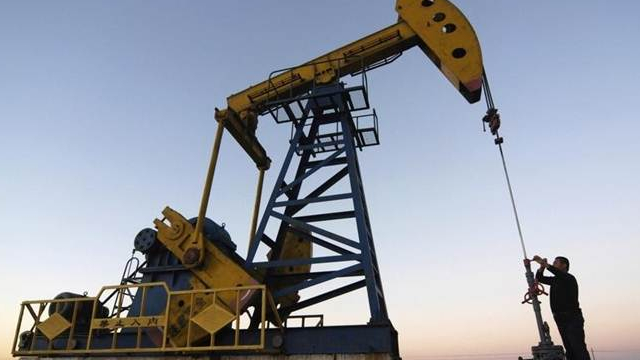
Mammoth Energy Services operates in the North American oil & gas services value chain, providing field-deployed services that support well development and production operations. The economic engine is utilization of people and equipment in customer-specific execution windows (job scheduling, mobilization, and on-site throughput), with pricing tied to basin activity levels and service intensity per completed or serviced well.
Customer stickiness is built through operational readiness and reliability: recurring access to crews, consistent safety performance, disciplined execution, and the practical advantage of being positioned near active well locations. In this model, switching vendors is not frictionless because it requires re-mobilization, retraining, and re-establishing operational confidence under tight time constraints at the wellsite.
💰 Revenue Streams & Monetisation Model
Revenue is primarily driven by transactional, job-based contracts tied to drilling/completion and production-related workflows. Monetisation tends to follow two levers:
- Volume & utilization: higher basin activity increases the number of jobs and improves equipment/crew utilization.
- Price and operational efficiency: effective scheduling, fleet management, and execution quality influence incremental margins and reduce downtime and rework.
Profitability is most sensitive to (1) utilization, (2) labor and equipment operating cost discipline, and (3) mobilization economics—how quickly assets can be deployed and kept working across customer sites without idle time.
🧠 Competitive Advantages & Market Positioning
Mammoth’s structural moat is best characterized as a combination of logistical/operational infrastructure advantages and practical switching costs, rather than proprietary technology.
- Logistical infrastructure (geographic execution advantage): being positioned to serve active shale geographies reduces mobilization friction and supports tighter turnaround times, which matters in completion and production cycles.
- Switching costs via execution track record: customers rely on established safety processes, job planning familiarity, and proven execution under field constraints. That increases vendor inertia even when alternative bids appear.
- Scale in crews and equipment planning: the ability to staff and schedule efficiently improves utilization and lowers unit costs during variable activity.
Competitive benchmarking (examples):
- Halliburton and Schlumberger (major integrated service providers): broad portfolios across multiple service lines and geographies; they compete on bundled offerings and scale.
- Patterson-UTI and ProFrac (specialized US-focused providers): deeper specialization and competitive pricing in specific well development segments.
Compared with these rivals, Mammoth’s market position is more dependent on field execution and logistics efficiency in the service categories where it operates, rather than on global technological platforms. The competitive focus is therefore on delivering dependable execution at competitive effective unit economics.
🚀 Multi-Year Growth Drivers
Over a 5–10 year horizon, growth is anchored less in unit share gains from technology and more in secular demand for well services aligned with unconventional resource development, production optimization, and ongoing maintenance activity. Key drivers include:
- Continued development in North American basins: even with cycle volatility, the industry requires continuous well build and ongoing workovers to sustain production profiles.
- Capital efficiency and service intensity: operators increasingly manage projects to reduce downtime and improve throughput, supporting demand for reliable service providers that can perform under schedule pressure.
- Operational consolidation among providers: customers tend to reward vendors with consistent safety and execution outcomes, which can create durable share capture when paired with disciplined cost management.
- Contracting and readiness improvements: demonstrated performance can translate into preferred vendor status for certain geographies or operating areas.
⚠ Risk Factors to Monitor
- Commodity and activity cycle sensitivity: utilization and pricing move with industry drilling/completion intensity; downcycles can compress margins and increase working-capital pressure.
- Cost inflation in labor and equipment: industry-wide wage and parts/equipment costs can outpace pricing, especially when activity re-accelerates.
- Customer concentration and contract terms: changes in operator spending priorities, contract structure, or payment terms can affect cash flow durability.
- Operational and safety risk: field services are exposed to incident risk, downtime, and regulatory scrutiny—any sustained operational issues can impair customer retention.
- Capital intensity and balance-sheet leverage: if maintaining capacity requires incremental investment during downcycles, leverage and refinancing risk can rise.
📊 Valuation & Market View
In oil & gas services, market valuation typically tracks enterprise value versus earnings power (often discussed using EV/EBITDA or EV/EBITDAX frameworks) and is heavily influenced by expected utilization, margin trajectory, and free cash flow conversion across the cycle.
Key “needle movers” generally include:
- Normalization assumptions for utilization and pricing (ability to sustain margin through variable activity)
- Unit cost discipline (labor productivity, maintenance, and downtime reduction)
- Capital allocation and balance-sheet resilience (keeping capacity without overextending during weaker demand)
Because earnings are cyclical, investors often focus on quality of cash flow and the durability of operating leverage rather than on point-in-time earnings metrics.
🔍 Investment Takeaway
Mammoth Energy Services’ long-term investment case rests on an execution- and logistics-driven competitive position in North American oilfield services, supported by switching costs tied to operational reliability and by practical geographic execution advantages. The primary challenge remains industry cyclicality; the core upside case is continued market share retention through dependable field performance and disciplined unit-cost management, enabling improved earnings resilience across drilling and production cycles.
⚠ AI-generated — informational only. Validate using filings before investing.