Uber Technologies, Inc.

Uber Technologies, Inc. (UBER) Market Cap

Uber Technologies, Inc. has a market capitalization of .

No quote data available.

CEO: Dara Khosrowshahi

Sector: Technology

Industry: Software - Application

IPO Date: 2019-05-10

Website: https://www.uber.com

Uber Technologies, Inc. (UBER) - Company Information

Market Cap: -|Sector: Technology

Company Profile

Uber Technologies, Inc. develops and operates proprietary technology applications in the United States, Canada, Latin America, Europe, the Middle East, Africa, and the Asia Pacific. It connects consumers with independent providers of ride services for ridesharing services; and connects riders and other consumers with restaurants, grocers, and other stores with delivery service providers for meal preparation, grocery, and other delivery services. The company operates through three segments: Mobility, Delivery, and Freight. The Mobility segment provides products that connect consumers with mobility drivers who provide rides in a range of vehicles, such as cars, auto rickshaws, motorbikes, minibuses, or taxis. It also offers financial partnerships, transit, and vehicle solutions offerings. The Delivery segment allows consumers to search for and discover local restaurants, order a meal, and either pick-up at the restaurant or have the meal delivered; and offers grocery, alcohol, and convenience store delivery, as well as select other goods. The Freight segment connects carriers with shippers on the company's platform and enable carriers upfront, transparent pricing, and the ability to book a shipment, as well as transportation management and other logistics services offerings. The company was formerly known as Ubercab, Inc. and changed its name to Uber Technologies, Inc. in February 2011. Uber Technologies, Inc. was founded in 2009 and is headquartered in San Francisco, California.

Analyst Sentiment

82%
Strong Buy

From 51 Active Polls

1Y Forecast: $101.30

▲ +0.0% Potential Upside

Consensus Target Metrics

Low Bound

$72

Median

$105

High Bound

$125

Average

$101

Price & Moving Averages

Loading chart...

🎯 Wall Street Analyst Intelligence Report

1-Year structural target targets, chart projections, and sentiment maps.

Average 1Y Target
$101.30
▲ +43.26% Upside
Low Target
$72.00
2% Risk
Median Target
$105.00
48% Mid
High Target
$125.00
77% Max

Consensus Trend Projection

Trailing closures vs. 12-month metrics map.

Analyst Vote Distribution

Aggregate institutional coverage sentiment weights.

Sentiment volume allocation data unavailable.

Historical valuation matrix unavailable.

📘 Full Research Report

ℹ️

AI-Generated Research: This report is for informational purposes only.

📘 UBER TECHNOLOGIES INC (UBER) — Investment Overview

🧩 Business Model Overview

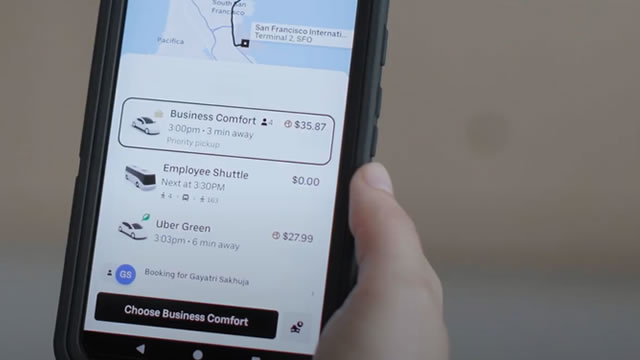
UBER operates a two-sided marketplace connecting riders (demand) with drivers and delivery partners (supply), while also offering ancillary services that deepen engagement. The platform matches users to nearby providers using pricing, routing, and demand-supply balancing tools, enabling rapid fulfillment in dense geographies. Monetisation is driven by a platform “take rate” applied to transactions and by subscription and advertising-style services that sit on top of core mobility and delivery usage.

Customer stickiness is supported less by formal lock-in and more by reliability at the local level: frequent users build comfort with the booking experience, the app’s payment and account setup, and the historical context of service in their area—factors that raise the cost of switching to a less reliable alternative where supply availability is weaker.

💰 Revenue Streams & Monetisation Model

UBER’s revenue is primarily derived from:

  • Mobility transactions: revenue tied to rides completed via marketplace and related services (e.g., premium offerings, driver incentives and marketplace facilitation).
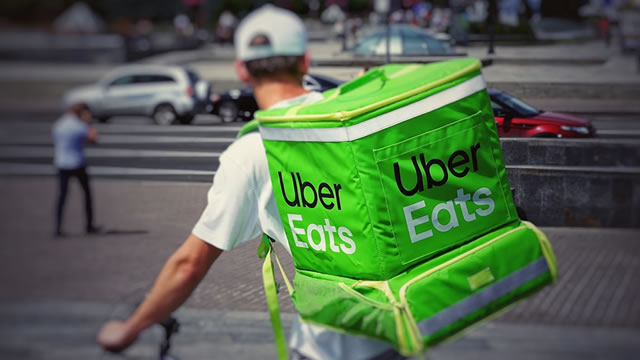
  • Delivery transactions: revenue tied to food and other last-mile deliveries, typically monetized via marketplace fees and service components.
  • Subscription offerings (e.g., membership-style benefits): recurring revenue that can improve retention and smooth demand by subsidizing convenience and pricing.
  • Freight/logistics and other services: monetization from matching capacity and facilitating B2B or specialized fulfillment (where applicable).

Margin structure is shaped by a few recurring drivers: (1) take rate and pricing discipline, (2) platform operating leverage as transaction volumes scale, (3) incentive intensity needed to balance supply and demand, and (4) regulatory and compliance costs that can pressure unit economics. Because the model is largely asset-light on the supply side, operating costs tend to scale more with platform infrastructure than with driver asset ownership.

🧠 Competitive Advantages & Market Positioning

UBER’s competitive position rests on a combination of network effects and marketplace density advantages, with supporting elements of data-driven matching that improve service quality (faster matching, better routing, and more predictable supply availability).

  • Network effects (two-sided): higher rider demand attracts more drivers/partners, which improves fulfillment availability and reduces wait times, which in turn attracts more riders.
  • Operational density: scale in specific cities strengthens the ability to maintain supply during peak demand and to re-balance across demand patterns.
  • Data and matching advantages: long-running transaction history supports better demand forecasting, pricing/promotion effectiveness, and route optimization—raising the cost for challengers to replicate service quality quickly.
  • Switching costs (practical, not contractual): riders benefit from account/payment setup, service history, and app-based convenience; drivers also develop routines and earning predictability tied to local marketplace dynamics. This creates friction against low-quality alternatives, particularly where UBER’s supply availability is strong.

Competitive benchmarking:

  • Lyft (mobility-centric peer in the U.S.): focuses primarily on ride-hailing and competes on local supply and pricing. UBER’s broader multi-category footprint (mobility plus delivery and additional services) can support higher engagement and cross-usage benefits.
  • DoorDash (delivery-focused peer): strong position in consumer delivery. Its moat is tightly linked to local delivery partner density and restaurant network relationships; UBER competes by leveraging a rides-and-delivery platform approach and city-level logistics capabilities.
  • Didi (ride-hailing peer in multiple markets historically): illustrates the competitive pressure a large incumbent can bring to ride-hailing platforms. UBER’s emphasis on building dense, multi-category marketplaces contrasts with more single-category or regionally constrained approaches.

Overall, UBER’s “moat” is harder to copy than a feature because meaningful marketplace quality depends on achieving critical mass of both sides and building execution expertise in dynamic, regulated environments. While switching remains feasible, competitors must overcome both density hurdles and execution depth to sustain share gains.

🚀 Multi-Year Growth Drivers

A 5–10 year horizon investment case is supported by structural drivers that expand the total number of transactions and improve platform economics:

  • Urban mobility demand: long-run shift toward on-demand services in large and growing cities, supported by convenience relative to private vehicle ownership and traditional taxi models.
  • Expansion of last-mile delivery: growth in consumer and local commerce increases delivery frequency and the addressable universe of “small fulfillment” needs.
  • More frequent and diversified usage: multi-category engagement (rides, delivery, and logistics offerings) can increase retention and reduce churn by embedding the app in daily routines.
  • Take-rate and margin optimization: disciplined pricing, improved matching efficiency, and evolving product mix can raise monetisation per transaction without proportional increases in cost.
  • Geographic penetration and deepening: market entry and scaling in additional cities improves network density, which can unlock operating leverage as fixed platform costs are spread across a larger volume base.
  • Platform tooling for capacity balancing: ongoing improvements in dynamic allocation, routing, and demand forecasting enhance service reliability, which can support customer satisfaction and supply participation.

⚠ Risk Factors to Monitor

  • Regulatory and labor classification risk: rules governing driver status, benefits, minimum standards, and inspection requirements can increase compliance costs and alter incentive structures that support supply.
  • Competition and take-rate compression: intensified promotional activity or differentiated product offerings by rivals can pressure marketplace fees and unit economics.
  • Disruption from alternative transportation and automation: autonomous mobility, alternative ride models, or major shifts in consumer behavior could reduce transaction intensity or alter cost structures.
  • Fraud, safety, and trust costs: maintaining safety systems, background checks, and dispute handling requires continuous investment; incidents can drive regulatory attention and reputational risk.
  • Adverse macro conditions: reductions in travel frequency or consumer discretionary spending can impact demand and revenue per active user.
  • Operational execution risk: dense-market performance depends on reliable supply availability; breakdowns in matching quality can harm retention and increase customer support costs.

📊 Valuation & Market View

Equity markets typically value UBER and similar platform businesses using a combination of EV/Revenue and EV/EBITDA-style frameworks, with emphasis on underlying unit economics rather than accounting earnings quality alone. Key valuation drivers include:

  • Transaction growth (mobility and delivery volume) and the durability of engagement metrics.
  • Take rate trajectory, influenced by pricing power, mix (premium products, categories), and competitive intensity.
  • Contribution margin and operating leverage, driven by scale in platform infrastructure and reduced incentive intensity.
  • Regulatory overhang, particularly labor-related cost pressure and compliance requirements.
  • Capital intensity and reinvestment needs for marketplace safety, technology, and expansion.

In this sector, the market generally pays for credible pathways to sustainable margins and durable growth in active usage, tempered by the probability of structural regulatory or competitive changes.

🔍 Investment Takeaway

UBER’s long-term investment case is anchored in a scalable two-sided marketplace with network effects and density advantages that improve matching reliability and retention. The platform’s practical switching friction, combined with ongoing improvements in operational tooling, makes share gains difficult to sustain for challengers without parallel scale. The principal debate centers on regulation, competitive pricing dynamics, and the sustainability of take-rate and incentive intensity across cycles.


⚠ AI-generated — informational only. Validate using filings before investing.

📊 AI Financial Analysis

Powered by StockMarketInfo
Earnings Data: Q Ending 2026-03-31

"UBER reported Q1’26 Revenue of $13.203B (QoQ -8.1%, YoY +14.4%). Net Income was $263M (QoQ -11.1%; YoY -85.2%), and diluted EPS was $0.13. Margins were pressured sequentially: gross margin fell to 45.0% from 39.6% in Q4’25, but operating margin declined to 14.6% from 12.3% in Q4 and net margin eased to 2.0% from 2.1%. Over the last four quarters, profitability looks less stable than revenue: YoY, revenue growth remains solid while net income drops sharply—consistent with earnings volatility in the near term. Cash flow quality remains supportive at the earnings level: operating cash flow was $2.351B and free cash flow was $2.286B in Q1’26, even with continued aggressive buybacks (repurchases of $3.011B, partially funded by drawdown/financial flows). The balance sheet shows resilience with $6.781B of cash & short-term investments and net debt of -$4.528B (net cash), and equity is lower than Q4’25 but still sizable. Total shareholder returns are mixed: with the stock at $77.12 and only +5.56% over 1 year, there is no strong >20% 1Y momentum tailwind. No dividends are paid. Analyst valuation signals are modest: consensus target ($103.42) implies upside versus current price."

Revenue Growth

Good

Q1’26 revenue was $13.203B, up YoY +14.4% (vs $11.533B in Q1’25) but down QoQ -8.1% (vs $14.366B in Q4’25), indicating growth but some sequential cooling.

Profitability

Caution

Net income declined sharply YoY (-85.2%) and fell QoQ (-11.1%). Despite higher gross margin in Q1’26 (45.0%), net margin compressed to 2.0% from 2.1% in Q4’25, suggesting earnings volatility.

Cash Flow Quality

Positive

Operating cash flow was $2.351B and free cash flow $2.286B in Q1’26. The company is generating cash while continuing large repurchases ($3.011B), with no dividends to pressure cash.

Leverage & Balance Sheet

Good

Net debt is -$4.528B (net cash) with $6.781B cash & short-term investments. Total assets were $59.885B, and equity remains strong at $24.751B, supporting balance-sheet resilience.

Shareholder Returns

Fair

No dividend yield (0%). Buybacks were significant, but market momentum is modest: 1Y stock performance is only +5.56%, with no >20% momentum boost.

Analyst Sentiment & Valuation

Neutral

Consensus price target is $103.42 vs $77.12 current, suggesting meaningful upside. However, valuation multiple metrics look demanding (e.g., high P/E), and earnings are volatile.

Disclaimer:This analysis is AI-generated for informational purposes only. Accuracy is not guaranteed and this does not constitute financial advice.

Fundamentals Overview

Loading fundamentals overview...

UBER’s Q1 2026 performance was framed as durable, audience-led bookings growth with strong profitability: gross bookings rose 21% YoY and non-GAAP EPS rose 44% YoY, attributed to operating leverage and disciplined costs. The key near-term swing factor is U.S. Mobility insurance: management expects hundreds of millions in savings in 2026 and believes California trip growth is improving, with LA specifically cited as showing better trends. On product, GO-GET centered on converting on-demand behavior into planned travel via Uber Reserve, then scaling into hotels through an Expedia relationship (700k hotels) funded by Uber One credits/discounts. Uber One momentum is material—50M members, 50% YoY growth, and over half of bookings—with benefits expanding globally. For AV, management remains constructive but emphasizes scaling constraints: more cars, safety validation, and prolonged local regulator dialogue. Competition persists in Delivery (DoorDash/Prosus in Europe), but management highlighted improving global Delivery position and sparse-market playbooks.

AI IconGrowth Catalysts

  • Mobility gross bookings +20% with record margins, plus U.S. acceleration momentum for the rest of 2026
  • Delivery gross bookings +23% led by grocery and retail; grocery/retail retention supports margin-positive growth
  • Freight returned to growth for the first time in nearly 2 years
  • Uber Reserve demonstrating shift from on-demand to planned travel; Reserve growth rates exceed Mainline
  • Cross-platform engagement: cross-platform consumers growing 1.5x faster; Uber One drives higher spend and retention

Business Development

  • Expedia relationship for hotel inventory (700,000 hotels on Uber), with economics passed back to Uber One members via credits and discounted hotels
  • Hertz partnership for AV fleet management (financing/fleet ecosystem build-out)
  • Santander deal for AV financing ecosystem; framed around predictable per-vehicle trip revenue enabling capital-light financing
  • AV insurance ecosystem partnership references: Marsh and Apollo
  • Autonomous partner network expansion across Zoox, Nuro, NVIDIA, Zoox, Pony and WeRide plus Baidu (international); Waymo market activity referenced in Austin/Atlanta and larger city rollout
  • Competition/market dynamics tied to DoorDash and Prosus expansion in Europe

AI IconFinancial Highlights

  • Gross bookings +21% YoY; audience grew 17% with strong engagement (trip-driven growth)
  • Non-GAAP EPS +44% YoY, cited as more than twice bookings growth, driven by disciplined cost management and operating leverage
  • Top-line and profitability delivered at or above the high end of guidance (exact numeric guidance not included in transcript)
  • U.S. Mobility insurance: expects hundreds of millions of dollars in insurance savings in 2026 and first year since COVID with insurance cost-line leverage
  • Buybacks: record $3 billion returned to shareholders via repurchases in the quarter
  • Uber One reach: surpassed 50 million members; Uber One accounts for over 50% of bookings and is growing 50% YoY (retention and spend 3x higher vs non-members mentioned)

AI IconCapital Funding

  • Share repurchases: $3.0B returned to shareholders in the quarter (record buybacks)
  • No debt/cash runway figures explicitly stated in the provided transcript

AI IconStrategy & Ops

  • GO-GET event emphasis: transition from on-demand behaviors to planned services via Uber Reserve, then expansion into hotels using Expedia inventory and Uber One-funded credits
  • AI/agents as app entry-point layer: adaptive UI replacing fixed UI, enabling user-driven requests (e.g., “search for hotels,” “Uber to/from airport”) and cross-platform command flows
  • Concrete AI product examples: Cart Assistant (photo-to-cart), preselected/predicted destination cards (reported in ~3/4 of rides), and AI-assisted earnings guidance for earners
  • Engineering productivity: AI-driven throughput improvements (agents committing code; cited that ~10% of code commits are by agents) with human code review maintained

AI IconMarket Outlook

  • AV market: on track to be live in up to 15 cities by year-end (specific cities beyond SF/LA context not enumerated in transcript)
  • Trip growth in SF/LA: management expects acceleration through the rest of the year, tied to insurance-driven “good leverage” and expanding category position over last ~6 months
  • U.S. Mobility: confidence increased vs December/January; expects continued acceleration through balance of 2026

AI IconRisks & Headwinds

  • Insurance-driven elasticity depends on pricing improvements translating into demand; management claims elasticity is showing up, but this remains sensitive to rate and market conditions
  • AV scaling bottlenecks: need more cars on the road, safety case validation (safety driver then removal), and prolonged regulator dialogue (e.g., power outages, school zones, congestion, emergency response interactions)
  • Financing residual value uncertainty for AVs (residual value less clear vs conventional vehicles), increasing reliance on structured financing and predictable utilization assumptions
  • Competitive intensity: incremental delivery competition in Europe from DoorDash and Prosus expansion into the market
  • External backdrop: war/weather referenced as complex environment impacting demand and operating conditions

Q&A: Analyst Interest

  • GO-GET / on-demand to planned travel: Management said the behavioral shift started with Uber Reserve, built initially for airports, then expanded to arrivals/pickups. Reserve growth exceeds Mainline; Reserve margins and satisfaction are higher. Hotels were framed as the next planned travel step using Expedia inventory and Uber One credit pass-through.
  • Insurance savings in LA/SF and 2026 confidence: Management reiterated 2026 expects “hundreds of millions” of insurance savings plus March auto-renewal improvements and additional offloading of risk to third-party carriers. Uber links pricing improvements to elasticity and accelerating trip growth, noting LA trends improving more than the rest of California.
  • AV scaling bottlenecks and SF/LA trip drivers: Management said scaling to 15 cities depends mainly on having enough safe cars plus completing partner safety cases and regulatory dialogues on scenarios (power loss, school zones, emergency interaction, congestion, and labor impacts). For trips, they cited expanded category position over ~6 months and ongoing insurance-driven acceleration for the rest of 2026.

Sentiment: POSITIVE

Note: This summary was synthesized by AI from the UBER Q1 2026 earnings transcript. Financial data is complex; please verify all metrics against official SEC filings before making investment decisions.

Loading financial data and tables...
© 2026 Stock Market Info — Uber Technologies, Inc. (UBER) Financial Profile