Universal Health Realty Income Trust

Universal Health Realty Income Trust (UHT) Market Cap

Universal Health Realty Income Trust has a market capitalization of $571.7M.

Price: $41.20

0.82 (2.03%)

Market Cap: 571.67M

NYSE · time unavailable

CEO: Alan Miller

Sector: Real Estate

Industry: REIT - Healthcare Facilities

IPO Date: 1986-12-26

Website: https://www.uhrit.com

Universal Health Realty Income Trust (UHT) - Company Information

Market Cap: 571.67M|Sector: Real Estate

Company Profile

Universal Health Realty Income Trust, a real estate investment trust, invests in healthcare and human service related facilities including acute care hospitals, rehabilitation hospitals, sub-acute care facilities, medical/office buildings, free-standing emergency departments and childcare centers. We have investments in seventy-one properties located in twenty states, including two that are currently under construction.

Analyst Sentiment

50%
Hold

From 1 Active Polls

Consensus Target Matrix

Data feed parsing pending...

Price & Moving Averages

Loading chart...

🎯 Wall Street Analyst Intelligence Report

1-Year structural target targets, chart projections, and sentiment maps.

Average 1Y Target
$43.26
▲ +5.00% Upside
Low Target
$30.90
-25% Risk
Median Target
$42.02
2% Mid
High Target
$51.50
25% Max
Consensus
Hold
0 / 1 Buys

Consensus Trend Projection

Trailing closures vs. 12-month metrics map.

Analyst Vote Distribution

Aggregate institutional coverage sentiment weights.

📊 Historical Valuation Multiples

Real-time Trailing Twelve Month (TTM) momentum side-by-side with discrete quarterly metrics.

Fiscal QuarterTTMQ1 2026Q4 2025Q3 2025Q2 2025Q1 2025Q4 2024Q3 2024Q2 2024
Period EndingTrailing 12MMar 31, 2026Dec 31, 2025Sep 30, 2025Jun 30, 2025Mar 31, 2025Dec 31, 2024Sep 30, 2024Jun 30, 2024
Market Cap ($M)572560542541552566514632525
Enterprise Value ($M)9549429219219309388861,004893
Price to Earnings Ratio (P/E)31.9327.8931.3333.6930.7229.6027.5639.5124.88
Price/Earnings-to-Growth Ratio (PEG)0.1619.3123.5745.61
Price to Sales Ratio (P/S)3.8522.827.3321.3922.2023.0420.8525.7921.23
Price to Book Ratio (P/B)3.863.793.563.413.343.292.863.482.75
Price to Free Cash Flow Ratio (P/FCF)11.5746.8539.8653.0740.3448.7239.0763.8543.30
Enterprise Value to Sales (EV/Sales)38.4012.4636.3937.3938.2235.9540.9736.12
Enterprise Value to EBITDA (EV/EBITDA)14.8859.2065.5553.0955.3755.6151.7358.5749.32
Debt to Equity Ratio5.962.632.532.442.332.202.112.081.96

UHT Growth Runway Model

Standard long term linear growth fade

Multi-Stage Discounted Cash Flow Sandbox

Market Price$41.20
Intrinsic Value$41.13
Market Alignment
Overvalued by 0.2%relative to calculated intrinsic value
9.00%
Exp: 0%0%
i

Growth runway slowdown

This value provides a time window for the growth rate to decline beyond Stage 1 toward the terminal rate. Longer windows are most useful for companies with high growth starting conditions or strong competitive advantages. This option stretches out the growth rate slowdown across 5, 10, or 15-year steps. A high-growth starting condition (exceeding a 25% initial growth rate) automatically applies a curve decay to simulate realistic, rapid market saturation.
i

Terminal growth rate

With long-term inflation between 3-5%, revenue must grow by that baseline to maintain flat real-world market share. This value sets the permanent terminal growth rate to factor into the valuation beyond the growth slowdown runway toward maturity.

3-Stage Financial Runway Horizon

🧠 Perpetuity Horizon Engine (Stage 3: Post-2035)

Terminal FCF Base$0.07B
Perpetuity TV Value$1.26B
Discounted TV (PV)$0.53B
TV Weighting %58.0%
⚠️
Financial Model Disclaimer & Risk Disclosure: This interactive scenario simulator is an educational sandbox provided strictly for informational and analytical research purposes. Core historical financial statements and consensus estimates are sourced directly via Financial Modeling Prep (FMP). All downstream outputs are entirely deterministic, hypothetical projections generated by combining automated mathematical formulas (including linear interpolation and Gaussian bell-curve decay models) with user-selected variables and third-party financial data inputs. Users assume all liability for trading decisions executed based on these sandbox calculations.

📘 Full Research Report

ℹ️

AI-Generated Research: This report is for informational purposes only.

📘 UNIVERSAL HEALTH REALTY INCOME TRU (UHT) — Investment Overview

🧩 Business Model Overview

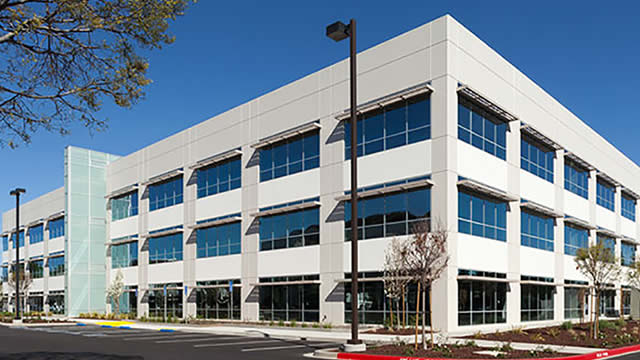
UHT is a healthcare-focused real estate investment trust that owns and manages income-producing properties used by healthcare providers, with a meaningful portion of its revenue tied to tenants associated with Universal Health Services’ operating platform and broader healthcare demand. The business model is anchored in a landlord–tenant value chain: UHT acquires or develops healthcare real estate (commonly including medical office and related facilities), then leases those properties to operating companies under structured lease terms. Over time, cash flows are generated from rent and are supported by lease duration, renewal economics, and property-level cost containment.

The investment case depends less on “property flips” and more on the durability of healthcare tenant demand, the resilience of healthcare utilization trends, and the contractual quality of rental streams (including how operating costs and rent escalators are allocated).

💰 Revenue Streams & Monetisation Model

UHT’s monetisation is primarily rental-based and structured to deliver recurring cash flow rather than project-based variability. The central drivers are:

  • Base rent under long-term leases: the core recurring revenue stream.
  • Rent escalators and contractual rent growth: where embedded increases exist, they help link revenue to inflation and healthcare cost trends.
  • Expense recovery (where applicable): depending on lease structure, portions of property operating costs may be passed through to tenants, supporting NOI stability.
  • Portfolio occupancy and lease renewal economics: maintaining high occupancy and favorable renewals supports steady cash generation.

Margin profile in healthcare REITs is typically most influenced by (1) property-level occupancy, (2) tenant credit quality, (3) the degree of pass-through for operating expenses, and (4) rent growth embedded in lease terms. UHT’s focus on healthcare real estate generally aims to reduce “usage volatility” versus assets tied to discretionary consumer demand.

🧠 Competitive Advantages & Market Positioning

UHT’s moat is not derived from technology or network effects; it is derived from healthcare asset specialization and tenant-level stickiness created by contractual and operational realities.

  • High switching costs (tenant stickiness): healthcare facilities often require site- and layout-specific buildouts, specialized operational flow, and regulatory/operational continuity. Relocating an operating platform can be costly and disruptive, increasing the probability that tenants renew or remain in place.
  • Integrated ecosystem effect (relationship-driven demand): UHT’s healthcare orientation and tenant relationships create a repeatable pathway for demand, particularly when operating tenants expand capacity at locations aligned with UHT’s asset footprint.
  • Contractual income quality: lease terms (including duration, renewal windows, and expense pass-through mechanics) can reduce operating leverage risk compared with more purely market-rent-driven assets.

Competitive benchmarking:

  • Welltower (WELL): targets senior housing and outpatient/medical real estate with broader geographic diversification and a different operating mix.
  • Healthpeak (PEAK): emphasizes life science and medical office platforms with exposure to a wider range of tenants.
  • Medical Properties Trust (MPW): has historically focused on hospitals and related healthcare facilities with different lease structures and typically different tenant fundamentals.

Compared with these peers, UHT’s positioning is more concentrated in healthcare real estate tied to operating needs where tenant continuity and relationship-driven leasing matter. Rivals often compete through scale, diversification across property types, and broader tenant universes; UHT competes through specialized healthcare alignment and the stickiness that long-lived healthcare operating platforms can provide.

🚀 Multi-Year Growth Drivers

Over a 5–10 year horizon, UHT’s growth should be supported by secular demand drivers for healthcare real estate and by reinvestment/redevelopment opportunities where tenant demand supports higher-quality cash flows. Key drivers include:

  • Aging demographics and utilization growth: greater demand for outpatient services, diagnostic care, and ongoing treatment often requires additional and/or updated healthcare space.
  • Shift toward outpatient and specialized care: growth in specialized clinics and medical office demand can support healthcare real estate with the right location and facility fit.
  • Provider consolidation and platform expansion: healthcare operators expand footprints to capture efficiencies and scale, which can create incremental leasing opportunities for well-located assets.
  • Rent growth through lease structure: where escalators exist and where renewals reflect inflation and healthcare-specific cost dynamics, revenue growth can be more resilient than pure market-rent models.
  • Repositioning and modernization: selective upgrades can extend asset life, support tenant retention, and reduce long-term obsolescence risk.

⚠ Risk Factors to Monitor

  • Tenant concentration and credit risk: any meaningful exposure to specific operating tenants can amplify downside if those operators face margin compression, reimbursement pressure, or capital constraints.
  • Lease rollover and renewal risk: long-term value depends on renewal economics and the ability to re-lease space on acceptable terms; unfavorable renewals can pressure cash flow.
  • Interest rate and refinancing risk: REIT cash flows are sensitive to borrowing costs and debt maturity schedules; rising rates can affect the cost of capital.
  • Regulatory and reimbursement changes: healthcare policy shifts can impact operator financial performance and, indirectly, their ability to meet rent obligations.
  • Property obsolescence: healthcare technology and care-delivery models evolve; inadequate modernization can reduce tenant demand and occupancy quality.
  • Macroeconomic and credit-cycle stress: healthcare demand is relatively resilient, but in weak credit environments tenants can defer expansion or seek rent relief.

📊 Valuation & Market View

Markets typically value healthcare REITs through cash-flow-based metrics rather than traditional earnings measures, with valuation framed around FFO/AFFO and dividend sustainability. Common valuation approaches include:

  • EV/EBITDA or comparable cash-flow multiples: used as a cross-sectional yardstick, adjusted for property-level capital intensity and lease structure.
  • Price-to-FFO/AFFO: reflects the recurring nature of rental cash flows and the durability of occupancy and rent growth.
  • Dividend yield and payout coverage: investors focus on the relationship between distributable earnings and required reinvestment/maintenance capex.

For UHT specifically, factors that often move valuation include (1) quality and growth of same-asset NOI, (2) occupancy durability, (3) tenant credit stability, and (4) the capital structure’s sensitivity to interest rates. In healthcare REITs, the market frequently rewards visibility of cash flows and contractual income quality.

🔍 Investment Takeaway

UHT’s long-term thesis is rooted in healthcare real estate specialization and tenant stickiness supported by relationship-driven leasing and contractual income structures. The primary moat is structural: healthcare operating platforms face meaningful switching costs and typically value continuity of space, which can support stable rental cash flows through different points in the cycle. The investment case should be evaluated through the lens of tenant credit resilience, lease rollover economics, and interest-rate/refinancing discipline—key determinants of distributable cash flow durability over a full cycle.


⚠ AI-generated — informational only. Validate using filings before investing.

📰 Market News & Coverage

15 Stories Available

Real-time institutional reporting and market updates for UHT.

seekingalpha.com2026-05-13

Universal Health Realty Income Trust: A Fairly Valued 7.3% REIT

Universal Health Realty Income Trust earns a 'Hold' rating, offering a 7.34% yield but trading near fair value. UHT's 40-year dividend growth streak remains intact, though a payout ratio of 85% limits future increases. Key risks include Medicaid reimbursement cuts from OBBBA and $359.5M floating-rate debt maturing in 2028.

prnewswire.com2026-04-27

UNIVERSAL HEALTH REALTY INCOME TRUST REPORTS 2026 FIRST QUARTER FINANCIAL RESULTS

Consolidated Results of Operations - Three-Month Periods Ended March 31, 2026 and 2025: KING OF PRUSSIA, Pa., April 27, 2026 /PRNewswire/ -- Universal Health Realty Income Trust (NYSE:UHT) announced today that for the three-month period ended March 31, 2026, net income was $5.0 million, or $.36 per diluted share, as compared to $4.8 million, or $.34 per diluted share, during the first quarter of 2025.

prnewswire.com2026-04-27

UNIVERSAL HEALTH SERVICES, INC. ANNOUNCES FINANCIAL RESULTS FOR THE THREE-MONTH PERIOD ENDED MARCH 31, 2026

Consolidated Results of Operations, As Reported and As Adjusted  – Three-month periods ended March 31, 2026 and 2025: KING OF PRUSSIA, Pa., April 27, 2026 /PRNewswire/ -- Universal Health Services, Inc. (NYSE: UHS) announced today that its reported net income attributable to UHS was $348.7 million, or $5.65 per diluted share, during the first quarter of 2026, as compared to $316.7 million, or $4.80 per diluted share, during the first quarter of 2025.

seekingalpha.com2026-04-10

Buy 8 S&P 600 Small-Cap 'Safer' April DiviDogs

The S&P 600 Small Cap index offers exposure to quality small-cap stocks with earnings requirements, providing growth potential and less analyst coverage. Eight S&P 600 small-cap dividend stocks meet the 'IDEAL' criteria: dividends from $1K invested exceed share price and free cash flow supports payouts. Top ten S&P 600 small-cap dividend dogs are projected to deliver an average 64.97% net gain by April 2027, with above-market volatility.

defenseworld.net2026-04-08

Universal Health Realty Income Trust (NYSE:UHT) Shares Cross Above 200 Day Moving Average – Time to Sell?

Shares of Universal Health Realty Income Trust (NYSE: UHT - Get Free Report) crossed above its 200-day moving average during trading on Tuesday. The stock has a 200-day moving average of $40.18 and traded as high as $41.97. Universal Health Realty Income Trust shares last traded at $41.7290, with a volume of 49,408 shares traded.

defenseworld.net2026-03-21

Universal Health Realty Income Trust (NYSE:UHT) Share Price Crosses Above 200 Day Moving Average – Here’s What Happened

Universal Health Realty Income Trust (NYSE: UHT - Get Free Report)'s stock price crossed above its 200-day moving average during trading on Friday. The stock has a 200-day moving average of $40.26 and traded as high as $42.95. Universal Health Realty Income Trust shares last traded at $40.5970, with a volume of 244,526 shares changing

247wallst.com2026-03-17

A 38-Year Dividend Streak Looks Solid, Until You Check the Balance Sheet

Universal Health Realty Income Trust ( NYSE:UHT ) has delivered an unbroken streak of quarterly dividend increases spanning over three decades.

defenseworld.net2026-03-16

Reviewing Universal Health Realty Income Trust (NYSE:UHT) and EastGroup Properties (NYSE:EGP)

Universal Health Realty Income Trust (NYSE: UHT - Get Free Report) and EastGroup Properties (NYSE: EGP - Get Free Report) are both finance companies, but which is the better business? We will compare the two businesses based on the strength of their valuation, risk, earnings, profitability, institutional ownership, dividends and analyst recommendations. Earnings and Valuation This table

prnewswire.com2026-03-11

UNIVERSAL HEALTH REALTY INCOME TRUST ANNOUNCES DIVIDEND

KING OF PRUSSIA, Pa., March 11, 2026 /PRNewswire/ -- Universal Health Realty Income Trust (NYSE:UHT) announced today that its Board of Trustees voted to pay a dividend of $.745 per share on March 31, 2026 to shareholders of record as of March 23, 2026.

prnewswire.com2026-03-09

Universal Health Services, Inc. to Acquire Talkspace, Inc.

Industry-leading virtual behavioral healthcare platform accelerates outpatient strategy with expanded access to care KING OF PRUSSIA, Pa. and NEW YORK, March 9, 2026 /PRNewswire/ -- Universal Health Services, Inc. (NYSE: UHS) announced today that it has entered into a definitive agreement to acquire Talkspace, Inc. (NASDAQ: TALK) for $5.25 per share.

zacks.com2026-03-02

Universal Health Realty Stock Gains Post Q4 Earnings, Revenue Slips

UHT posts lower fourth-quarter 2025 earnings and softer revenue, raises dividend and advances new Florida medical office development.

prnewswire.com2026-02-25

UNIVERSAL HEALTH REALTY INCOME TRUST REPORTS FINANCIAL RESULTS FOR THE THREE AND TWELVE-MONTH PERIODS ENDED DECEMBER 31, 2025

Consolidated Results of Operations - Three-Month Periods Ended December 31, 2025 and 2024: KING OF PRUSSIA, Pa., Feb. 25, 2026 /PRNewswire/ -- Universal Health Realty Income Trust (NYSE:UHT) announced today that for the three-month period ended December 31, 2025, net income was $4.3 million, or $.31 per diluted share, as compared to $4.7 million, or $.34 per diluted share, during the fourth quarter of 2024.

prnewswire.com2026-02-25

UNIVERSAL HEALTH SERVICES, INC. ANNOUNCES FINANCIAL RESULTS FOR THE THREE AND TWELVE-MONTH PERIODS ENDED DECEMBER 31, 2025 AND OPERATING RESULTS FORECAST FOR THE FULL YEAR OF 2026

Consolidated Results of Operations, As Reported and As Adjusted  – Three-month periods ended December 31, 2025 and 2024: KING OF PRUSSIA, Pa., Feb. 25, 2026 /PRNewswire/ -- Universal Health Services, Inc. (NYSE: UHS) announced today that its reported net income attributable to UHS was $445.9 million, or $7.06 per diluted share, during the fourth quarter of 2025, as compared to $332.4 million, or $4.96 per diluted share, during the fourth quarter of 2024.

seekingalpha.com2026-02-21

Universal Health Realty Income Trust: Good For Income Through Cycles

Universal Health Realty Income Trust: Good For Income Through Cycles

defenseworld.net2026-01-21

Universal Health Realty Income Trust (NYSE:UHT) Share Price Passes Above Two Hundred Day Moving Average – Here’s Why

Universal Health Realty Income Trust (NYSE: UHT - Get Free Report)'s stock price passed above its two hundred day moving average during trading on Tuesday. The stock has a two hundred day moving average of $39.61 and traded as high as $40.30. Universal Health Realty Income Trust shares last traded at $40.0150, with a volume

📊 AI Financial Analysis

Powered by StockMarketInfo
Earnings Data: Q Ending 2026-03-31

"UHT posted Q1 2026 revenue of $24.53M and net income of $5.02M, with diluted EPS of $0.36. Net income margin was 20.46%. On a YoY basis, revenue declined 0.08% (from $24.55M in Q1 2025) while net income increased 5.13% (from $4.78M). QoQ, revenue fell 66.80% versus Q4 2025 ($73.96M), and net income rose 16.06% versus Q4 2025 ($4.32M), indicating an earnings-strength quarter despite lower top-line. Profitability is mixed over the last four quarters: gross margin expanded sharply in Q1 2026 to ~70.6% (vs ~94.4% in Q4 2025 and ~94.4% in Q3/Q2 2025), while operating income margin was 36.52% in Q1 2026 (below Q4 2025’s 37.44% but above Q3 2025’s 33.18%). The company’s cash flow data show a Q1 2026 operating/cash generation line at 0 (with net income $5.02M), which limits cash-flow quality assessment for the quarter. Shareholder returns from financial filings alone are hard to confirm; however, price momentum is positive with a 1-year price change of +12.75%. Dividend yield in the latest ratios is ~1.84%, suggesting a modest yield contribution. Overall, the investment case hinges on sustaining net income with volatility in reported margins and the notably inconsistent cash flow presentation."

Revenue Growth

Neutral

QoQ revenue fell 66.80% (from $73.96M in Q4 2025 to $24.53M in Q1 2026). YoY revenue was essentially flat at -0.08%.

Profitability

Neutral

Net income rose 5.13% YoY to $5.02M, but gross margin deteriorated materially in Q1 2026 to ~70.6% versus ~94.4% in Q4/Q3/Q2 2025. Operating margin was 36.52% (below Q4’s 37.44%).

Cash Flow Quality

Caution

Q1 2026 shows net cash provided by operating activities as 0 despite positive net income ($5.02M), making cash-flow quality/coverage difficult to validate. Dividends paid were 0 in Q1 2026.

Leverage & Balance Sheet

Positive

Total assets were $563.76M in Q1 2026, roughly stable vs Q2–Q4 2025 (~565M range). Equity was $147.80M vs $152.38M in Q4 2025, while net debt remained high at $382.13M.

Shareholder Returns

Neutral

Price momentum is positive: +12.75% over 1Y. Latest dividend yield is ~1.84%, implying moderate total yield contribution; buyback data is 0 in Q1 2026.

Analyst Sentiment & Valuation

Fair

No price target provided. Valuation appears expensive on price-to-sales (~22.8x) and price-to-earnings (~27.9x), tempering the score.

Disclaimer:This analysis is AI-generated for informational purposes only. Accuracy is not guaranteed and this does not constitute financial advice.

Fundamentals Overview

Loading fundamentals overview...

📋 Official Regulatory 10-K / 10-Q SEC Filings

Direct authenticated documentation links to audited SEC database reports for UHT.

SEC EDGAR Live Feed
Loading financial data and tables...
📁

SEC Filings (UHT)

© 2026 Stock Market Info — Universal Health Realty Income Trust (UHT) Financial Profile