
Voyager Technologies, Inc. (VOYG) Market Cap
Voyager Technologies, Inc. has a market capitalization of $1.45B.
Price: $24.53
▲ 0.56 (2.34%)
Market Cap: 1.45B
NYSE · time unavailable
CEO: Dylan E. Taylor
Sector: Industrials
Industry: Aerospace & Defense
IPO Date: 2025-06-11
Website: http://voyagertechnologies.com
Voyager Technologies, Inc. (VOYG) - Company Information
Market Cap: 1.45B|Sector: Industrials
Company Profile
Voyager Technologies, Inc. operates as a defense technology and space solutions company in the United States, Europe, the Middle East, and internationally. It operates through three segments: Defense & National Security, Space Solutions, and Starlab Space Stations. The Defense & National Security segment provides defense systems, including solid propulsion subsystems; signal intelligence systems; space-qualified radiation-hardened laser and radio frequency (RF) communications systems and advanced electro-optical and digital systems comprising transceivers, mission-data transmitters, and command and data handling systems; guidance, navigation, and control systems that include sun sensors, star trackers, and inertial measurement units; artificial intelligence-powered edge computing products; and space maneuver. Its Space Solutions segment offers advanced space technology systems, such as in-space propulsion systems with applications for orbital servicing, manufacturing, and deep space exploration; space infrastructure, including the Bishop Airlock, a module attached to the ISS that enables movement of equipment, supplies, and payloads between the ISS and open space; and space science and mission management services, such as the Space Acceleration Measurement System (SAMS) on the ISS. The Starlab Space Stations segment operates a commercial space station and provides continued permanent human presence in space. It serves defense, national security, and space industries. The company was formerly known as Voyager Space Holdings, Inc. and changed its name to Voyager Technologies, Inc. in February 2025. Voyager Technologies, Inc. was incorporated in 2019 and is headquartered in Denver, Colorado.
Analyst Sentiment
From 12 Active Polls
1Y Forecast: $57.50
▲ +134.4% Potential Upside
Consensus Target Metrics
Low Bound
$55
Median
$58
High Bound
$60
Average
$58
Price & Moving Averages
🎯 Wall Street Analyst Intelligence Report
1-Year structural target targets, chart projections, and sentiment maps.
Consensus Trend Projection
Trailing closures vs. 12-month metrics map.
Analyst Vote Distribution
Aggregate institutional coverage sentiment weights.
📊 Historical Valuation Multiples
Real-time Trailing Twelve Month (TTM) momentum side-by-side with discrete quarterly metrics.
| Fiscal Quarter | TTM | Q1 2026 | Q4 2025 | Q3 2025 | Q2 2025 | Q1 2025 | Q2 2024 | Q1 2024 |
|---|---|---|---|---|---|---|---|---|
| Period Ending | Trailing 12M | Mar 31, 2026 | Dec 31, 2025 | Sep 30, 2025 | Jun 30, 2025 | Mar 31, 2025 | Jun 30, 2024 | Mar 31, 2024 |
| Market Cap ($M) | 1,454 | 1,365 | 1,527 | 1,739 | 2,251 | 3,179 | 3,179 | 3,179 |
| Enterprise Value ($M) | 1,516 | 1,427 | 1,502 | 1,337 | 1,791 | 3,104 | — | 3,149 |
| Price to Earnings Ratio (P/E) | -11.20 | -7.80 | -12.57 | -26.59 | -15.33 | -23.93 | -27.69 | -40.34 |
| Price/Earnings-to-Growth Ratio (PEG) | — | — | -0.70 | — | -0.47 | — | -1.30 | — |
| Price to Sales Ratio (P/S) | 8.70 | 38.72 | 32.73 | 43.94 | 49.28 | 92.13 | 86.74 | 105.21 |
| Price to Book Ratio (P/B) | 4.01 | 3.82 | 3.98 | 2.94 | 4.06 | 22.01 | — | -63.76 |
| Price to Free Cash Flow Ratio (P/FCF) | -5.70 | -15.02 | -24.20 | -32.36 | -47.44 | -76.93 | -115.93 | -132.71 |
| Enterprise Value to Sales (EV/Sales) | — | 40.47 | 32.20 | 33.76 | 39.22 | 89.95 | — | 104.21 |
| Enterprise Value to EBITDA (EV/EBITDA) | -15.00 | -42.75 | -61.87 | -81.87 | -66.18 | -141.87 | — | -376.89 |
| Debt to Equity Ratio | -0.61 | 1.38 | 1.22 | 0.02 | 0.02 | 0.69 | — | — |
📰 Market News & Coverage
15 Stories AvailableReal-time institutional reporting and market updates for VOYG.

Voyager Technologies, Inc. (VOYG) Expected to Beat Earnings Estimates: What to Know Ahead of Q2 Release
Voyager Technologies, Inc. (VOYG) possesses the right combination of the two key ingredients for a likely earnings beat in its upcoming report. Get prepared with the key expectations.

Voyager Wins Contract with Sandia National Laboratories
DENVER--(BUSINESS WIRE)--Voyager Technologies (NYSE: VOYG) was awarded a new mission management contract with Sandia National Laboratories to fly their Big Boy demonstration aboard the International Space Station in 2027. The contract underscores the continued and growing demand for access to low-Earth orbit for national security research, with additional contracts expected to follow.“Our station-agnostic, integrated approach to mission management enables space access for everyone from academia.

Voyager Secures Geisinger Partnership
DENVER--(BUSINESS WIRE)--Voyager Technologies (NYSE: VOYG) has secured Geisinger, one of the largest integrated health systems in the United States, as a Voyager Institute for Space, Technology and Advancement (VISTA) partner. The memorandum of understanding (MOU) marks a significant expansion of VISTA's reach into the life sciences and biopharma sector, establishing a framework for joint research programs that translate the unique conditions of microgravity into breakthrough pathways for human.

Voyager and Penn State to Advance Pennsylvania's Space Economy
DENVER--(BUSINESS WIRE)--Voyager Technologies (NYSE: VOYG) signed a memorandum of understanding (MOU) with The Pennsylvania State University, expanding the Voyager Institute for Space, Technology and Advancement (VISTA) ecosystem. The collaboration will develop joint research programs and applications across in-space research and manufacturing and national security, fusing commercial innovation with defense mission expertise.“This announcement is the latest in a series of strategic initiatives t.

Voyager Technologies Completes Astrobotic Acquisition And Was Just Awarded a $298 Million Contract From NASA
Astrobotic is a potentially very synergistic purchase for the company. At a stroke, it makes Voyager an important operator in the lunar segment.

Voyager Awarded $298M NASA Contract Under Completed Astrobotic Acquisition
DENVER--(BUSINESS WIRE)---- $VOYG #MissionReady--Voyager Technologies (NYSE: VOYG) has completed its acquisition of Astrobotic Technology, Inc. The close comes as NASA recently awarded two new lunar lander missions to the company and Griffin Mission One shipped to NASA's Jet Propulsion Laboratory for environmental testing ahead of launch later this year."As America marks 250 years, the next chapter of this nation's leadership begins on the lunar surface," said Dylan Taylor, Chairman & CEO, Voyager. "Our company ref.
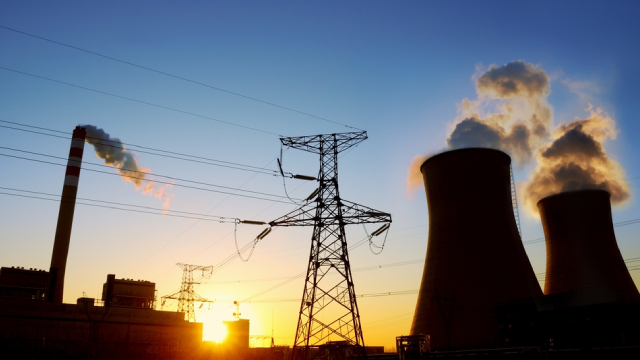
Congresswoman Scoops Up Brookfield Renewables Stock Six Times In Three Days: Why The Trade Is Drawing Attention
The trading activity of members of Congress continues to be closely monitored by retail investors, especially when the stocks bought could land deals from committees the members serve on.

Voyager Awarded Multi-Million-Dollar Contract for an Agentic-AI Platform
DENVER--(BUSINESS WIRE)--Voyager Technologies (NYSE: VOYG) was awarded a contract to deliver an agentic-AI spectrum operations platform for an undisclosed program. “There is a critical and urgent need for intelligent tools that help operators optimize everything from mission management and command and control to intelligence extraction and exploitation of ground, sea, air and space systems, enabling them to move smarter and faster,” said Matt Kuta, president, Voyager. “Our agentic solution is a.

NASA Just Made A Huge Bet That These 3 Companies Will Get America Back To The Moon Before China
NASA Administrator Jared Isaacman has framed the current moment in stark terms: “We are in a new space race to the lunar surface, and if we fall behind, we may never catch up.

Voyager Closes Upsized $250 Million Credit Facility
DENVER--(BUSINESS WIRE)---- $VOYG #MissionReady--Voyager Technologies (NYSE: VOYG) closed a $250 million credit facility led by J.P. Morgan. The upsized facility expands Voyager's financial flexibility, providing liquidity at scale to support accelerating customer demand across the company's space, defense and national security portfolio. “We continue to maintain a fortress balance sheet,” said Phil De Sousa, chief financial officer, Voyager. “We are building a generational defense and space company, and this capital.
Voyager Technologies: Buying Capability Before Buying Profits
Voyager Technologies, Inc. remains a Speculative Buy, with its core opportunity in national security and the Starlab commercial space station collaboration. VOYG's $300 million Astrobotic acquisition enhances lunar capabilities but increases cash burn and near-term capital needs. Recent NASA and lunar delivery contracts are likely loss-leading, focused on maturing technology and positioning for future lunar base opportunities.

Voyager Announces Second Quarter 2026 Earnings Results Call
DENVER--(BUSINESS WIRE)--Voyager Technologies (NYSE: VOYG) will host its second quarter 2026 earnings results conference call Tuesday, August 4, 2026, at 9 a.m. ET with the senior management team. Second quarter 2026 results will be published after the market closes Monday, August 3, 2026.A live webcast of the call will be made available on the Events & Presentations section of Voyager's investor relations website at investors.voyagertechnologies.com. The earnings release and presentation wi.

The SpaceX IPO Lifted the Whole Space Economy -- Including the Public Companies Building the Road Back to the Moon
The SpaceX IPO Lifted the Whole Space Economy -- Including the Public Companies Building the Road Back to the Moon PR Newswire
This Space Station Company Will Now Go to the Moon, Too
Voyager Technologies is leading a coalition to build a new international space station. Voyager just lifted its sights even higher, though, buying Astrobotic to give it a position in the moon race, too.

We will be living and working on the moon in the next five years, says Voyager Technologies CEO
Dylan Taylor, Voyager Technologies CEO, joins 'Closing Bell Overtime' to talk investments in space, the SpaceX IPO, and what the future of private space exploration will look like.
Related Companies in Industrials





📊 AI Financial Analysis
Powered by StockMarketInfo"VOYG reported Q1 2026 revenue of $35.25M and net income of -$43.98M (EPS: -$0.75). On a QoQ basis, revenue fell from $46.65M in Q4 2025 to $35.25M (-24.5%). Net losses worsened: net income declined from -$30.22M (Q4) to -$43.98M (-45.6%). YoY, revenue rose from $34.51M in Q1 2025 to $35.25M (+2.1%), but profitability deteriorated materially: net income decreased from -$26.94M (Q1 2025) to -$43.98M (worsening by -63.4%). Gross margin stayed negative (Q1 2026 gross margin -4.4%) and operating/net margins remained deeply negative, with operating margin at -126.7% and net margin at -124.8%. Cash flow remains negative. Operating cash flow was -$39.7M and free cash flow was -$90.8M in Q1 2026, while cash at quarter-end was $429.4M (down from $491.3M in Q4). Total shareholder returns are pressured by weak price momentum: the stock is down 44.6% over the past year with no dividend yield. Analyst valuation context appears supportive versus an assumed current price (consensus $42.5 vs ~$31.31), but losses and cash burn limit near-term confidence."
Revenue Growth
QoQ revenue declined -24.5% (Q4 2025 $46.65M to Q1 2026 $35.25M). YoY revenue is modestly up +2.1% ($34.51M to $35.25M), indicating limited top-line traction.
Profitability
Margins remain severely negative. Q1 2026 gross margin was -4.4% vs +3.1% in Q4 2025, and net margin was -124.8% vs -64.8% in Q4. Net income worsened YoY by -63.4% (-$26.9M to -$44.0M).
Cash Flow Quality
Operating cash flow was -$39.7M and free cash flow -$90.8M in Q1 2026, with cash declining to $429.4M from $491.3M. No dividends were paid; burn exceeds earnings by design given continued losses.
Leverage & Balance Sheet
Balance sheet liquidity is strong for a loss-making company (cash $429M; current ratio ~4.57). However, retained earnings are deeply negative and long-term debt increased materially to $484.6M (from $461.0M in Q4), increasing structural risk.
Shareholder Returns
Total shareholder return is weak: 1-year price change is -44.6% and dividend yield is 0. Buybacks/financing signals in the cash flow are not sufficient to offset capital depreciation.
Analyst Sentiment & Valuation
Consensus price target of $42.5 vs current price ~$31.31 implies potential upside on paper. However, valuation support is limited by ongoing large net losses and negative free cash flow.
Disclaimer:This analysis is AI-generated for informational purposes only. Accuracy is not guaranteed and this does not constitute financial advice.
Fundamentals Overview
VOYG delivered a strong Q1 with record $275M backlog (+54% YoY), $45M bookings, and a 1.3 book-to-bill, signaling accelerating defense/space demand—especially Golden Dome architectures. A key Q1 business-development catalyst was a Raytheon award for standard missile interceptor SM-3 technologies (preproduction) and newly referenced space-based interceptor momentum via Anduril. While revenue was $35M and modestly up, profitability remains pressured: adjusted EBITDA loss was $33M and EPS loss was $0.61, consistent with deliberate engineering/R&D and infrastructure investment ahead of higher-rate production. Management raised 2026 revenue guidance to $230M–$255M (+38% to +53% YoY) and provided a clear sequential ramp plan (from $35M Q1 to high-$40M Q2, with ~33%/67% first-half/second-half split). Gross margin should move from negative/pressured early-year levels toward low mid-single digits in Q2, mid-to-high teens in Q3, and mid-20s in Q4 as leverage kicks in and contract mix improves.
 Growth Catalysts
- Golden Dome momentum: Q1 backlog reversal/acceleration and multiple awards across Golden Dome architecture tied to upgrades and next-generation interceptor volumes
- Raytheon win adds Golden Dome relevance to SM-3 standard missile interceptor program (preproduction) with potential upside into subsequent years/production ramp
- Space-based interceptors partnership traction: relationship with Anduril announced for SBI work streams
- Capacity expansions to support higher-rate execution (American Defense Complex Southern Colorado ground-breaking; Space Beach facility in Long Beach to improve throughput and timing)
- AI investment aimed at materially shortening go-to-market and delivery timelines via accelerated technical solution development (e.g., custom ASIC design cycle time reduction)
Business Development
- Raytheon: contract award to develop advanced technologies for Raytheon’s standard missile interceptor program (SM-3) received in Q1 as an initial preproduction award
- Anduril: relationship announced for space-based interceptors (timing referenced as issued ~15 minutes prior to analyst Q&A)
- NASA: Starlab milestone payments and ongoing CLD/RFI/RFP pathway; also selected Voyager for PAM7 private astronaut mission (VOYG-1) targeted no earlier than 2028
- Yonsei University (South Korea): strategic partnership under VISTA Science Park / in-space research ecosystem
- Oguda University (Hungary): strategic partnership under VISTA Science Park / in-space research ecosystem
- Ohio State University / VISTA Science Park ecosystem: platform-agnostic in-space research/manufacturing/services park referenced as located on OSU campus
- Lockheed Martin: long-term collaboration referenced in context of fuel propulsion technology deployed alongside next-gen interceptor architecture
Financial Highlights
- Record backlog: $275 million (+54% YoY) driven by $45 million bookings and 1.3 book-to-bill
- Revenue: $35 million in Q1, modestly up YoY and in line with plan
- Adjusted EPS: loss of $0.61/share
- Adjusted EBITDA: loss of $33 million driven by deliberate investment in engineering talent, internally funded R&D, and infrastructure
- Q1 gross margin pressure: gross profit was negative (program mix + incremental investment ahead of growth/scale); management guided full-year gross margin mid-teens
- Starlab: received $24 million NASA milestone cash in Q1; inception-to-date milestone cash receipts total $207 million
- Guidance raise: 2026 revenue guidance to $230M–$255M (+38% to +53% YoY)
- R&D intensity: internally funded IRAD ~17% of revenue in Q1; total innovation spend 48% excluding Starlab
- 2026 gross margin expectation: mid-teens for the year; internally funded R&D targeted ~20% of sales
Capital Funding
- Cash at end of Q1: $429 million
- Credit facilities available: $212 million
- Total liquidity: $641 million
- Planned Q2 action: upsizing credit facility during Q2
- Capex (excluding Starlab): approximately $60 million to $70 million for scaling domestic production, advanced electronics, propulsion capacity, and infrastructure
Strategy & Ops
- Segment reporting simplification: from 3 segments to 2 segments starting Q1—Defense and Space Technologies; and Starlab Space Stations
- Organizational integration rationale: increasing convergence of defense/national security and space; single executive leadership previously (Matt Magana) and integration progress post-acquisitions (EMSI, ExoTerra, Estes)
- Production scaling infrastructure: January ground-breaking for Voyager American Defense Complex expansion; March launch of Space Beach in Long Beach, CA adjacent to customers
- AI implementation focus: agentic/technical AI sponsored by senior leadership and DARPA labs CTO hire; aimed at shortening technical cycle times (e.g., ASIC/custom components) and reducing go-to-market delay
Market Outlook
- 2026 revenue guidance: $230 million to $255 million (38%–53% YoY)
- Gross margin 2026: mid-teens full-year
- Sequential revenue ramp expectation: from $35M Q1, revenue increases sequentially by ~37% to “high 40s” in Q2
- Revenue split expectation: ~33% of full-year revenue in first half and ~67% in second half
- Book-to-bill expectation: exceed 1.0 again in Q2; bookings momentum continues early Q2 with substantial second-quarter bookings already placed
- Gross margin path guidance: positive in Q2 (low mid-single digits), mid-to-high teens in Q3, mid-20s in Q4
Risks & Headwinds
- Q1 and early-year headwinds from revenue roll-offs: management cited Space Doc 2 contract wrapping (about $5M revenue headwind into 2026 first quarter) and Airbus software design radio program wrapping early 2026
- Gross margin compression from incremental investment ahead of higher-rate production and program readiness (negative gross profit in Q1; challenging first half expected)
- Starlab funding/timeline uncertainty referenced indirectly by analysts around NASA core-module vs commercial free-flyer path; management expects relevance under either model but requires NASA decisions (awaiting RFI response likely leading to RFP)
- Execution risk implied by “deliberate investment” producing adjusted EBITDA/EPS losses despite demand strength
Q&A: Analyst Interest
- Golden Dome backlog and contract timing: Management described Q1 as a “seminal milestone quarter,” citing Raytheon inclusion for standard missile interceptor SM-3 as a major win and an accelerated ramp versus expectations, plus additional SBI traction. They linked backlog reversal to tech validation and an expanding pipeline.
- Starlab CLD uncertainty and NASA path: Management said they remain optimistic regardless of NASA’s core-module plus commercial attachments versus commercial free-flyers approach. They referenced responding to NASA’s RFI, awaiting an RFP likely next, and stated they’re already at 130% of commercial demand capacity booked.
- Near-term margin trajectory and gross margin drivers: Management attributed Q1 gross margin weakness to upfront investment and program mix ahead of scale. They guided positive gross profit in Q2 (low mid-single digits), mid-to-high teens in Q3, and mid-20s in Q4 as leverage and the revenue ramp materialize sequentially.
Sentiment: POSITIVE
Note: This summary was synthesized by AI from the VOYG Q1 2026 earnings transcript. Financial data is complex; please verify all metrics against official SEC filings before making investment decisions.
📋 Official Regulatory 10-K / 10-Q SEC Filings
Direct authenticated documentation links to audited SEC database reports for VOYG.